

Key Insights
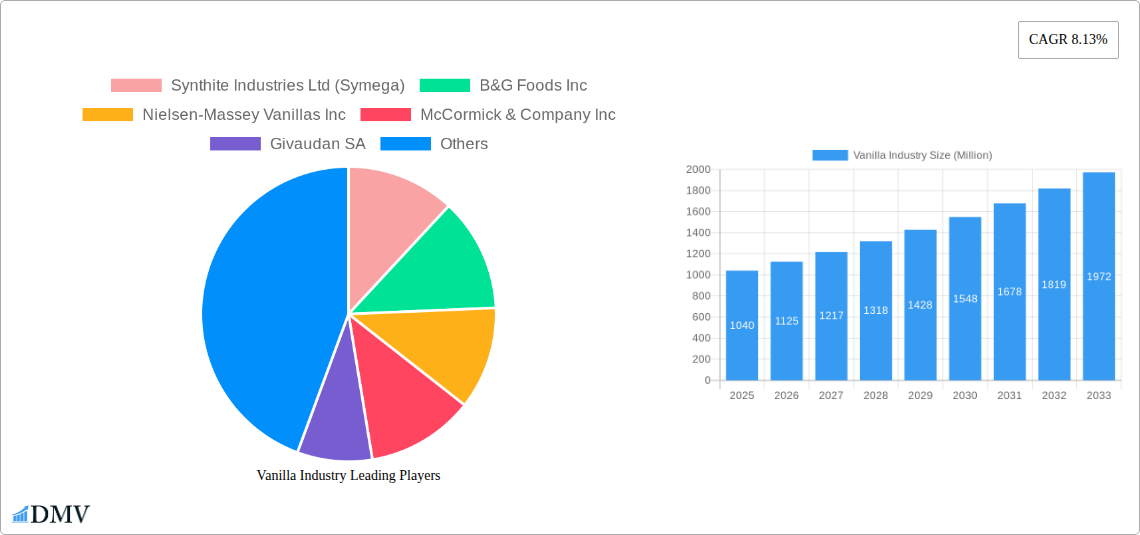
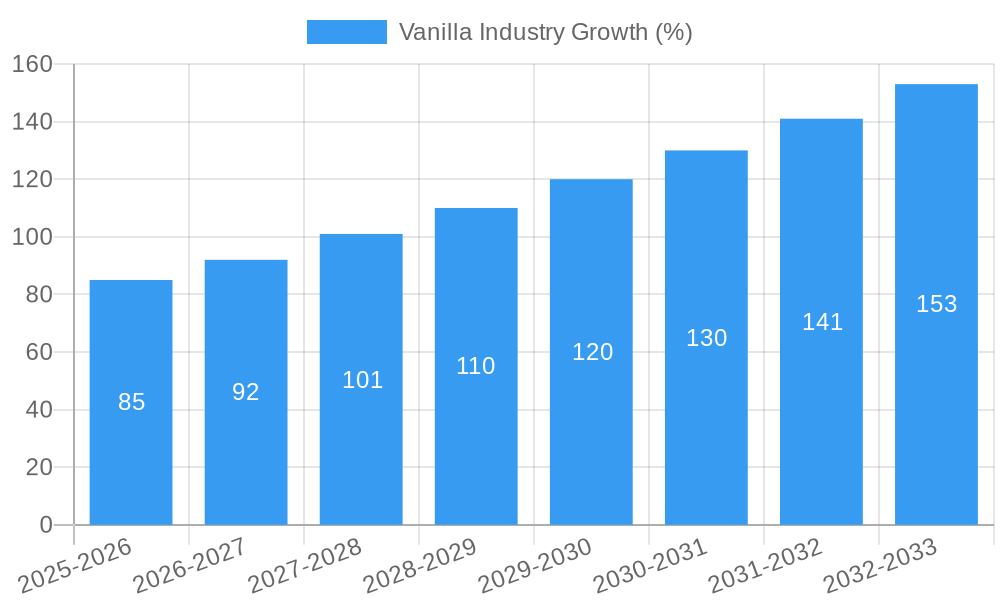
The global vanilla market, valued at $1.04 billion in 2025, is experiencing robust growth, projected to expand at a Compound Annual Growth Rate (CAGR) of 8.13% from 2025 to 2033. This expansion is driven by several key factors. Rising consumer demand for natural flavors and ingredients in food and beverages is a significant catalyst, particularly within the expanding health and wellness food segment. The increasing use of vanilla in personal care and cosmetic products, driven by its perceived natural and luxurious properties, further fuels market growth. Moreover, the pharmaceutical industry's utilization of vanilla extract for its purported therapeutic benefits contributes to the market's expansion. The market is segmented by type (bean, paste & extracts, powder) and application (food & beverages, personal care & cosmetics, pharmaceuticals, retail), with the food and beverage sector dominating the market share due to its widespread use in various products ranging from desserts to beverages. Geographic expansion, particularly in emerging economies with growing middle classes and increasing disposable incomes, offers significant untapped potential. However, factors such as price volatility due to fluctuating vanilla bean harvests and the availability of synthetic vanilla substitutes pose challenges to market growth. Competition among established players like Synthite Industries Ltd, B&G Foods Inc, and McCormick & Company Inc., alongside emerging regional players, is shaping the market landscape.
The projected growth trajectory indicates a substantial market expansion over the forecast period. The continued focus on natural and clean-label products in multiple sectors will likely boost demand for high-quality vanilla. Innovation in product forms and delivery systems (e.g., vanilla-infused oils, convenient extracts) could further accelerate market penetration. While challenges remain, the overall outlook for the vanilla market is positive, driven by consistent demand and ongoing product diversification, particularly in areas such as premium and specialty vanilla products catering to discerning consumers. Successful players will need to address price fluctuations through efficient supply chain management and explore strategic partnerships to ensure stable sourcing and supply of quality vanilla beans.
Vanilla Industry Market Report: 2019-2033
This comprehensive report provides an in-depth analysis of the global vanilla industry, projecting a market valuation of $XX Million by 2033. The study period covers 2019-2033, with 2025 as the base and estimated year. The report delves into market composition, trends, leading players, and future opportunities, offering invaluable insights for stakeholders across the value chain. This meticulously researched report leverages extensive data analysis and expert insights to present a clear and actionable roadmap for success in the dynamic vanilla market.
Vanilla Industry Market Composition & Trends
This section offers a detailed examination of the vanilla market's structure, encompassing market concentration, innovative drivers, regulatory landscapes, substitute products, end-user profiles, and mergers & acquisitions (M&A) activities. The report analyzes the market share distribution among key players, revealing a moderately concentrated market with a few dominant players controlling a significant share. The estimated total market value in 2025 is $XX Million.
- Market Concentration: The market exhibits a moderately concentrated structure with the top 5 players holding approximately XX% of the market share in 2025.
- Innovation Catalysts: Growing demand for natural and sustainable vanilla products is driving innovation in extraction methods and bio-based alternatives.
- Regulatory Landscape: Regulations concerning food safety and labeling significantly impact the industry.
- Substitute Products: Artificial vanilla flavorings pose a competitive challenge, although consumer preference for natural products is increasing.
- End-User Profiles: Key end-users span food and beverages, personal care, pharmaceuticals, and retail sectors. Food and beverage remain the largest segment.
- M&A Activities: The report includes an analysis of recent M&A activities in the vanilla market, with an estimated total deal value of $XX Million during the historical period. These activities are primarily driven by expansion strategies and access to new technologies.
Vanilla Industry Industry Evolution
This section explores the evolution of the vanilla industry, tracing its growth trajectories, technological advancements, and shifting consumer preferences from 2019 to 2033. The industry has witnessed a Compound Annual Growth Rate (CAGR) of XX% during the historical period (2019-2024) and is projected to grow at a CAGR of XX% during the forecast period (2025-2033). This growth is fueled by increasing consumer demand for natural flavors and a growing awareness of the health benefits associated with vanilla. Technological advancements in extraction methods and the emergence of bio-vanillin are significant drivers. The growing demand for clean-label products is shaping the industry's future.
Leading Regions, Countries, or Segments in Vanilla Industry
This section identifies the dominant regions, countries, and segments within the vanilla industry. The report uses both quantitative and qualitative data to demonstrate market dominance.
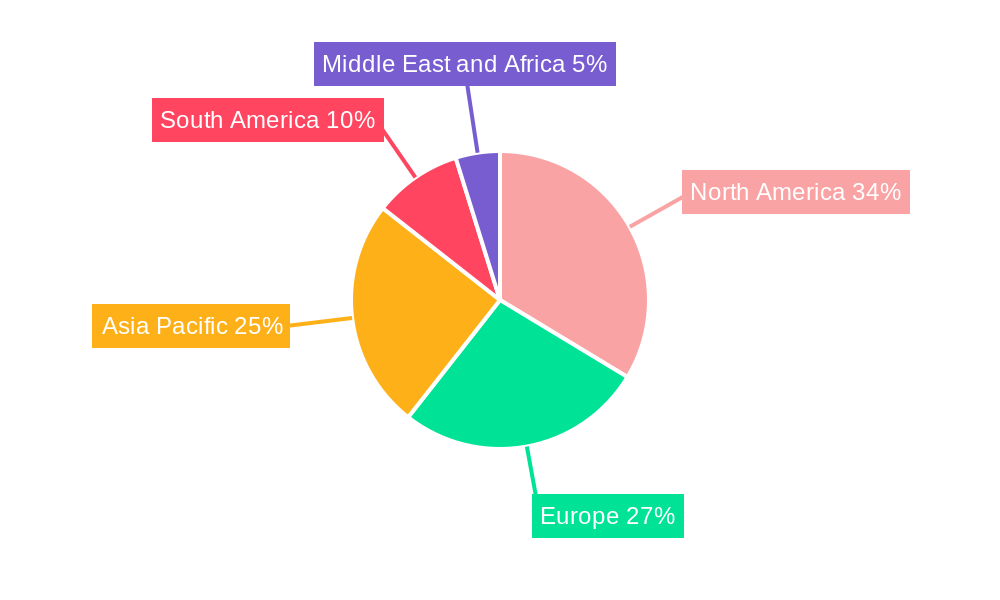
- Dominant Region: [Insert Dominant Region, e.g., North America] is projected to hold the largest market share in 2025, owing to high consumption of vanilla-flavored products and strong consumer spending.
- Dominant Country: [Insert Dominant Country, e.g., United States] dominates the North American market due to [reasons, e.g., robust food and beverage industry and established vanilla processing infrastructure].
- Dominant Segment (Type): [Insert Dominant Type, e.g., Bean and Extracts] is the dominant segment based on volume and value due to superior sensory attributes compared to powder.
- Dominant Segment (Application): The Food and Beverages segment dominates the application market due to the widespread use of vanilla in diverse food and beverage items.
Key Drivers:
- High per capita consumption in developed countries.
- Growing demand for natural and organic products.
- Increased investment in vanilla processing and production infrastructure.
- Favorable regulatory support and industry standards.
Vanilla Industry Product Innovations
Recent innovations include the development of bio-vanillin, offering a sustainable alternative to traditional vanilla extract. This bio-vanillin provides a natural, clean-label ingredient, meeting the rising demand for ethically sourced and sustainable products in food and beverage applications. These innovations are supported by advancements in biotechnology and fermentation processes. Companies are investing in research and development to create vanilla products with enhanced flavor profiles and functional properties.
Propelling Factors for Vanilla Industry Growth
The vanilla industry's growth is driven by several factors, including the increasing demand for natural flavors and clean-label products, spurred by health-conscious consumers and stricter regulations. Technological advancements in extraction techniques and the development of sustainable alternatives further bolster the market. Economic growth in developing economies increases disposable income, driving the consumption of vanilla-flavored products.
Obstacles in the Vanilla Industry Market
The vanilla market faces challenges from fluctuating raw material prices, which impact profitability and create pricing volatility. Supply chain disruptions due to climatic events and geopolitical factors can significantly impact availability and pricing. Intense competition from artificial vanilla flavorings and other natural flavor alternatives also presents challenges.
Future Opportunities in Vanilla Industry
Emerging opportunities lie in expanding into new markets, particularly in developing economies with growing middle classes. The increasing demand for high-quality, sustainably sourced vanilla creates opportunities for producers who prioritize ethical and environmentally responsible practices. Innovation in extraction techniques and the development of new applications for vanilla (e.g., in personal care and cosmetics) also hold significant potential.
Major Players in the Vanilla Industry Ecosystem
- Synthite Industries Ltd (Symega)
- B&G Foods Inc
- Nielsen-Massey Vanillas Inc
- McCormick & Company Inc
- Givaudan SA
- PROVA SAS
- Symrise AG
- Sensient Technologies Corporation
- Firmenich SA
- Adams Flavors Foods & Ingredients LLC
Key Developments in Vanilla Industry Industry
- December 2021: Advanced Biotech launched 'Abtvanforall plus natural,' a bio-vanillin.
- August 2021: Vanilla Bean Kings expanded its facility in the Western Meadows Industrial Park.
- January 2021: Blue Pacific Flavours introduced Kilimanjaro Vanilla, a sustainable vanilla extract.
Strategic Vanilla Industry Market Forecast
The vanilla market is poised for robust growth, driven by the increasing demand for natural flavors and the rising adoption of sustainable practices. New product innovations and expansion into new markets are expected to further propel market expansion. The market is expected to witness strong growth over the forecast period, driven by increasing consumer demand, technological advancements, and new market opportunities.
Vanilla Industry Segmentation
-
1. Type
- 1.1. Bean
- 1.2. Paste and Extracts
- 1.3. Powder
-
2. Application
- 2.1. Food and Beverages
- 2.2. Personal Care and Cosmetics
- 2.3. Pharmaceuticals
- 2.4. Retail
Vanilla Industry Segmentation By Geography
-
1. North America
- 1.1. United States
- 1.2. Canada
- 1.3. Mexico
- 1.4. Rest of North America
-
2. Europe
- 2.1. United Kingdom
- 2.2. Germany
- 2.3. Spain
- 2.4. France
- 2.5. Italy
- 2.6. Russia
- 2.7. Rest of Europe
-
3. Asia Pacific
- 3.1. China
- 3.2. Japan
- 3.3. India
- 3.4. Australia
- 3.5. Rest of Asia Pacific
-
4. South America
- 4.1. Brazil
- 4.2. Argentina
- 4.3. Rest of South America
-
5. Middle East and Africa
- 5.1. SaudI Arabia
- 5.2. South Africa
- 5.3. Rest of Middle East and Africa
Vanilla Industry REPORT HIGHLIGHTS
| Aspects | Details |
|---|---|
| Study Period | 2019-2033 |
| Base Year | 2024 |
| Estimated Year | 2025 |
| Forecast Period | 2025-2033 |
| Historical Period | 2019-2024 |
| Growth Rate | CAGR of 8.13% from 2019-2033 |
| Segmentation |
|
Table of Contents
- 1. Introduction
- 1.1. Research Scope
- 1.2. Market Segmentation
- 1.3. Research Methodology
- 1.4. Definitions and Assumptions
- 2. Executive Summary
- 2.1. Introduction
- 3. Market Dynamics
- 3.1. Introduction
- 3.2. Market Drivers
- 3.2.1. Increasing Focus On Health and Wellness; Surge in Product Innovation
- 3.3. Market Restrains
- 3.3.1. Presence of Substitutes
- 3.4. Market Trends
- 3.4.1. Expanding Demand for Natural/Clean-label Food
- 4. Market Factor Analysis
- 4.1. Porters Five Forces
- 4.2. Supply/Value Chain
- 4.3. PESTEL analysis
- 4.4. Market Entropy
- 4.5. Patent/Trademark Analysis
- 5. Global Vanilla Industry Analysis, Insights and Forecast, 2019-2031
- 5.1. Market Analysis, Insights and Forecast - by Type
- 5.1.1. Bean
- 5.1.2. Paste and Extracts
- 5.1.3. Powder
- 5.2. Market Analysis, Insights and Forecast - by Application
- 5.2.1. Food and Beverages
- 5.2.2. Personal Care and Cosmetics
- 5.2.3. Pharmaceuticals
- 5.2.4. Retail
- 5.3. Market Analysis, Insights and Forecast - by Region
- 5.3.1. North America
- 5.3.2. Europe
- 5.3.3. Asia Pacific
- 5.3.4. South America
- 5.3.5. Middle East and Africa
- 5.1. Market Analysis, Insights and Forecast - by Type
- 6. North America Vanilla Industry Analysis, Insights and Forecast, 2019-2031
- 6.1. Market Analysis, Insights and Forecast - by Type
- 6.1.1. Bean
- 6.1.2. Paste and Extracts
- 6.1.3. Powder
- 6.2. Market Analysis, Insights and Forecast - by Application
- 6.2.1. Food and Beverages
- 6.2.2. Personal Care and Cosmetics
- 6.2.3. Pharmaceuticals
- 6.2.4. Retail
- 6.1. Market Analysis, Insights and Forecast - by Type
- 7. Europe Vanilla Industry Analysis, Insights and Forecast, 2019-2031
- 7.1. Market Analysis, Insights and Forecast - by Type
- 7.1.1. Bean
- 7.1.2. Paste and Extracts
- 7.1.3. Powder
- 7.2. Market Analysis, Insights and Forecast - by Application
- 7.2.1. Food and Beverages
- 7.2.2. Personal Care and Cosmetics
- 7.2.3. Pharmaceuticals
- 7.2.4. Retail
- 7.1. Market Analysis, Insights and Forecast - by Type
- 8. Asia Pacific Vanilla Industry Analysis, Insights and Forecast, 2019-2031
- 8.1. Market Analysis, Insights and Forecast - by Type
- 8.1.1. Bean
- 8.1.2. Paste and Extracts
- 8.1.3. Powder
- 8.2. Market Analysis, Insights and Forecast - by Application
- 8.2.1. Food and Beverages
- 8.2.2. Personal Care and Cosmetics
- 8.2.3. Pharmaceuticals
- 8.2.4. Retail
- 8.1. Market Analysis, Insights and Forecast - by Type
- 9. South America Vanilla Industry Analysis, Insights and Forecast, 2019-2031
- 9.1. Market Analysis, Insights and Forecast - by Type
- 9.1.1. Bean
- 9.1.2. Paste and Extracts
- 9.1.3. Powder
- 9.2. Market Analysis, Insights and Forecast - by Application
- 9.2.1. Food and Beverages
- 9.2.2. Personal Care and Cosmetics
- 9.2.3. Pharmaceuticals
- 9.2.4. Retail
- 9.1. Market Analysis, Insights and Forecast - by Type
- 10. Middle East and Africa Vanilla Industry Analysis, Insights and Forecast, 2019-2031
- 10.1. Market Analysis, Insights and Forecast - by Type
- 10.1.1. Bean
- 10.1.2. Paste and Extracts
- 10.1.3. Powder
- 10.2. Market Analysis, Insights and Forecast - by Application
- 10.2.1. Food and Beverages
- 10.2.2. Personal Care and Cosmetics
- 10.2.3. Pharmaceuticals
- 10.2.4. Retail
- 10.1. Market Analysis, Insights and Forecast - by Type
- 11. North America Vanilla Industry Analysis, Insights and Forecast, 2019-2031
- 11.1. Market Analysis, Insights and Forecast - By Country/Sub-region
- 11.1.1 United States
- 11.1.2 Canada
- 11.1.3 Mexico
- 11.1.4 Rest of North America
- 12. Europe Vanilla Industry Analysis, Insights and Forecast, 2019-2031
- 12.1. Market Analysis, Insights and Forecast - By Country/Sub-region
- 12.1.1 United Kingdom
- 12.1.2 Germany
- 12.1.3 Spain
- 12.1.4 France
- 12.1.5 Italy
- 12.1.6 Russia
- 12.1.7 Rest of Europe
- 13. Asia Pacific Vanilla Industry Analysis, Insights and Forecast, 2019-2031
- 13.1. Market Analysis, Insights and Forecast - By Country/Sub-region
- 13.1.1 China
- 13.1.2 Japan
- 13.1.3 India
- 13.1.4 Australia
- 13.1.5 Rest of Asia Pacific
- 14. South America Vanilla Industry Analysis, Insights and Forecast, 2019-2031
- 14.1. Market Analysis, Insights and Forecast - By Country/Sub-region
- 14.1.1 Brazil
- 14.1.2 Argentina
- 14.1.3 Rest of South America
- 15. Middle East and Africa Vanilla Industry Analysis, Insights and Forecast, 2019-2031
- 15.1. Market Analysis, Insights and Forecast - By Country/Sub-region
- 15.1.1 SaudI Arabia
- 15.1.2 South Africa
- 15.1.3 Rest of Middle East and Africa
- 16. Competitive Analysis
- 16.1. Global Market Share Analysis 2024
- 16.2. Company Profiles
- 16.2.1 Synthite Industries Ltd (Symega)
- 16.2.1.1. Overview
- 16.2.1.2. Products
- 16.2.1.3. SWOT Analysis
- 16.2.1.4. Recent Developments
- 16.2.1.5. Financials (Based on Availability)
- 16.2.2 B&G Foods Inc
- 16.2.2.1. Overview
- 16.2.2.2. Products
- 16.2.2.3. SWOT Analysis
- 16.2.2.4. Recent Developments
- 16.2.2.5. Financials (Based on Availability)
- 16.2.3 Nielsen-Massey Vanillas Inc
- 16.2.3.1. Overview
- 16.2.3.2. Products
- 16.2.3.3. SWOT Analysis
- 16.2.3.4. Recent Developments
- 16.2.3.5. Financials (Based on Availability)
- 16.2.4 McCormick & Company Inc
- 16.2.4.1. Overview
- 16.2.4.2. Products
- 16.2.4.3. SWOT Analysis
- 16.2.4.4. Recent Developments
- 16.2.4.5. Financials (Based on Availability)
- 16.2.5 Givaudan SA
- 16.2.5.1. Overview
- 16.2.5.2. Products
- 16.2.5.3. SWOT Analysis
- 16.2.5.4. Recent Developments
- 16.2.5.5. Financials (Based on Availability)
- 16.2.6 PROVA SAS
- 16.2.6.1. Overview
- 16.2.6.2. Products
- 16.2.6.3. SWOT Analysis
- 16.2.6.4. Recent Developments
- 16.2.6.5. Financials (Based on Availability)
- 16.2.7 Symrise AG
- 16.2.7.1. Overview
- 16.2.7.2. Products
- 16.2.7.3. SWOT Analysis
- 16.2.7.4. Recent Developments
- 16.2.7.5. Financials (Based on Availability)
- 16.2.8 Sensient Technologies Corporation
- 16.2.8.1. Overview
- 16.2.8.2. Products
- 16.2.8.3. SWOT Analysis
- 16.2.8.4. Recent Developments
- 16.2.8.5. Financials (Based on Availability)
- 16.2.9 Firmenich SA*List Not Exhaustive
- 16.2.9.1. Overview
- 16.2.9.2. Products
- 16.2.9.3. SWOT Analysis
- 16.2.9.4. Recent Developments
- 16.2.9.5. Financials (Based on Availability)
- 16.2.10 Adams Flavors Foods & Ingredients LLC
- 16.2.10.1. Overview
- 16.2.10.2. Products
- 16.2.10.3. SWOT Analysis
- 16.2.10.4. Recent Developments
- 16.2.10.5. Financials (Based on Availability)
- 16.2.1 Synthite Industries Ltd (Symega)
List of Figures
- Figure 1: Global Vanilla Industry Revenue Breakdown (Million, %) by Region 2024 & 2032
- Figure 2: North America Vanilla Industry Revenue (Million), by Country 2024 & 2032
- Figure 3: North America Vanilla Industry Revenue Share (%), by Country 2024 & 2032
- Figure 4: Europe Vanilla Industry Revenue (Million), by Country 2024 & 2032
- Figure 5: Europe Vanilla Industry Revenue Share (%), by Country 2024 & 2032
- Figure 6: Asia Pacific Vanilla Industry Revenue (Million), by Country 2024 & 2032
- Figure 7: Asia Pacific Vanilla Industry Revenue Share (%), by Country 2024 & 2032
- Figure 8: South America Vanilla Industry Revenue (Million), by Country 2024 & 2032
- Figure 9: South America Vanilla Industry Revenue Share (%), by Country 2024 & 2032
- Figure 10: Middle East and Africa Vanilla Industry Revenue (Million), by Country 2024 & 2032
- Figure 11: Middle East and Africa Vanilla Industry Revenue Share (%), by Country 2024 & 2032
- Figure 12: North America Vanilla Industry Revenue (Million), by Type 2024 & 2032
- Figure 13: North America Vanilla Industry Revenue Share (%), by Type 2024 & 2032
- Figure 14: North America Vanilla Industry Revenue (Million), by Application 2024 & 2032
- Figure 15: North America Vanilla Industry Revenue Share (%), by Application 2024 & 2032
- Figure 16: North America Vanilla Industry Revenue (Million), by Country 2024 & 2032
- Figure 17: North America Vanilla Industry Revenue Share (%), by Country 2024 & 2032
- Figure 18: Europe Vanilla Industry Revenue (Million), by Type 2024 & 2032
- Figure 19: Europe Vanilla Industry Revenue Share (%), by Type 2024 & 2032
- Figure 20: Europe Vanilla Industry Revenue (Million), by Application 2024 & 2032
- Figure 21: Europe Vanilla Industry Revenue Share (%), by Application 2024 & 2032
- Figure 22: Europe Vanilla Industry Revenue (Million), by Country 2024 & 2032
- Figure 23: Europe Vanilla Industry Revenue Share (%), by Country 2024 & 2032
- Figure 24: Asia Pacific Vanilla Industry Revenue (Million), by Type 2024 & 2032
- Figure 25: Asia Pacific Vanilla Industry Revenue Share (%), by Type 2024 & 2032
- Figure 26: Asia Pacific Vanilla Industry Revenue (Million), by Application 2024 & 2032
- Figure 27: Asia Pacific Vanilla Industry Revenue Share (%), by Application 2024 & 2032
- Figure 28: Asia Pacific Vanilla Industry Revenue (Million), by Country 2024 & 2032
- Figure 29: Asia Pacific Vanilla Industry Revenue Share (%), by Country 2024 & 2032
- Figure 30: South America Vanilla Industry Revenue (Million), by Type 2024 & 2032
- Figure 31: South America Vanilla Industry Revenue Share (%), by Type 2024 & 2032
- Figure 32: South America Vanilla Industry Revenue (Million), by Application 2024 & 2032
- Figure 33: South America Vanilla Industry Revenue Share (%), by Application 2024 & 2032
- Figure 34: South America Vanilla Industry Revenue (Million), by Country 2024 & 2032
- Figure 35: South America Vanilla Industry Revenue Share (%), by Country 2024 & 2032
- Figure 36: Middle East and Africa Vanilla Industry Revenue (Million), by Type 2024 & 2032
- Figure 37: Middle East and Africa Vanilla Industry Revenue Share (%), by Type 2024 & 2032
- Figure 38: Middle East and Africa Vanilla Industry Revenue (Million), by Application 2024 & 2032
- Figure 39: Middle East and Africa Vanilla Industry Revenue Share (%), by Application 2024 & 2032
- Figure 40: Middle East and Africa Vanilla Industry Revenue (Million), by Country 2024 & 2032
- Figure 41: Middle East and Africa Vanilla Industry Revenue Share (%), by Country 2024 & 2032
List of Tables
- Table 1: Global Vanilla Industry Revenue Million Forecast, by Region 2019 & 2032
- Table 2: Global Vanilla Industry Revenue Million Forecast, by Type 2019 & 2032
- Table 3: Global Vanilla Industry Revenue Million Forecast, by Application 2019 & 2032
- Table 4: Global Vanilla Industry Revenue Million Forecast, by Region 2019 & 2032
- Table 5: Global Vanilla Industry Revenue Million Forecast, by Country 2019 & 2032
- Table 6: United States Vanilla Industry Revenue (Million) Forecast, by Application 2019 & 2032
- Table 7: Canada Vanilla Industry Revenue (Million) Forecast, by Application 2019 & 2032
- Table 8: Mexico Vanilla Industry Revenue (Million) Forecast, by Application 2019 & 2032
- Table 9: Rest of North America Vanilla Industry Revenue (Million) Forecast, by Application 2019 & 2032
- Table 10: Global Vanilla Industry Revenue Million Forecast, by Country 2019 & 2032
- Table 11: United Kingdom Vanilla Industry Revenue (Million) Forecast, by Application 2019 & 2032
- Table 12: Germany Vanilla Industry Revenue (Million) Forecast, by Application 2019 & 2032
- Table 13: Spain Vanilla Industry Revenue (Million) Forecast, by Application 2019 & 2032
- Table 14: France Vanilla Industry Revenue (Million) Forecast, by Application 2019 & 2032
- Table 15: Italy Vanilla Industry Revenue (Million) Forecast, by Application 2019 & 2032
- Table 16: Russia Vanilla Industry Revenue (Million) Forecast, by Application 2019 & 2032
- Table 17: Rest of Europe Vanilla Industry Revenue (Million) Forecast, by Application 2019 & 2032
- Table 18: Global Vanilla Industry Revenue Million Forecast, by Country 2019 & 2032
- Table 19: China Vanilla Industry Revenue (Million) Forecast, by Application 2019 & 2032
- Table 20: Japan Vanilla Industry Revenue (Million) Forecast, by Application 2019 & 2032
- Table 21: India Vanilla Industry Revenue (Million) Forecast, by Application 2019 & 2032
- Table 22: Australia Vanilla Industry Revenue (Million) Forecast, by Application 2019 & 2032
- Table 23: Rest of Asia Pacific Vanilla Industry Revenue (Million) Forecast, by Application 2019 & 2032
- Table 24: Global Vanilla Industry Revenue Million Forecast, by Country 2019 & 2032
- Table 25: Brazil Vanilla Industry Revenue (Million) Forecast, by Application 2019 & 2032
- Table 26: Argentina Vanilla Industry Revenue (Million) Forecast, by Application 2019 & 2032
- Table 27: Rest of South America Vanilla Industry Revenue (Million) Forecast, by Application 2019 & 2032
- Table 28: Global Vanilla Industry Revenue Million Forecast, by Country 2019 & 2032
- Table 29: SaudI Arabia Vanilla Industry Revenue (Million) Forecast, by Application 2019 & 2032
- Table 30: South Africa Vanilla Industry Revenue (Million) Forecast, by Application 2019 & 2032
- Table 31: Rest of Middle East and Africa Vanilla Industry Revenue (Million) Forecast, by Application 2019 & 2032
- Table 32: Global Vanilla Industry Revenue Million Forecast, by Type 2019 & 2032
- Table 33: Global Vanilla Industry Revenue Million Forecast, by Application 2019 & 2032
- Table 34: Global Vanilla Industry Revenue Million Forecast, by Country 2019 & 2032
- Table 35: United States Vanilla Industry Revenue (Million) Forecast, by Application 2019 & 2032
- Table 36: Canada Vanilla Industry Revenue (Million) Forecast, by Application 2019 & 2032
- Table 37: Mexico Vanilla Industry Revenue (Million) Forecast, by Application 2019 & 2032
- Table 38: Rest of North America Vanilla Industry Revenue (Million) Forecast, by Application 2019 & 2032
- Table 39: Global Vanilla Industry Revenue Million Forecast, by Type 2019 & 2032
- Table 40: Global Vanilla Industry Revenue Million Forecast, by Application 2019 & 2032
- Table 41: Global Vanilla Industry Revenue Million Forecast, by Country 2019 & 2032
- Table 42: United Kingdom Vanilla Industry Revenue (Million) Forecast, by Application 2019 & 2032
- Table 43: Germany Vanilla Industry Revenue (Million) Forecast, by Application 2019 & 2032
- Table 44: Spain Vanilla Industry Revenue (Million) Forecast, by Application 2019 & 2032
- Table 45: France Vanilla Industry Revenue (Million) Forecast, by Application 2019 & 2032
- Table 46: Italy Vanilla Industry Revenue (Million) Forecast, by Application 2019 & 2032
- Table 47: Russia Vanilla Industry Revenue (Million) Forecast, by Application 2019 & 2032
- Table 48: Rest of Europe Vanilla Industry Revenue (Million) Forecast, by Application 2019 & 2032
- Table 49: Global Vanilla Industry Revenue Million Forecast, by Type 2019 & 2032
- Table 50: Global Vanilla Industry Revenue Million Forecast, by Application 2019 & 2032
- Table 51: Global Vanilla Industry Revenue Million Forecast, by Country 2019 & 2032
- Table 52: China Vanilla Industry Revenue (Million) Forecast, by Application 2019 & 2032
- Table 53: Japan Vanilla Industry Revenue (Million) Forecast, by Application 2019 & 2032
- Table 54: India Vanilla Industry Revenue (Million) Forecast, by Application 2019 & 2032
- Table 55: Australia Vanilla Industry Revenue (Million) Forecast, by Application 2019 & 2032
- Table 56: Rest of Asia Pacific Vanilla Industry Revenue (Million) Forecast, by Application 2019 & 2032
- Table 57: Global Vanilla Industry Revenue Million Forecast, by Type 2019 & 2032
- Table 58: Global Vanilla Industry Revenue Million Forecast, by Application 2019 & 2032
- Table 59: Global Vanilla Industry Revenue Million Forecast, by Country 2019 & 2032
- Table 60: Brazil Vanilla Industry Revenue (Million) Forecast, by Application 2019 & 2032
- Table 61: Argentina Vanilla Industry Revenue (Million) Forecast, by Application 2019 & 2032
- Table 62: Rest of South America Vanilla Industry Revenue (Million) Forecast, by Application 2019 & 2032
- Table 63: Global Vanilla Industry Revenue Million Forecast, by Type 2019 & 2032
- Table 64: Global Vanilla Industry Revenue Million Forecast, by Application 2019 & 2032
- Table 65: Global Vanilla Industry Revenue Million Forecast, by Country 2019 & 2032
- Table 66: SaudI Arabia Vanilla Industry Revenue (Million) Forecast, by Application 2019 & 2032
- Table 67: South Africa Vanilla Industry Revenue (Million) Forecast, by Application 2019 & 2032
- Table 68: Rest of Middle East and Africa Vanilla Industry Revenue (Million) Forecast, by Application 2019 & 2032
Frequently Asked Questions
1. What is the projected Compound Annual Growth Rate (CAGR) of the Vanilla Industry?
The projected CAGR is approximately 8.13%.
2. Which companies are prominent players in the Vanilla Industry?
Key companies in the market include Synthite Industries Ltd (Symega), B&G Foods Inc, Nielsen-Massey Vanillas Inc, McCormick & Company Inc, Givaudan SA, PROVA SAS, Symrise AG, Sensient Technologies Corporation, Firmenich SA*List Not Exhaustive, Adams Flavors Foods & Ingredients LLC.
3. What are the main segments of the Vanilla Industry?
The market segments include Type, Application.
4. Can you provide details about the market size?
The market size is estimated to be USD 1.04 Million as of 2022.
5. What are some drivers contributing to market growth?
Increasing Focus On Health and Wellness; Surge in Product Innovation.
6. What are the notable trends driving market growth?
Expanding Demand for Natural/Clean-label Food.
7. Are there any restraints impacting market growth?
Presence of Substitutes.
8. Can you provide examples of recent developments in the market?
In December 2021, Advanced Biotech launched 'Abtvanforall plus natural,' a bio-vanillin used in alcoholic beverages, baked goods, frozen dairy, and hard candy manufacturing.
9. What pricing options are available for accessing the report?
Pricing options include single-user, multi-user, and enterprise licenses priced at USD 4750, USD 5250, and USD 8750 respectively.
10. Is the market size provided in terms of value or volume?
The market size is provided in terms of value, measured in Million.
11. Are there any specific market keywords associated with the report?
Yes, the market keyword associated with the report is "Vanilla Industry," which aids in identifying and referencing the specific market segment covered.
12. How do I determine which pricing option suits my needs best?
The pricing options vary based on user requirements and access needs. Individual users may opt for single-user licenses, while businesses requiring broader access may choose multi-user or enterprise licenses for cost-effective access to the report.
13. Are there any additional resources or data provided in the Vanilla Industry report?
While the report offers comprehensive insights, it's advisable to review the specific contents or supplementary materials provided to ascertain if additional resources or data are available.
14. How can I stay updated on further developments or reports in the Vanilla Industry?
To stay informed about further developments, trends, and reports in the Vanilla Industry, consider subscribing to industry newsletters, following relevant companies and organizations, or regularly checking reputable industry news sources and publications.
Methodology
Step 1 - Identification of Relevant Samples Size from Population Database


Step 2 - Approaches for Defining Global Market Size (Value, Volume* & Price*)

Note*: In applicable scenarios
Step 3 - Data Sources
Primary Research
- Web Analytics
- Survey Reports
- Research Institute
- Latest Research Reports
- Opinion Leaders
Secondary Research
- Annual Reports
- White Paper
- Latest Press Release
- Industry Association
- Paid Database
- Investor Presentations

Step 4 - Data Triangulation
Involves using different sources of information in order to increase the validity of a study
These sources are likely to be stakeholders in a program - participants, other researchers, program staff, other community members, and so on.
Then we put all data in single framework & apply various statistical tools to find out the dynamic on the market.
During the analysis stage, feedback from the stakeholder groups would be compared to determine areas of agreement as well as areas of divergence
