

Key Insights
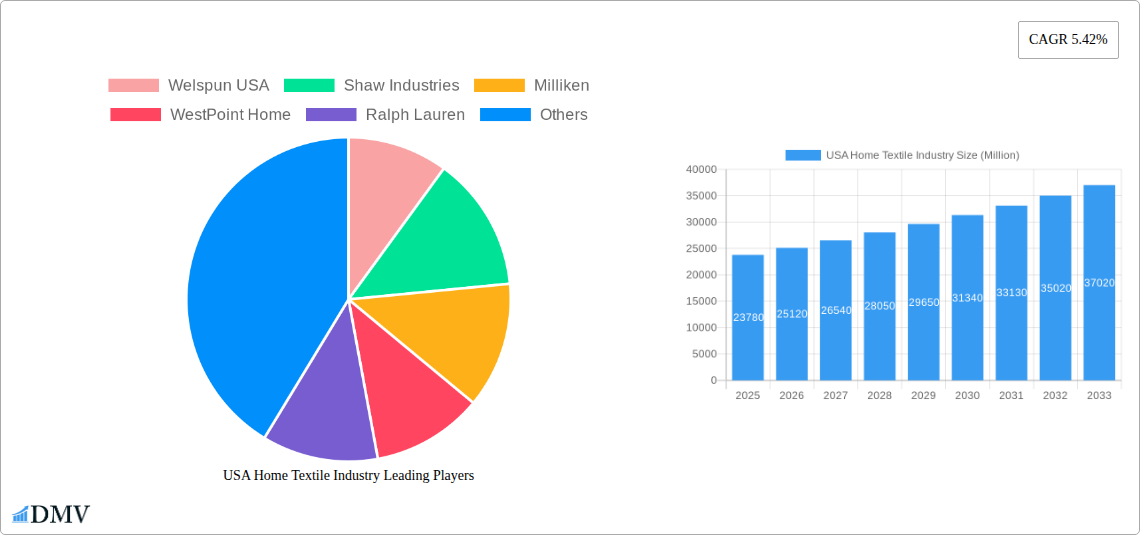
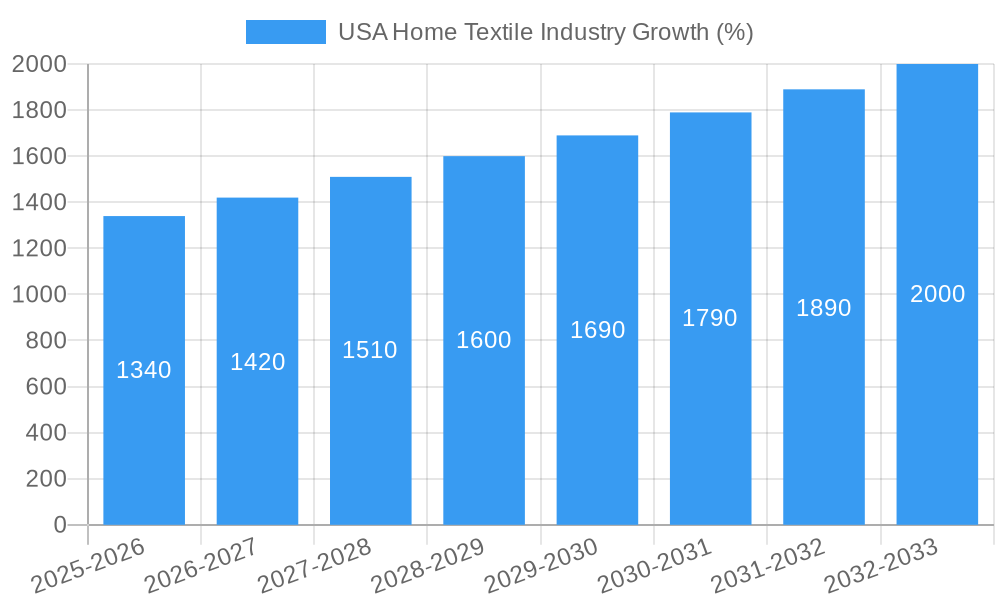
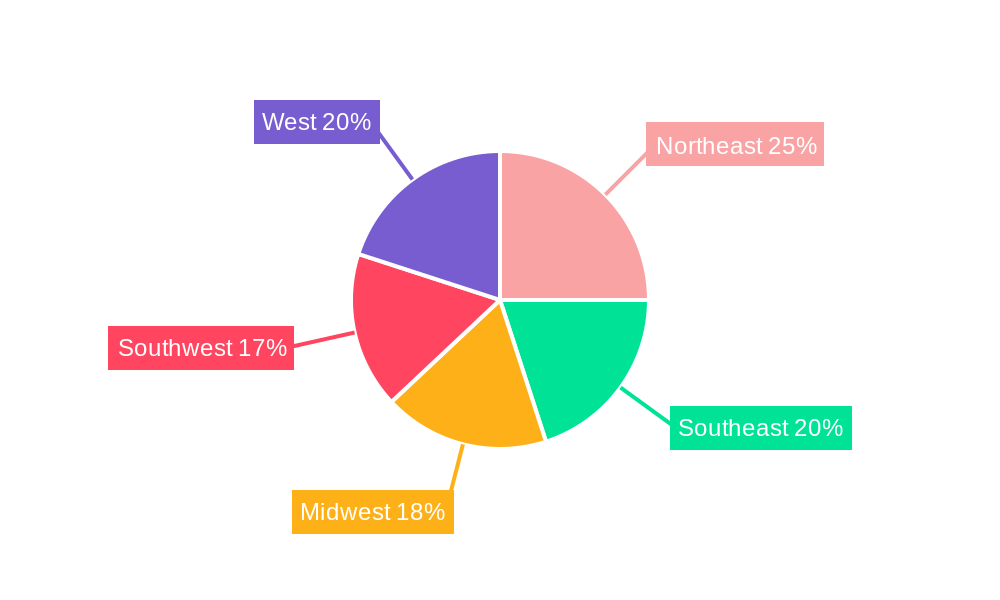
The US home textile market, valued at $23.78 billion in 2025, is projected to experience robust growth, with a Compound Annual Growth Rate (CAGR) of 5.42% from 2025 to 2033. This expansion is driven by several key factors. Rising disposable incomes and a growing preference for home improvement and comfortable living spaces are boosting demand for high-quality home textiles. The increasing popularity of online shopping provides convenient access to a wider variety of products, further fueling market growth. Furthermore, innovative product designs, incorporating sustainable and eco-friendly materials, are attracting environmentally conscious consumers. The market segmentation reveals significant opportunities across material types, with bed linen, bath linen, and kitchen linen consistently leading the demand. Online distribution channels are rapidly gaining traction, although traditional channels like supermarkets and specialty stores maintain a substantial share. Leading brands like Welspun, Shaw Industries, and Milliken leverage their strong brand reputation and diverse product portfolios to compete effectively. Regional variations exist, with densely populated areas like the Northeast and West exhibiting higher consumption. However, the overall market exhibits significant growth potential across all regions, driven by the aforementioned factors.
The market faces certain challenges. Fluctuations in raw material prices and supply chain disruptions can impact profitability. Competition from both established players and emerging brands requires continuous innovation and strategic marketing. Maintaining sustainable practices and addressing environmental concerns are crucial to long-term market success. Despite these challenges, the US home textile market offers promising growth prospects, especially for companies adapting to changing consumer preferences and investing in sustainable and technologically advanced products. Understanding consumer demand for specific materials and distribution channels is key to capitalizing on the significant market expansion anticipated over the next decade. Targeted marketing strategies, focusing on online platforms and regionally specific preferences, are expected to yield the highest returns.
USA Home Textile Industry Market Report: 2019-2033
This comprehensive report provides a detailed analysis of the USA home textile industry, offering invaluable insights for stakeholders seeking to navigate this dynamic market. With a study period spanning 2019-2033, a base year of 2025, and an estimated year of 2025, this report forecasts market trends through 2033, incorporating historical data from 2019-2024. The report covers key segments including bed linen, bath linen, kitchen linen, upholstery, and floor coverings, analyzed across various distribution channels such as supermarkets, specialty stores, and online platforms. The total market size is predicted to reach xx Million by 2033.
USA Home Textile Industry Market Composition & Trends
The USA home textile market exhibits a moderately concentrated structure, with key players like Welspun USA, Shaw Industries, Milliken, WestPoint Home, Ralph Lauren, and Standard Textile holding significant market share. However, the presence of numerous smaller players and private labels fosters competition. Innovation is driven by consumer demand for sustainable, high-performance textiles, and technological advancements in manufacturing processes. Regulatory landscapes, including labeling requirements and safety standards, significantly influence market dynamics. Substitute products, such as synthetic alternatives and imported goods, pose a competitive challenge. End-user preferences are increasingly shaped by factors like sustainability, affordability, and aesthetic appeal. The market has witnessed notable M&A activity, exemplified by recent deals like Mohawk Industries' acquisition of Vitromex (approx. $293 Million).
- Market Share Distribution (2024 Estimate): Welspun USA: xx%, Shaw Industries: xx%, Milliken: xx%, WestPoint Home: xx%, Others: xx%
- M&A Deal Value (2019-2024): Approximately xx Million
- Key Innovation Catalysts: Sustainable materials, smart textiles, technological advancements in manufacturing
- Regulatory Landscape: Focus on sustainability, safety, and labeling regulations
USA Home Textile Industry Industry Evolution
From 2019 to 2024, the USA home textile industry experienced a compound annual growth rate (CAGR) of xx%, driven by factors such as increasing disposable incomes, changing lifestyles, and a growing preference for home improvement. Technological advancements such as automation and precision manufacturing have enhanced efficiency and quality. Consumer demand has shifted towards eco-friendly materials, personalized designs, and durable products. The rise of e-commerce has also reshaped distribution channels, offering both opportunities and challenges for businesses. The post-pandemic period saw a surge in demand for home textiles, as consumers invested more in their home environments. However, supply chain disruptions and inflationary pressures posed significant challenges. Looking ahead, the industry is expected to continue its growth trajectory, albeit at a moderated pace, fueled by innovative product offerings, and expanding e-commerce penetration.
Leading Regions, Countries, or Segments in USA Home Textile Industry
The dominant segments within the USA home textile market are:
- By Material Type: Bed linen consistently holds the largest market share due to its high demand and relatively high price point. Upholstery is also a significant segment, driven by the home furnishing market.
- By Distribution Channel: Online channels are experiencing rapid growth, driven by increased e-commerce adoption. Specialty stores and supermarkets/hypermarkets retain significant shares, catering to diverse customer segments.
Key Drivers:
- Bed Linen: High consumer demand, continuous innovation in materials and designs.
- Online Channels: Convenience, wider product selection, competitive pricing.
- Upholstery: Growth in the home furnishing market, increased demand for customized solutions.
USA Home Textile Industry Product Innovations
Recent innovations include the introduction of sustainable materials such as organic cotton and recycled fibers, antimicrobial treatments for improved hygiene, and smart textiles integrating technology for temperature regulation and other functionalities. These improvements cater to environmentally conscious consumers while enhancing product performance. Unique selling propositions (USPs) focus on eco-friendliness, superior comfort, durability, and technological integration.
Propelling Factors for USA Home Textile Industry Growth
The USA home textile industry is propelled by several factors, including the growing disposable incomes of consumers, which leads to increased spending on home furnishings and renovations. Technological advancements in manufacturing and design have also contributed to the growth. Government policies promoting domestic manufacturing and sustainability are further driving the sector's expansion.
Obstacles in the USA Home Textile Industry Market
The industry faces challenges such as rising raw material costs, fluctuations in currency exchange rates, and global supply chain disruptions, all of which increase production costs and impact profitability. Increased competition from imported textiles also puts pressure on domestic manufacturers. Furthermore, evolving consumer preferences and the need to adapt to sustainable practices present additional hurdles.
Future Opportunities in USA Home Textile Industry
The industry is poised for growth in several areas, including the increasing demand for sustainable and eco-friendly textiles. Technological advancements, such as smart home integration and personalized customization options, are also creating opportunities for innovation. Furthermore, expansion into emerging markets and the development of new product categories will contribute to market growth.
Major Players in the USA Home Textile Industry Ecosystem
- Welspun USA
- Shaw Industries
- Milliken & Company
- WestPoint Home
- Ralph Lauren
- Standard Textile
- TJX Companies
- Etro Home Collection
- Mohawk Industries
- Jim Thompson Fabrics
Key Developments in USA Home Textile Industry Industry
- December 2022: Milliken & Company announces a $27.4 Million investment to expand operations in Cherokee County, creating 75 new jobs. This signifies a commitment to domestic manufacturing and expansion within the USA.
- June 2022: Mohawk Industries acquires Vitromex ceramic tile business for approximately $293 Million, expanding its product portfolio and market reach.
Strategic USA Home Textile Industry Market Forecast
The USA home textile industry is projected to experience continued growth, driven by increasing consumer spending on home improvement, a rising preference for sustainable products, and continuous technological advancements. Opportunities exist in personalized products, smart textiles, and expanding into niche markets. The market's future is bright, promising significant growth and potential for innovation.
USA Home Textile Industry Segmentation
-
1. Material Type
- 1.1. Bed Linen
- 1.2. Bath Linen
- 1.3. Kitchen Linen
- 1.4. Upholstery
- 1.5. Floor Covering
-
2. Distribution Channel
- 2.1. Supermarkets and Hypermarkets
- 2.2. Specialty Stores
- 2.3. Online
- 2.4. Others
USA Home Textile Industry Segmentation By Geography
-
1. North America
- 1.1. United States
- 1.2. Canada
- 1.3. Mexico
-
2. South America
- 2.1. Brazil
- 2.2. Argentina
- 2.3. Rest of South America
-
3. Europe
- 3.1. United Kingdom
- 3.2. Germany
- 3.3. France
- 3.4. Italy
- 3.5. Spain
- 3.6. Russia
- 3.7. Benelux
- 3.8. Nordics
- 3.9. Rest of Europe
-
4. Middle East & Africa
- 4.1. Turkey
- 4.2. Israel
- 4.3. GCC
- 4.4. North Africa
- 4.5. South Africa
- 4.6. Rest of Middle East & Africa
-
5. Asia Pacific
- 5.1. China
- 5.2. India
- 5.3. Japan
- 5.4. South Korea
- 5.5. ASEAN
- 5.6. Oceania
- 5.7. Rest of Asia Pacific
USA Home Textile Industry REPORT HIGHLIGHTS
| Aspects | Details |
|---|---|
| Study Period | 2019-2033 |
| Base Year | 2024 |
| Estimated Year | 2025 |
| Forecast Period | 2025-2033 |
| Historical Period | 2019-2024 |
| Growth Rate | CAGR of 5.42% from 2019-2033 |
| Segmentation |
|
Table of Contents
- 1. Introduction
- 1.1. Research Scope
- 1.2. Market Segmentation
- 1.3. Research Methodology
- 1.4. Definitions and Assumptions
- 2. Executive Summary
- 2.1. Introduction
- 3. Market Dynamics
- 3.1. Introduction
- 3.2. Market Drivers
- 3.2.1. High Resistance to Scratches and Stains Drives the Market; High Durability Drives the Market
- 3.3. Market Restrains
- 3.3.1. Excess Water Damages the Floor Covering; Exposure to Sun Cause Damages to the Floor Covering; Market Oppurtunities4.; Technological Advancements in Floor Covering Market4.; Increasing Demand for Hardwood Floors
- 3.4. Market Trends
- 3.4.1. Increasing Sector of Real Estate is Driving the Market
- 4. Market Factor Analysis
- 4.1. Porters Five Forces
- 4.2. Supply/Value Chain
- 4.3. PESTEL analysis
- 4.4. Market Entropy
- 4.5. Patent/Trademark Analysis
- 5. Global USA Home Textile Industry Analysis, Insights and Forecast, 2019-2031
- 5.1. Market Analysis, Insights and Forecast - by Material Type
- 5.1.1. Bed Linen
- 5.1.2. Bath Linen
- 5.1.3. Kitchen Linen
- 5.1.4. Upholstery
- 5.1.5. Floor Covering
- 5.2. Market Analysis, Insights and Forecast - by Distribution Channel
- 5.2.1. Supermarkets and Hypermarkets
- 5.2.2. Specialty Stores
- 5.2.3. Online
- 5.2.4. Others
- 5.3. Market Analysis, Insights and Forecast - by Region
- 5.3.1. North America
- 5.3.2. South America
- 5.3.3. Europe
- 5.3.4. Middle East & Africa
- 5.3.5. Asia Pacific
- 5.1. Market Analysis, Insights and Forecast - by Material Type
- 6. North America USA Home Textile Industry Analysis, Insights and Forecast, 2019-2031
- 6.1. Market Analysis, Insights and Forecast - by Material Type
- 6.1.1. Bed Linen
- 6.1.2. Bath Linen
- 6.1.3. Kitchen Linen
- 6.1.4. Upholstery
- 6.1.5. Floor Covering
- 6.2. Market Analysis, Insights and Forecast - by Distribution Channel
- 6.2.1. Supermarkets and Hypermarkets
- 6.2.2. Specialty Stores
- 6.2.3. Online
- 6.2.4. Others
- 6.1. Market Analysis, Insights and Forecast - by Material Type
- 7. South America USA Home Textile Industry Analysis, Insights and Forecast, 2019-2031
- 7.1. Market Analysis, Insights and Forecast - by Material Type
- 7.1.1. Bed Linen
- 7.1.2. Bath Linen
- 7.1.3. Kitchen Linen
- 7.1.4. Upholstery
- 7.1.5. Floor Covering
- 7.2. Market Analysis, Insights and Forecast - by Distribution Channel
- 7.2.1. Supermarkets and Hypermarkets
- 7.2.2. Specialty Stores
- 7.2.3. Online
- 7.2.4. Others
- 7.1. Market Analysis, Insights and Forecast - by Material Type
- 8. Europe USA Home Textile Industry Analysis, Insights and Forecast, 2019-2031
- 8.1. Market Analysis, Insights and Forecast - by Material Type
- 8.1.1. Bed Linen
- 8.1.2. Bath Linen
- 8.1.3. Kitchen Linen
- 8.1.4. Upholstery
- 8.1.5. Floor Covering
- 8.2. Market Analysis, Insights and Forecast - by Distribution Channel
- 8.2.1. Supermarkets and Hypermarkets
- 8.2.2. Specialty Stores
- 8.2.3. Online
- 8.2.4. Others
- 8.1. Market Analysis, Insights and Forecast - by Material Type
- 9. Middle East & Africa USA Home Textile Industry Analysis, Insights and Forecast, 2019-2031
- 9.1. Market Analysis, Insights and Forecast - by Material Type
- 9.1.1. Bed Linen
- 9.1.2. Bath Linen
- 9.1.3. Kitchen Linen
- 9.1.4. Upholstery
- 9.1.5. Floor Covering
- 9.2. Market Analysis, Insights and Forecast - by Distribution Channel
- 9.2.1. Supermarkets and Hypermarkets
- 9.2.2. Specialty Stores
- 9.2.3. Online
- 9.2.4. Others
- 9.1. Market Analysis, Insights and Forecast - by Material Type
- 10. Asia Pacific USA Home Textile Industry Analysis, Insights and Forecast, 2019-2031
- 10.1. Market Analysis, Insights and Forecast - by Material Type
- 10.1.1. Bed Linen
- 10.1.2. Bath Linen
- 10.1.3. Kitchen Linen
- 10.1.4. Upholstery
- 10.1.5. Floor Covering
- 10.2. Market Analysis, Insights and Forecast - by Distribution Channel
- 10.2.1. Supermarkets and Hypermarkets
- 10.2.2. Specialty Stores
- 10.2.3. Online
- 10.2.4. Others
- 10.1. Market Analysis, Insights and Forecast - by Material Type
- 11. Northeast USA Home Textile Industry Analysis, Insights and Forecast, 2019-2031
- 12. Southeast USA Home Textile Industry Analysis, Insights and Forecast, 2019-2031
- 13. Midwest USA Home Textile Industry Analysis, Insights and Forecast, 2019-2031
- 14. Southwest USA Home Textile Industry Analysis, Insights and Forecast, 2019-2031
- 15. West USA Home Textile Industry Analysis, Insights and Forecast, 2019-2031
- 16. Competitive Analysis
- 16.1. Global Market Share Analysis 2024
- 16.2. Company Profiles
- 16.2.1 Welspun USA
- 16.2.1.1. Overview
- 16.2.1.2. Products
- 16.2.1.3. SWOT Analysis
- 16.2.1.4. Recent Developments
- 16.2.1.5. Financials (Based on Availability)
- 16.2.2 Shaw Industries
- 16.2.2.1. Overview
- 16.2.2.2. Products
- 16.2.2.3. SWOT Analysis
- 16.2.2.4. Recent Developments
- 16.2.2.5. Financials (Based on Availability)
- 16.2.3 Milliken
- 16.2.3.1. Overview
- 16.2.3.2. Products
- 16.2.3.3. SWOT Analysis
- 16.2.3.4. Recent Developments
- 16.2.3.5. Financials (Based on Availability)
- 16.2.4 WestPoint Home
- 16.2.4.1. Overview
- 16.2.4.2. Products
- 16.2.4.3. SWOT Analysis
- 16.2.4.4. Recent Developments
- 16.2.4.5. Financials (Based on Availability)
- 16.2.5 Ralph Lauren
- 16.2.5.1. Overview
- 16.2.5.2. Products
- 16.2.5.3. SWOT Analysis
- 16.2.5.4. Recent Developments
- 16.2.5.5. Financials (Based on Availability)
- 16.2.6 Standard Textile**List Not Exhaustive
- 16.2.6.1. Overview
- 16.2.6.2. Products
- 16.2.6.3. SWOT Analysis
- 16.2.6.4. Recent Developments
- 16.2.6.5. Financials (Based on Availability)
- 16.2.7 TJX Companies
- 16.2.7.1. Overview
- 16.2.7.2. Products
- 16.2.7.3. SWOT Analysis
- 16.2.7.4. Recent Developments
- 16.2.7.5. Financials (Based on Availability)
- 16.2.8 Etro Home Collection
- 16.2.8.1. Overview
- 16.2.8.2. Products
- 16.2.8.3. SWOT Analysis
- 16.2.8.4. Recent Developments
- 16.2.8.5. Financials (Based on Availability)
- 16.2.9 Mohawk Industries
- 16.2.9.1. Overview
- 16.2.9.2. Products
- 16.2.9.3. SWOT Analysis
- 16.2.9.4. Recent Developments
- 16.2.9.5. Financials (Based on Availability)
- 16.2.10 Jim Thompson Fabrics
- 16.2.10.1. Overview
- 16.2.10.2. Products
- 16.2.10.3. SWOT Analysis
- 16.2.10.4. Recent Developments
- 16.2.10.5. Financials (Based on Availability)
- 16.2.1 Welspun USA
List of Figures
- Figure 1: Global USA Home Textile Industry Revenue Breakdown (Million, %) by Region 2024 & 2032
- Figure 2: United states USA Home Textile Industry Revenue (Million), by Country 2024 & 2032
- Figure 3: United states USA Home Textile Industry Revenue Share (%), by Country 2024 & 2032
- Figure 4: North America USA Home Textile Industry Revenue (Million), by Material Type 2024 & 2032
- Figure 5: North America USA Home Textile Industry Revenue Share (%), by Material Type 2024 & 2032
- Figure 6: North America USA Home Textile Industry Revenue (Million), by Distribution Channel 2024 & 2032
- Figure 7: North America USA Home Textile Industry Revenue Share (%), by Distribution Channel 2024 & 2032
- Figure 8: North America USA Home Textile Industry Revenue (Million), by Country 2024 & 2032
- Figure 9: North America USA Home Textile Industry Revenue Share (%), by Country 2024 & 2032
- Figure 10: South America USA Home Textile Industry Revenue (Million), by Material Type 2024 & 2032
- Figure 11: South America USA Home Textile Industry Revenue Share (%), by Material Type 2024 & 2032
- Figure 12: South America USA Home Textile Industry Revenue (Million), by Distribution Channel 2024 & 2032
- Figure 13: South America USA Home Textile Industry Revenue Share (%), by Distribution Channel 2024 & 2032
- Figure 14: South America USA Home Textile Industry Revenue (Million), by Country 2024 & 2032
- Figure 15: South America USA Home Textile Industry Revenue Share (%), by Country 2024 & 2032
- Figure 16: Europe USA Home Textile Industry Revenue (Million), by Material Type 2024 & 2032
- Figure 17: Europe USA Home Textile Industry Revenue Share (%), by Material Type 2024 & 2032
- Figure 18: Europe USA Home Textile Industry Revenue (Million), by Distribution Channel 2024 & 2032
- Figure 19: Europe USA Home Textile Industry Revenue Share (%), by Distribution Channel 2024 & 2032
- Figure 20: Europe USA Home Textile Industry Revenue (Million), by Country 2024 & 2032
- Figure 21: Europe USA Home Textile Industry Revenue Share (%), by Country 2024 & 2032
- Figure 22: Middle East & Africa USA Home Textile Industry Revenue (Million), by Material Type 2024 & 2032
- Figure 23: Middle East & Africa USA Home Textile Industry Revenue Share (%), by Material Type 2024 & 2032
- Figure 24: Middle East & Africa USA Home Textile Industry Revenue (Million), by Distribution Channel 2024 & 2032
- Figure 25: Middle East & Africa USA Home Textile Industry Revenue Share (%), by Distribution Channel 2024 & 2032
- Figure 26: Middle East & Africa USA Home Textile Industry Revenue (Million), by Country 2024 & 2032
- Figure 27: Middle East & Africa USA Home Textile Industry Revenue Share (%), by Country 2024 & 2032
- Figure 28: Asia Pacific USA Home Textile Industry Revenue (Million), by Material Type 2024 & 2032
- Figure 29: Asia Pacific USA Home Textile Industry Revenue Share (%), by Material Type 2024 & 2032
- Figure 30: Asia Pacific USA Home Textile Industry Revenue (Million), by Distribution Channel 2024 & 2032
- Figure 31: Asia Pacific USA Home Textile Industry Revenue Share (%), by Distribution Channel 2024 & 2032
- Figure 32: Asia Pacific USA Home Textile Industry Revenue (Million), by Country 2024 & 2032
- Figure 33: Asia Pacific USA Home Textile Industry Revenue Share (%), by Country 2024 & 2032
List of Tables
- Table 1: Global USA Home Textile Industry Revenue Million Forecast, by Region 2019 & 2032
- Table 2: Global USA Home Textile Industry Revenue Million Forecast, by Material Type 2019 & 2032
- Table 3: Global USA Home Textile Industry Revenue Million Forecast, by Distribution Channel 2019 & 2032
- Table 4: Global USA Home Textile Industry Revenue Million Forecast, by Region 2019 & 2032
- Table 5: Global USA Home Textile Industry Revenue Million Forecast, by Country 2019 & 2032
- Table 6: Northeast USA Home Textile Industry Revenue (Million) Forecast, by Application 2019 & 2032
- Table 7: Southeast USA Home Textile Industry Revenue (Million) Forecast, by Application 2019 & 2032
- Table 8: Midwest USA Home Textile Industry Revenue (Million) Forecast, by Application 2019 & 2032
- Table 9: Southwest USA Home Textile Industry Revenue (Million) Forecast, by Application 2019 & 2032
- Table 10: West USA Home Textile Industry Revenue (Million) Forecast, by Application 2019 & 2032
- Table 11: Global USA Home Textile Industry Revenue Million Forecast, by Material Type 2019 & 2032
- Table 12: Global USA Home Textile Industry Revenue Million Forecast, by Distribution Channel 2019 & 2032
- Table 13: Global USA Home Textile Industry Revenue Million Forecast, by Country 2019 & 2032
- Table 14: United States USA Home Textile Industry Revenue (Million) Forecast, by Application 2019 & 2032
- Table 15: Canada USA Home Textile Industry Revenue (Million) Forecast, by Application 2019 & 2032
- Table 16: Mexico USA Home Textile Industry Revenue (Million) Forecast, by Application 2019 & 2032
- Table 17: Global USA Home Textile Industry Revenue Million Forecast, by Material Type 2019 & 2032
- Table 18: Global USA Home Textile Industry Revenue Million Forecast, by Distribution Channel 2019 & 2032
- Table 19: Global USA Home Textile Industry Revenue Million Forecast, by Country 2019 & 2032
- Table 20: Brazil USA Home Textile Industry Revenue (Million) Forecast, by Application 2019 & 2032
- Table 21: Argentina USA Home Textile Industry Revenue (Million) Forecast, by Application 2019 & 2032
- Table 22: Rest of South America USA Home Textile Industry Revenue (Million) Forecast, by Application 2019 & 2032
- Table 23: Global USA Home Textile Industry Revenue Million Forecast, by Material Type 2019 & 2032
- Table 24: Global USA Home Textile Industry Revenue Million Forecast, by Distribution Channel 2019 & 2032
- Table 25: Global USA Home Textile Industry Revenue Million Forecast, by Country 2019 & 2032
- Table 26: United Kingdom USA Home Textile Industry Revenue (Million) Forecast, by Application 2019 & 2032
- Table 27: Germany USA Home Textile Industry Revenue (Million) Forecast, by Application 2019 & 2032
- Table 28: France USA Home Textile Industry Revenue (Million) Forecast, by Application 2019 & 2032
- Table 29: Italy USA Home Textile Industry Revenue (Million) Forecast, by Application 2019 & 2032
- Table 30: Spain USA Home Textile Industry Revenue (Million) Forecast, by Application 2019 & 2032
- Table 31: Russia USA Home Textile Industry Revenue (Million) Forecast, by Application 2019 & 2032
- Table 32: Benelux USA Home Textile Industry Revenue (Million) Forecast, by Application 2019 & 2032
- Table 33: Nordics USA Home Textile Industry Revenue (Million) Forecast, by Application 2019 & 2032
- Table 34: Rest of Europe USA Home Textile Industry Revenue (Million) Forecast, by Application 2019 & 2032
- Table 35: Global USA Home Textile Industry Revenue Million Forecast, by Material Type 2019 & 2032
- Table 36: Global USA Home Textile Industry Revenue Million Forecast, by Distribution Channel 2019 & 2032
- Table 37: Global USA Home Textile Industry Revenue Million Forecast, by Country 2019 & 2032
- Table 38: Turkey USA Home Textile Industry Revenue (Million) Forecast, by Application 2019 & 2032
- Table 39: Israel USA Home Textile Industry Revenue (Million) Forecast, by Application 2019 & 2032
- Table 40: GCC USA Home Textile Industry Revenue (Million) Forecast, by Application 2019 & 2032
- Table 41: North Africa USA Home Textile Industry Revenue (Million) Forecast, by Application 2019 & 2032
- Table 42: South Africa USA Home Textile Industry Revenue (Million) Forecast, by Application 2019 & 2032
- Table 43: Rest of Middle East & Africa USA Home Textile Industry Revenue (Million) Forecast, by Application 2019 & 2032
- Table 44: Global USA Home Textile Industry Revenue Million Forecast, by Material Type 2019 & 2032
- Table 45: Global USA Home Textile Industry Revenue Million Forecast, by Distribution Channel 2019 & 2032
- Table 46: Global USA Home Textile Industry Revenue Million Forecast, by Country 2019 & 2032
- Table 47: China USA Home Textile Industry Revenue (Million) Forecast, by Application 2019 & 2032
- Table 48: India USA Home Textile Industry Revenue (Million) Forecast, by Application 2019 & 2032
- Table 49: Japan USA Home Textile Industry Revenue (Million) Forecast, by Application 2019 & 2032
- Table 50: South Korea USA Home Textile Industry Revenue (Million) Forecast, by Application 2019 & 2032
- Table 51: ASEAN USA Home Textile Industry Revenue (Million) Forecast, by Application 2019 & 2032
- Table 52: Oceania USA Home Textile Industry Revenue (Million) Forecast, by Application 2019 & 2032
- Table 53: Rest of Asia Pacific USA Home Textile Industry Revenue (Million) Forecast, by Application 2019 & 2032
Frequently Asked Questions
1. What is the projected Compound Annual Growth Rate (CAGR) of the USA Home Textile Industry?
The projected CAGR is approximately 5.42%.
2. Which companies are prominent players in the USA Home Textile Industry?
Key companies in the market include Welspun USA, Shaw Industries, Milliken, WestPoint Home, Ralph Lauren, Standard Textile**List Not Exhaustive, TJX Companies, Etro Home Collection, Mohawk Industries, Jim Thompson Fabrics.
3. What are the main segments of the USA Home Textile Industry?
The market segments include Material Type, Distribution Channel.
4. Can you provide details about the market size?
The market size is estimated to be USD 23.78 Million as of 2022.
5. What are some drivers contributing to market growth?
High Resistance to Scratches and Stains Drives the Market; High Durability Drives the Market.
6. What are the notable trends driving market growth?
Increasing Sector of Real Estate is Driving the Market.
7. Are there any restraints impacting market growth?
Excess Water Damages the Floor Covering; Exposure to Sun Cause Damages to the Floor Covering; Market Oppurtunities4.; Technological Advancements in Floor Covering Market4.; Increasing Demand for Hardwood Floors.
8. Can you provide examples of recent developments in the market?
December 2022: Milliken & Company, a diversified global textile manufacturer with more than 70 locations worldwide, plans to expand operations in Cherokee County. The company's $27.4 million investment will create 75 new jobs.
9. What pricing options are available for accessing the report?
Pricing options include single-user, multi-user, and enterprise licenses priced at USD 3800, USD 4500, and USD 5800 respectively.
10. Is the market size provided in terms of value or volume?
The market size is provided in terms of value, measured in Million.
11. Are there any specific market keywords associated with the report?
Yes, the market keyword associated with the report is "USA Home Textile Industry," which aids in identifying and referencing the specific market segment covered.
12. How do I determine which pricing option suits my needs best?
The pricing options vary based on user requirements and access needs. Individual users may opt for single-user licenses, while businesses requiring broader access may choose multi-user or enterprise licenses for cost-effective access to the report.
13. Are there any additional resources or data provided in the USA Home Textile Industry report?
While the report offers comprehensive insights, it's advisable to review the specific contents or supplementary materials provided to ascertain if additional resources or data are available.
14. How can I stay updated on further developments or reports in the USA Home Textile Industry?
To stay informed about further developments, trends, and reports in the USA Home Textile Industry, consider subscribing to industry newsletters, following relevant companies and organizations, or regularly checking reputable industry news sources and publications.
Methodology
Step 1 - Identification of Relevant Samples Size from Population Database


Step 2 - Approaches for Defining Global Market Size (Value, Volume* & Price*)

Note*: In applicable scenarios
Step 3 - Data Sources
Primary Research
- Web Analytics
- Survey Reports
- Research Institute
- Latest Research Reports
- Opinion Leaders
Secondary Research
- Annual Reports
- White Paper
- Latest Press Release
- Industry Association
- Paid Database
- Investor Presentations

Step 4 - Data Triangulation
Involves using different sources of information in order to increase the validity of a study
These sources are likely to be stakeholders in a program - participants, other researchers, program staff, other community members, and so on.
Then we put all data in single framework & apply various statistical tools to find out the dynamic on the market.
During the analysis stage, feedback from the stakeholder groups would be compared to determine areas of agreement as well as areas of divergence
