

Key Insights
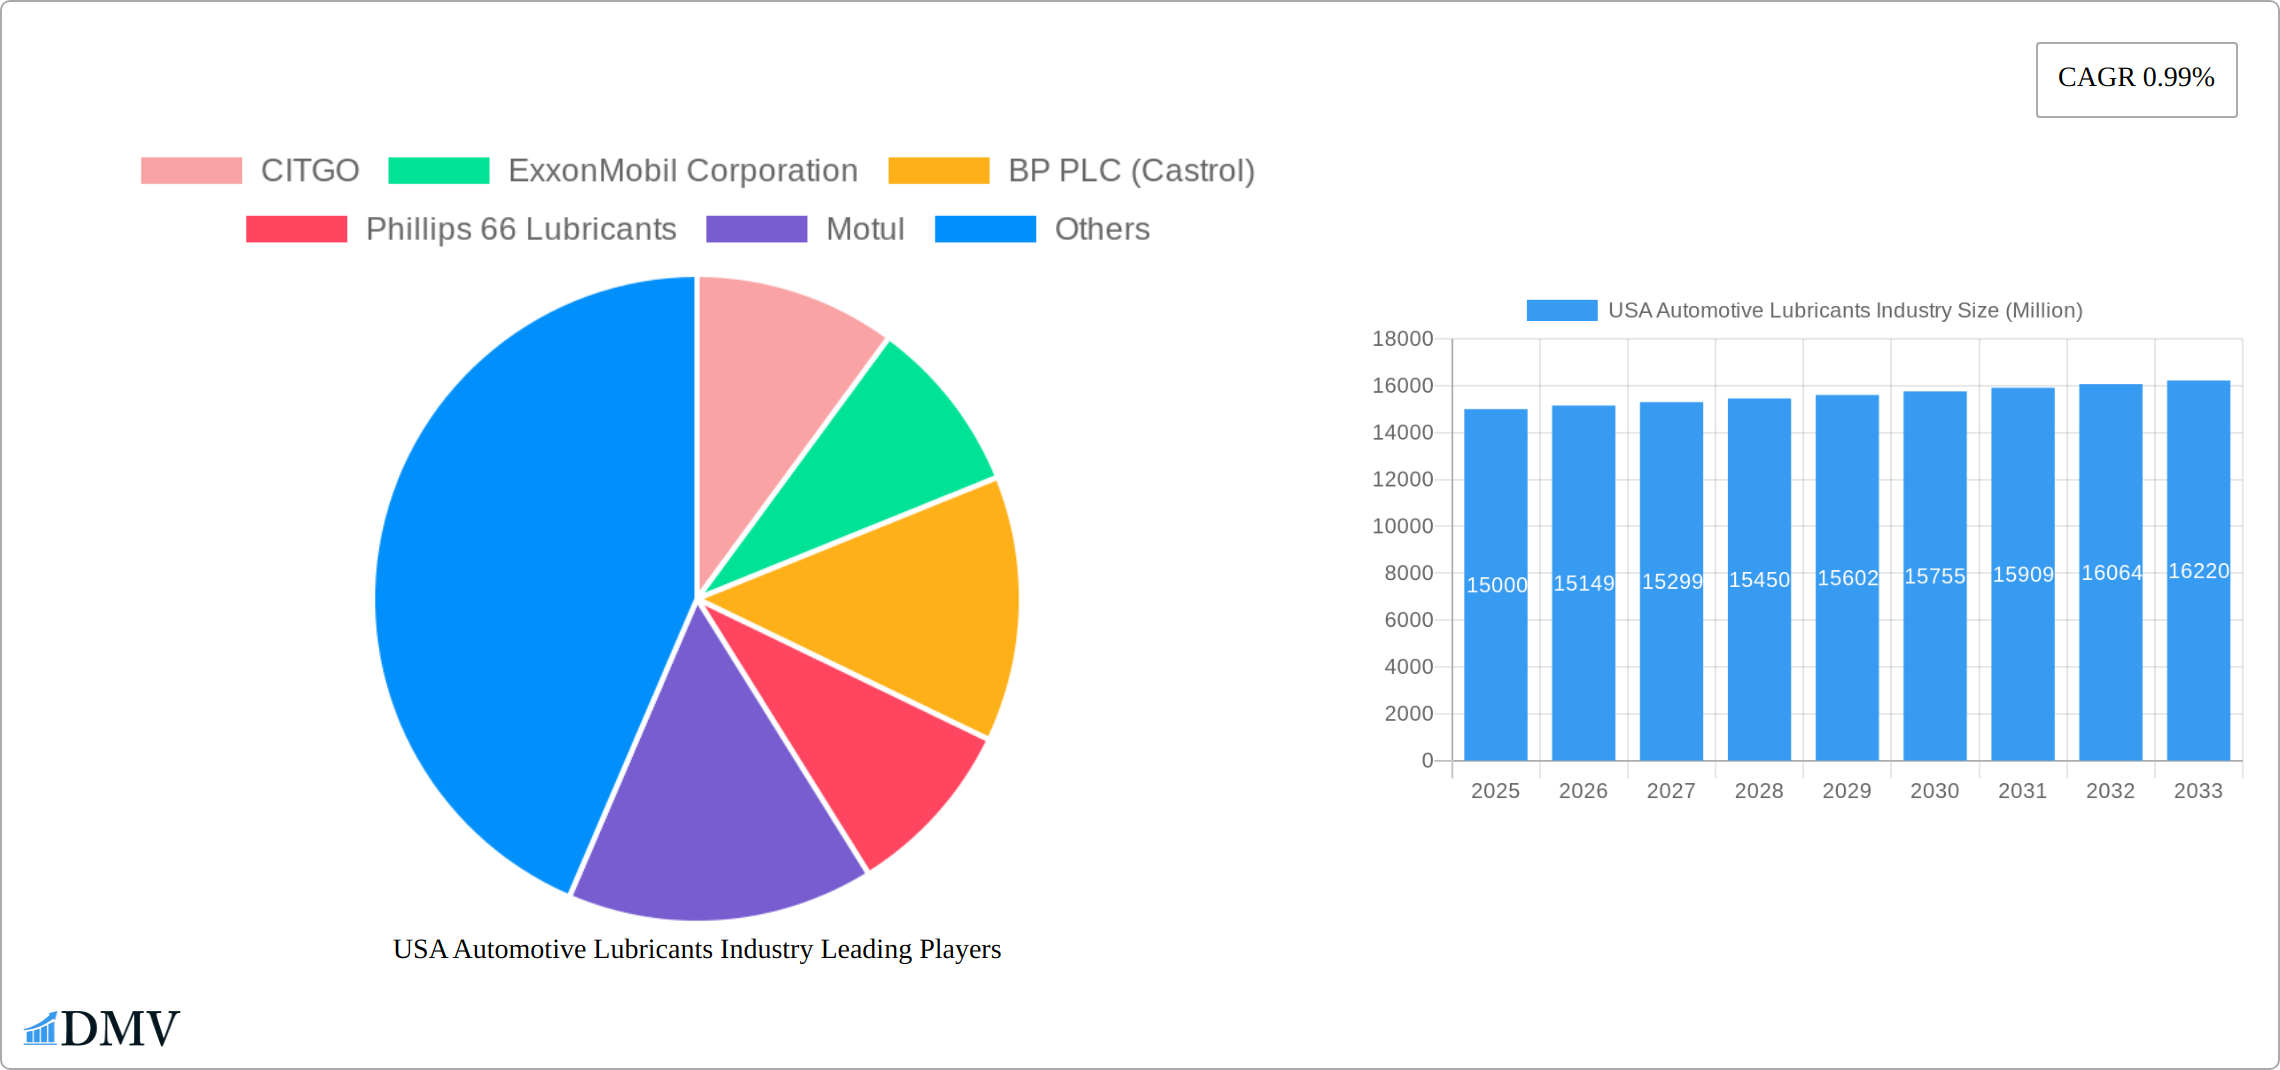
The US automotive lubricants market, valued at approximately $15 billion in 2025, is projected to experience steady growth, driven primarily by the increasing number of vehicles on the road and a rising demand for high-performance lubricants. The market's Compound Annual Growth Rate (CAGR) of 0.99% indicates a relatively stable, albeit modest, expansion over the forecast period (2025-2033). Key growth drivers include the increasing adoption of advanced vehicle technologies (requiring specialized lubricants), a rising focus on fuel efficiency and reduced emissions (leading to demand for eco-friendly lubricants), and the expanding commercial vehicle sector. The market is segmented by vehicle type (passenger vehicles, commercial vehicles, motorcycles) and product type (engine oils, greases, hydraulic fluids, transmission & gear oils). Passenger vehicles constitute the largest segment, followed by commercial vehicles. Engine oils dominate the product segment, accounting for a significant share of the overall market. However, the increasing use of advanced transmissions and hydraulic systems in modern vehicles is fueling growth in the transmission & gear oils and hydraulic fluids segments. Regional variations exist, with the West and Southeast potentially exhibiting faster growth due to higher vehicle density and economic activity. Competitive pressures from established players like ExxonMobil, Shell, and Castrol, alongside newer entrants focusing on specialized and sustainable products, characterize the market landscape.
The market faces certain restraints, including fluctuating crude oil prices, which directly impact lubricant production costs. Stringent environmental regulations regarding lubricant composition and disposal also present challenges. However, ongoing innovation in lubricant technology, focusing on enhanced performance, longer drain intervals, and reduced environmental impact, is expected to mitigate these challenges and support market growth. The long-term outlook for the US automotive lubricants market remains positive, with projected continued growth driven by technological advancements and the ever-increasing demand for reliable and efficient vehicle operation. The market is ripe for innovation and strategic partnerships, with opportunities arising in areas such as the development of biodegradable lubricants and the implementation of advanced lubricant management systems.
USA Automotive Lubricants Industry: A Comprehensive Market Report (2019-2033)
This insightful report provides a detailed analysis of the USA Automotive Lubricants Industry, encompassing market size, growth trajectory, competitive landscape, and future outlook. Spanning the period from 2019 to 2033, with a base year of 2025, this study offers crucial data for stakeholders seeking to navigate this dynamic sector. The report projects a market value of xx Million by 2033, driven by factors such as technological advancements and evolving consumer preferences. This detailed analysis encompasses historical data (2019-2024), the current market (2025), and forecasts (2025-2033), providing a comprehensive understanding of past, present, and future trends.
USA Automotive Lubricants Industry Market Composition & Trends
The USA automotive lubricants market is characterized by moderate concentration, with key players such as ExxonMobil Corporation, Chevron Corporation, and Valvoline Inc holding significant market share. The estimated market share distribution in 2025 is as follows: ExxonMobil (xx%), Chevron (xx%), Valvoline (xx%), Others (xx%). Innovation is driven by stricter emission regulations and the demand for improved fuel efficiency, leading to the development of advanced lubricant formulations. The regulatory landscape is constantly evolving, with new standards impacting product specifications and environmental compliance. Substitute products, including bio-based lubricants, are gaining traction, albeit from a smaller market segment. End-users encompass automotive manufacturers (OEMs), independent repair shops, and consumers. M&A activity remains moderate; however, notable deals in recent years have involved collaborations to expand distribution networks and product lines. The total value of M&A deals within the last 5 years is estimated at xx Million.
- Market Concentration: Moderate, with a few dominant players.
- Innovation Catalysts: Stringent emission norms and the pursuit of fuel efficiency.
- Regulatory Landscape: Evolving standards impacting product development and compliance.
- Substitute Products: Growing interest in bio-based lubricants.
- End-User Profiles: OEMs, repair shops, and consumers.
- M&A Activity: Moderate activity, focusing on distribution expansion and product line diversification.

USA Automotive Lubricants Industry Industry Evolution
The USA automotive lubricants market has witnessed consistent growth over the historical period (2019-2024), primarily driven by the increasing vehicle population and rising demand for high-performance lubricants. The market experienced a compound annual growth rate (CAGR) of xx% during this period. Technological advancements, such as the development of synthetic and semi-synthetic lubricants with improved performance characteristics, have further propelled market expansion. Shifting consumer preferences towards longer drain intervals and enhanced fuel economy are also contributing factors. The forecast period (2025-2033) anticipates continued growth, albeit at a slightly moderated pace, with a projected CAGR of xx%. This moderation is partly due to factors like the increasing adoption of electric vehicles, which have lower lubricant demand compared to conventional vehicles. However, the growth in the commercial vehicle sector and the continued need for specialized lubricants in various industrial applications will offset this impact partially. Adoption of synthetic lubricants is expected to increase from xx% in 2025 to xx% by 2033.
Leading Regions, Countries, or Segments in USA Automotive Lubricants Industry
The passenger vehicle segment continues to dominate the USA automotive lubricants market, holding a significant share of the total market volume in 2025 (precise figures pending further market analysis). This dominance is fueled by the high penetration of passenger cars within the country's vehicle landscape. Within the product type category, engine oil retains the largest market share in 2025 (precise figures pending further market analysis), driven by its essential role in vehicle operation and relatively frequent replacement cycles. While California remains a key state due to its high vehicle population and stringent environmental regulations, other states with large populations and robust automotive sectors are also experiencing significant growth. The increasing focus on sustainability and fuel efficiency is also shifting regional demand towards higher-performing, eco-friendly lubricants.
- Key Drivers for Passenger Vehicle Segment Dominance: High vehicle ownership rates, a growing consumer preference for superior engine protection and extended vehicle lifespan, and extensive and well-established distribution networks reaching diverse consumer segments.
- Key Drivers for Engine Oil Segment Dominance: Its critical role in vehicle functionality, relatively short replacement cycles compared to other lubricants, and a diverse range of product offerings catering to various engine types and performance needs.
- Regional Growth Factors: High vehicle density in major population centers, the implementation of stringent environmental regulations driving demand for advanced lubricant formulations that minimize emissions and improve fuel economy. Moreover, economic activity and industrial output are driving demand in various regions.
USA Automotive Lubricants Industry Product Innovations
Recent innovations are predominantly focused on enhancing fuel efficiency, extending drain intervals, and improving engine protection. Fully synthetic engine oils incorporating advanced additive packages are increasingly popular, promising superior performance, durability, and extended engine lifespan. The development and adoption of bio-based lubricants are gaining traction, offering more environmentally friendly alternatives while striving to match or exceed the performance of traditional lubricants. These innovations emphasize longer-lasting performance, reduced environmental impact, and enhanced overall vehicle efficiency. Further advancements are expected in areas like friction modification and wear reduction, to further enhance engine performance and longevity.
Propelling Factors for USA Automotive Lubricants Industry Growth
Growth in the USA automotive lubricants industry is propelled by several key factors, including but not limited to: increasing vehicle sales across passenger and commercial vehicle segments, stricter emission regulations mandating the use of advanced lubricant technologies, and a continuous and increasing demand for improved fuel efficiency to reduce operating costs and environmental impact. The expansion of the commercial vehicle segment, including heavy-duty trucking and construction equipment, is a particularly significant contributor, driving demand for specialized heavy-duty lubricants designed for demanding operating conditions. The growth of online sales channels also provides greater market access and distribution reach.
Obstacles in the USA Automotive Lubricants Industry Market
Challenges include fluctuating crude oil prices impacting production costs, supply chain disruptions, increasing competition, and the evolving regulatory landscape demanding compliance with stringent environmental standards. These factors can lead to price volatility and hinder market expansion.
Future Opportunities in USA Automotive Lubricants Industry
Significant future opportunities exist in the development and marketing of sustainable and bio-based lubricants, catering to the growing global and national concern for environmental protection and reduced carbon footprint. The expanding electric vehicle (EV) market presents both challenges and opportunities, necessitating the development of specialized lubricants for EV components such as electric motors, gearboxes, and other critical systems. Further growth is anticipated from the commercial vehicle sector, industrial applications, and the continued expansion of the automotive aftermarket.
Major Players in the USA Automotive Lubricants Industry Ecosystem
- CITGO
- ExxonMobil Corporation
- BP PLC (Castrol)
- Phillips 66 Lubricants
- Motul
- Royal Dutch Shell Plc
- Chevron Corporation
- TotalEnergies
- Valvoline Inc
- AMSOIL Inc
Key Developments in USA Automotive Lubricants Industry Industry
- July 2021: Mighty Distributing System partnered with Total Specialties USA, significantly expanding Total's distribution network and market reach within the light automobile market.
- October 2021: Valvoline and Cummins extended their strategic collaboration, strengthening Valvoline's position and market share within the crucial heavy-duty diesel engine lubricant market.
- January 2022: ExxonMobil's reorganization of its business lines has resulted in a reshaped lubricant production and marketing strategy, potentially impacting market dynamics and competition.
- [Add more recent key developments here with dates and brief descriptions]
Strategic USA Automotive Lubricants Industry Market Forecast
The USA automotive lubricants market is poised for continued growth, driven by technological innovation, the increasing demand for high-performance lubricants, and the expansion of the commercial vehicle segment. While the shift towards electric vehicles presents a challenge, the opportunities in sustainable lubricants and specialized applications will offset this impact, leading to a positive outlook for the industry.
USA Automotive Lubricants Industry Segmentation
-
1. Vehicle Type
- 1.1. Commercial Vehicles
- 1.2. Motorcycles
- 1.3. Passenger Vehicles
-
2. Product Type
- 2.1. Engine Oils
- 2.2. Greases
- 2.3. Hydraulic Fluids
- 2.4. Transmission & Gear Oils
USA Automotive Lubricants Industry Segmentation By Geography
-
1. North America
- 1.1. United States
- 1.2. Canada
- 1.3. Mexico
-
2. South America
- 2.1. Brazil
- 2.2. Argentina
- 2.3. Rest of South America
-
3. Europe
- 3.1. United Kingdom
- 3.2. Germany
- 3.3. France
- 3.4. Italy
- 3.5. Spain
- 3.6. Russia
- 3.7. Benelux
- 3.8. Nordics
- 3.9. Rest of Europe
-
4. Middle East & Africa
- 4.1. Turkey
- 4.2. Israel
- 4.3. GCC
- 4.4. North Africa
- 4.5. South Africa
- 4.6. Rest of Middle East & Africa
-
5. Asia Pacific
- 5.1. China
- 5.2. India
- 5.3. Japan
- 5.4. South Korea
- 5.5. ASEAN
- 5.6. Oceania
- 5.7. Rest of Asia Pacific

USA Automotive Lubricants Industry REPORT HIGHLIGHTS
| Aspects | Details |
|---|---|
| Study Period | 2019-2033 |
| Base Year | 2024 |
| Estimated Year | 2025 |
| Forecast Period | 2025-2033 |
| Historical Period | 2019-2024 |
| Growth Rate | CAGR of 0.99% from 2019-2033 |
| Segmentation |
|
Table of Contents
- 1. Introduction
- 1.1. Research Scope
- 1.2. Market Segmentation
- 1.3. Research Methodology
- 1.4. Definitions and Assumptions
- 2. Executive Summary
- 2.1. Introduction
- 3. Market Dynamics
- 3.1. Introduction
- 3.2. Market Drivers
- 3.2.1. Increasing Automotive Production and Sales; Increasing Adoption of High-performance Lubricants
- 3.3. Market Restrains
- 3.3.1. Extended Drain Intervals; Modest Impact of Electric Vehicles (EVs) in the Future
- 3.4. Market Trends
- 3.4.1. Largest Segment By Vehicle Type
- 4. Market Factor Analysis
- 4.1. Porters Five Forces
- 4.2. Supply/Value Chain
- 4.3. PESTEL analysis
- 4.4. Market Entropy
- 4.5. Patent/Trademark Analysis
- 5. Global USA Automotive Lubricants Industry Analysis, Insights and Forecast, 2019-2031
- 5.1. Market Analysis, Insights and Forecast - by Vehicle Type
- 5.1.1. Commercial Vehicles
- 5.1.2. Motorcycles
- 5.1.3. Passenger Vehicles
- 5.2. Market Analysis, Insights and Forecast - by Product Type
- 5.2.1. Engine Oils
- 5.2.2. Greases
- 5.2.3. Hydraulic Fluids
- 5.2.4. Transmission & Gear Oils
- 5.3. Market Analysis, Insights and Forecast - by Region
- 5.3.1. North America
- 5.3.2. South America
- 5.3.3. Europe
- 5.3.4. Middle East & Africa
- 5.3.5. Asia Pacific
- 5.1. Market Analysis, Insights and Forecast - by Vehicle Type
- 6. North America USA Automotive Lubricants Industry Analysis, Insights and Forecast, 2019-2031
- 6.1. Market Analysis, Insights and Forecast - by Vehicle Type
- 6.1.1. Commercial Vehicles
- 6.1.2. Motorcycles
- 6.1.3. Passenger Vehicles
- 6.2. Market Analysis, Insights and Forecast - by Product Type
- 6.2.1. Engine Oils
- 6.2.2. Greases
- 6.2.3. Hydraulic Fluids
- 6.2.4. Transmission & Gear Oils
- 6.1. Market Analysis, Insights and Forecast - by Vehicle Type
- 7. South America USA Automotive Lubricants Industry Analysis, Insights and Forecast, 2019-2031
- 7.1. Market Analysis, Insights and Forecast - by Vehicle Type
- 7.1.1. Commercial Vehicles
- 7.1.2. Motorcycles
- 7.1.3. Passenger Vehicles
- 7.2. Market Analysis, Insights and Forecast - by Product Type
- 7.2.1. Engine Oils
- 7.2.2. Greases
- 7.2.3. Hydraulic Fluids
- 7.2.4. Transmission & Gear Oils
- 7.1. Market Analysis, Insights and Forecast - by Vehicle Type
- 8. Europe USA Automotive Lubricants Industry Analysis, Insights and Forecast, 2019-2031
- 8.1. Market Analysis, Insights and Forecast - by Vehicle Type
- 8.1.1. Commercial Vehicles
- 8.1.2. Motorcycles
- 8.1.3. Passenger Vehicles
- 8.2. Market Analysis, Insights and Forecast - by Product Type
- 8.2.1. Engine Oils
- 8.2.2. Greases
- 8.2.3. Hydraulic Fluids
- 8.2.4. Transmission & Gear Oils
- 8.1. Market Analysis, Insights and Forecast - by Vehicle Type
- 9. Middle East & Africa USA Automotive Lubricants Industry Analysis, Insights and Forecast, 2019-2031
- 9.1. Market Analysis, Insights and Forecast - by Vehicle Type
- 9.1.1. Commercial Vehicles
- 9.1.2. Motorcycles
- 9.1.3. Passenger Vehicles
- 9.2. Market Analysis, Insights and Forecast - by Product Type
- 9.2.1. Engine Oils
- 9.2.2. Greases
- 9.2.3. Hydraulic Fluids
- 9.2.4. Transmission & Gear Oils
- 9.1. Market Analysis, Insights and Forecast - by Vehicle Type
- 10. Asia Pacific USA Automotive Lubricants Industry Analysis, Insights and Forecast, 2019-2031
- 10.1. Market Analysis, Insights and Forecast - by Vehicle Type
- 10.1.1. Commercial Vehicles
- 10.1.2. Motorcycles
- 10.1.3. Passenger Vehicles
- 10.2. Market Analysis, Insights and Forecast - by Product Type
- 10.2.1. Engine Oils
- 10.2.2. Greases
- 10.2.3. Hydraulic Fluids
- 10.2.4. Transmission & Gear Oils
- 10.1. Market Analysis, Insights and Forecast - by Vehicle Type
- 11. Northeast USA Automotive Lubricants Industry Analysis, Insights and Forecast, 2019-2031
- 12. Southeast USA Automotive Lubricants Industry Analysis, Insights and Forecast, 2019-2031
- 13. Midwest USA Automotive Lubricants Industry Analysis, Insights and Forecast, 2019-2031
- 14. Southwest USA Automotive Lubricants Industry Analysis, Insights and Forecast, 2019-2031
- 15. West USA Automotive Lubricants Industry Analysis, Insights and Forecast, 2019-2031
- 16. Competitive Analysis
- 16.1. Global Market Share Analysis 2024
- 16.2. Company Profiles
- 16.2.1 CITGO
- 16.2.1.1. Overview
- 16.2.1.2. Products
- 16.2.1.3. SWOT Analysis
- 16.2.1.4. Recent Developments
- 16.2.1.5. Financials (Based on Availability)
- 16.2.2 ExxonMobil Corporation
- 16.2.2.1. Overview
- 16.2.2.2. Products
- 16.2.2.3. SWOT Analysis
- 16.2.2.4. Recent Developments
- 16.2.2.5. Financials (Based on Availability)
- 16.2.3 BP PLC (Castrol)
- 16.2.3.1. Overview
- 16.2.3.2. Products
- 16.2.3.3. SWOT Analysis
- 16.2.3.4. Recent Developments
- 16.2.3.5. Financials (Based on Availability)
- 16.2.4 Phillips 66 Lubricants
- 16.2.4.1. Overview
- 16.2.4.2. Products
- 16.2.4.3. SWOT Analysis
- 16.2.4.4. Recent Developments
- 16.2.4.5. Financials (Based on Availability)
- 16.2.5 Motul
- 16.2.5.1. Overview
- 16.2.5.2. Products
- 16.2.5.3. SWOT Analysis
- 16.2.5.4. Recent Developments
- 16.2.5.5. Financials (Based on Availability)
- 16.2.6 Royal Dutch Shell Plc
- 16.2.6.1. Overview
- 16.2.6.2. Products
- 16.2.6.3. SWOT Analysis
- 16.2.6.4. Recent Developments
- 16.2.6.5. Financials (Based on Availability)
- 16.2.7 Chevron Corporation
- 16.2.7.1. Overview
- 16.2.7.2. Products
- 16.2.7.3. SWOT Analysis
- 16.2.7.4. Recent Developments
- 16.2.7.5. Financials (Based on Availability)
- 16.2.8 TotalEnergies
- 16.2.8.1. Overview
- 16.2.8.2. Products
- 16.2.8.3. SWOT Analysis
- 16.2.8.4. Recent Developments
- 16.2.8.5. Financials (Based on Availability)
- 16.2.9 Valvoline Inc
- 16.2.9.1. Overview
- 16.2.9.2. Products
- 16.2.9.3. SWOT Analysis
- 16.2.9.4. Recent Developments
- 16.2.9.5. Financials (Based on Availability)
- 16.2.10 AMSOIL Inc
- 16.2.10.1. Overview
- 16.2.10.2. Products
- 16.2.10.3. SWOT Analysis
- 16.2.10.4. Recent Developments
- 16.2.10.5. Financials (Based on Availability)
- 16.2.1 CITGO
List of Figures
- Figure 1: Global USA Automotive Lubricants Industry Revenue Breakdown (Million, %) by Region 2024 & 2032
- Figure 2: Global USA Automotive Lubricants Industry Volume Breakdown (Billion, %) by Region 2024 & 2032
- Figure 3: United states USA Automotive Lubricants Industry Revenue (Million), by Country 2024 & 2032
- Figure 4: United states USA Automotive Lubricants Industry Volume (Billion), by Country 2024 & 2032
- Figure 5: United states USA Automotive Lubricants Industry Revenue Share (%), by Country 2024 & 2032
- Figure 6: United states USA Automotive Lubricants Industry Volume Share (%), by Country 2024 & 2032
- Figure 7: North America USA Automotive Lubricants Industry Revenue (Million), by Vehicle Type 2024 & 2032
- Figure 8: North America USA Automotive Lubricants Industry Volume (Billion), by Vehicle Type 2024 & 2032
- Figure 9: North America USA Automotive Lubricants Industry Revenue Share (%), by Vehicle Type 2024 & 2032
- Figure 10: North America USA Automotive Lubricants Industry Volume Share (%), by Vehicle Type 2024 & 2032
- Figure 11: North America USA Automotive Lubricants Industry Revenue (Million), by Product Type 2024 & 2032
- Figure 12: North America USA Automotive Lubricants Industry Volume (Billion), by Product Type 2024 & 2032
- Figure 13: North America USA Automotive Lubricants Industry Revenue Share (%), by Product Type 2024 & 2032
- Figure 14: North America USA Automotive Lubricants Industry Volume Share (%), by Product Type 2024 & 2032
- Figure 15: North America USA Automotive Lubricants Industry Revenue (Million), by Country 2024 & 2032
- Figure 16: North America USA Automotive Lubricants Industry Volume (Billion), by Country 2024 & 2032
- Figure 17: North America USA Automotive Lubricants Industry Revenue Share (%), by Country 2024 & 2032
- Figure 18: North America USA Automotive Lubricants Industry Volume Share (%), by Country 2024 & 2032
- Figure 19: South America USA Automotive Lubricants Industry Revenue (Million), by Vehicle Type 2024 & 2032
- Figure 20: South America USA Automotive Lubricants Industry Volume (Billion), by Vehicle Type 2024 & 2032
- Figure 21: South America USA Automotive Lubricants Industry Revenue Share (%), by Vehicle Type 2024 & 2032
- Figure 22: South America USA Automotive Lubricants Industry Volume Share (%), by Vehicle Type 2024 & 2032
- Figure 23: South America USA Automotive Lubricants Industry Revenue (Million), by Product Type 2024 & 2032
- Figure 24: South America USA Automotive Lubricants Industry Volume (Billion), by Product Type 2024 & 2032
- Figure 25: South America USA Automotive Lubricants Industry Revenue Share (%), by Product Type 2024 & 2032
- Figure 26: South America USA Automotive Lubricants Industry Volume Share (%), by Product Type 2024 & 2032
- Figure 27: South America USA Automotive Lubricants Industry Revenue (Million), by Country 2024 & 2032
- Figure 28: South America USA Automotive Lubricants Industry Volume (Billion), by Country 2024 & 2032
- Figure 29: South America USA Automotive Lubricants Industry Revenue Share (%), by Country 2024 & 2032
- Figure 30: South America USA Automotive Lubricants Industry Volume Share (%), by Country 2024 & 2032
- Figure 31: Europe USA Automotive Lubricants Industry Revenue (Million), by Vehicle Type 2024 & 2032
- Figure 32: Europe USA Automotive Lubricants Industry Volume (Billion), by Vehicle Type 2024 & 2032
- Figure 33: Europe USA Automotive Lubricants Industry Revenue Share (%), by Vehicle Type 2024 & 2032
- Figure 34: Europe USA Automotive Lubricants Industry Volume Share (%), by Vehicle Type 2024 & 2032
- Figure 35: Europe USA Automotive Lubricants Industry Revenue (Million), by Product Type 2024 & 2032
- Figure 36: Europe USA Automotive Lubricants Industry Volume (Billion), by Product Type 2024 & 2032
- Figure 37: Europe USA Automotive Lubricants Industry Revenue Share (%), by Product Type 2024 & 2032
- Figure 38: Europe USA Automotive Lubricants Industry Volume Share (%), by Product Type 2024 & 2032
- Figure 39: Europe USA Automotive Lubricants Industry Revenue (Million), by Country 2024 & 2032
- Figure 40: Europe USA Automotive Lubricants Industry Volume (Billion), by Country 2024 & 2032
- Figure 41: Europe USA Automotive Lubricants Industry Revenue Share (%), by Country 2024 & 2032
- Figure 42: Europe USA Automotive Lubricants Industry Volume Share (%), by Country 2024 & 2032
- Figure 43: Middle East & Africa USA Automotive Lubricants Industry Revenue (Million), by Vehicle Type 2024 & 2032
- Figure 44: Middle East & Africa USA Automotive Lubricants Industry Volume (Billion), by Vehicle Type 2024 & 2032
- Figure 45: Middle East & Africa USA Automotive Lubricants Industry Revenue Share (%), by Vehicle Type 2024 & 2032
- Figure 46: Middle East & Africa USA Automotive Lubricants Industry Volume Share (%), by Vehicle Type 2024 & 2032
- Figure 47: Middle East & Africa USA Automotive Lubricants Industry Revenue (Million), by Product Type 2024 & 2032
- Figure 48: Middle East & Africa USA Automotive Lubricants Industry Volume (Billion), by Product Type 2024 & 2032
- Figure 49: Middle East & Africa USA Automotive Lubricants Industry Revenue Share (%), by Product Type 2024 & 2032
- Figure 50: Middle East & Africa USA Automotive Lubricants Industry Volume Share (%), by Product Type 2024 & 2032
- Figure 51: Middle East & Africa USA Automotive Lubricants Industry Revenue (Million), by Country 2024 & 2032
- Figure 52: Middle East & Africa USA Automotive Lubricants Industry Volume (Billion), by Country 2024 & 2032
- Figure 53: Middle East & Africa USA Automotive Lubricants Industry Revenue Share (%), by Country 2024 & 2032
- Figure 54: Middle East & Africa USA Automotive Lubricants Industry Volume Share (%), by Country 2024 & 2032
- Figure 55: Asia Pacific USA Automotive Lubricants Industry Revenue (Million), by Vehicle Type 2024 & 2032
- Figure 56: Asia Pacific USA Automotive Lubricants Industry Volume (Billion), by Vehicle Type 2024 & 2032
- Figure 57: Asia Pacific USA Automotive Lubricants Industry Revenue Share (%), by Vehicle Type 2024 & 2032
- Figure 58: Asia Pacific USA Automotive Lubricants Industry Volume Share (%), by Vehicle Type 2024 & 2032
- Figure 59: Asia Pacific USA Automotive Lubricants Industry Revenue (Million), by Product Type 2024 & 2032
- Figure 60: Asia Pacific USA Automotive Lubricants Industry Volume (Billion), by Product Type 2024 & 2032
- Figure 61: Asia Pacific USA Automotive Lubricants Industry Revenue Share (%), by Product Type 2024 & 2032
- Figure 62: Asia Pacific USA Automotive Lubricants Industry Volume Share (%), by Product Type 2024 & 2032
- Figure 63: Asia Pacific USA Automotive Lubricants Industry Revenue (Million), by Country 2024 & 2032
- Figure 64: Asia Pacific USA Automotive Lubricants Industry Volume (Billion), by Country 2024 & 2032
- Figure 65: Asia Pacific USA Automotive Lubricants Industry Revenue Share (%), by Country 2024 & 2032
- Figure 66: Asia Pacific USA Automotive Lubricants Industry Volume Share (%), by Country 2024 & 2032
List of Tables
- Table 1: Global USA Automotive Lubricants Industry Revenue Million Forecast, by Region 2019 & 2032
- Table 2: Global USA Automotive Lubricants Industry Volume Billion Forecast, by Region 2019 & 2032
- Table 3: Global USA Automotive Lubricants Industry Revenue Million Forecast, by Vehicle Type 2019 & 2032
- Table 4: Global USA Automotive Lubricants Industry Volume Billion Forecast, by Vehicle Type 2019 & 2032
- Table 5: Global USA Automotive Lubricants Industry Revenue Million Forecast, by Product Type 2019 & 2032
- Table 6: Global USA Automotive Lubricants Industry Volume Billion Forecast, by Product Type 2019 & 2032
- Table 7: Global USA Automotive Lubricants Industry Revenue Million Forecast, by Region 2019 & 2032
- Table 8: Global USA Automotive Lubricants Industry Volume Billion Forecast, by Region 2019 & 2032
- Table 9: Global USA Automotive Lubricants Industry Revenue Million Forecast, by Country 2019 & 2032
- Table 10: Global USA Automotive Lubricants Industry Volume Billion Forecast, by Country 2019 & 2032
- Table 11: Northeast USA Automotive Lubricants Industry Revenue (Million) Forecast, by Application 2019 & 2032
- Table 12: Northeast USA Automotive Lubricants Industry Volume (Billion) Forecast, by Application 2019 & 2032
- Table 13: Southeast USA Automotive Lubricants Industry Revenue (Million) Forecast, by Application 2019 & 2032
- Table 14: Southeast USA Automotive Lubricants Industry Volume (Billion) Forecast, by Application 2019 & 2032
- Table 15: Midwest USA Automotive Lubricants Industry Revenue (Million) Forecast, by Application 2019 & 2032
- Table 16: Midwest USA Automotive Lubricants Industry Volume (Billion) Forecast, by Application 2019 & 2032
- Table 17: Southwest USA Automotive Lubricants Industry Revenue (Million) Forecast, by Application 2019 & 2032
- Table 18: Southwest USA Automotive Lubricants Industry Volume (Billion) Forecast, by Application 2019 & 2032
- Table 19: West USA Automotive Lubricants Industry Revenue (Million) Forecast, by Application 2019 & 2032
- Table 20: West USA Automotive Lubricants Industry Volume (Billion) Forecast, by Application 2019 & 2032
- Table 21: Global USA Automotive Lubricants Industry Revenue Million Forecast, by Vehicle Type 2019 & 2032
- Table 22: Global USA Automotive Lubricants Industry Volume Billion Forecast, by Vehicle Type 2019 & 2032
- Table 23: Global USA Automotive Lubricants Industry Revenue Million Forecast, by Product Type 2019 & 2032
- Table 24: Global USA Automotive Lubricants Industry Volume Billion Forecast, by Product Type 2019 & 2032
- Table 25: Global USA Automotive Lubricants Industry Revenue Million Forecast, by Country 2019 & 2032
- Table 26: Global USA Automotive Lubricants Industry Volume Billion Forecast, by Country 2019 & 2032
- Table 27: United States USA Automotive Lubricants Industry Revenue (Million) Forecast, by Application 2019 & 2032
- Table 28: United States USA Automotive Lubricants Industry Volume (Billion) Forecast, by Application 2019 & 2032
- Table 29: Canada USA Automotive Lubricants Industry Revenue (Million) Forecast, by Application 2019 & 2032
- Table 30: Canada USA Automotive Lubricants Industry Volume (Billion) Forecast, by Application 2019 & 2032
- Table 31: Mexico USA Automotive Lubricants Industry Revenue (Million) Forecast, by Application 2019 & 2032
- Table 32: Mexico USA Automotive Lubricants Industry Volume (Billion) Forecast, by Application 2019 & 2032
- Table 33: Global USA Automotive Lubricants Industry Revenue Million Forecast, by Vehicle Type 2019 & 2032
- Table 34: Global USA Automotive Lubricants Industry Volume Billion Forecast, by Vehicle Type 2019 & 2032
- Table 35: Global USA Automotive Lubricants Industry Revenue Million Forecast, by Product Type 2019 & 2032
- Table 36: Global USA Automotive Lubricants Industry Volume Billion Forecast, by Product Type 2019 & 2032
- Table 37: Global USA Automotive Lubricants Industry Revenue Million Forecast, by Country 2019 & 2032
- Table 38: Global USA Automotive Lubricants Industry Volume Billion Forecast, by Country 2019 & 2032
- Table 39: Brazil USA Automotive Lubricants Industry Revenue (Million) Forecast, by Application 2019 & 2032
- Table 40: Brazil USA Automotive Lubricants Industry Volume (Billion) Forecast, by Application 2019 & 2032
- Table 41: Argentina USA Automotive Lubricants Industry Revenue (Million) Forecast, by Application 2019 & 2032
- Table 42: Argentina USA Automotive Lubricants Industry Volume (Billion) Forecast, by Application 2019 & 2032
- Table 43: Rest of South America USA Automotive Lubricants Industry Revenue (Million) Forecast, by Application 2019 & 2032
- Table 44: Rest of South America USA Automotive Lubricants Industry Volume (Billion) Forecast, by Application 2019 & 2032
- Table 45: Global USA Automotive Lubricants Industry Revenue Million Forecast, by Vehicle Type 2019 & 2032
- Table 46: Global USA Automotive Lubricants Industry Volume Billion Forecast, by Vehicle Type 2019 & 2032
- Table 47: Global USA Automotive Lubricants Industry Revenue Million Forecast, by Product Type 2019 & 2032
- Table 48: Global USA Automotive Lubricants Industry Volume Billion Forecast, by Product Type 2019 & 2032
- Table 49: Global USA Automotive Lubricants Industry Revenue Million Forecast, by Country 2019 & 2032
- Table 50: Global USA Automotive Lubricants Industry Volume Billion Forecast, by Country 2019 & 2032
- Table 51: United Kingdom USA Automotive Lubricants Industry Revenue (Million) Forecast, by Application 2019 & 2032
- Table 52: United Kingdom USA Automotive Lubricants Industry Volume (Billion) Forecast, by Application 2019 & 2032
- Table 53: Germany USA Automotive Lubricants Industry Revenue (Million) Forecast, by Application 2019 & 2032
- Table 54: Germany USA Automotive Lubricants Industry Volume (Billion) Forecast, by Application 2019 & 2032
- Table 55: France USA Automotive Lubricants Industry Revenue (Million) Forecast, by Application 2019 & 2032
- Table 56: France USA Automotive Lubricants Industry Volume (Billion) Forecast, by Application 2019 & 2032
- Table 57: Italy USA Automotive Lubricants Industry Revenue (Million) Forecast, by Application 2019 & 2032
- Table 58: Italy USA Automotive Lubricants Industry Volume (Billion) Forecast, by Application 2019 & 2032
- Table 59: Spain USA Automotive Lubricants Industry Revenue (Million) Forecast, by Application 2019 & 2032
- Table 60: Spain USA Automotive Lubricants Industry Volume (Billion) Forecast, by Application 2019 & 2032
- Table 61: Russia USA Automotive Lubricants Industry Revenue (Million) Forecast, by Application 2019 & 2032
- Table 62: Russia USA Automotive Lubricants Industry Volume (Billion) Forecast, by Application 2019 & 2032
- Table 63: Benelux USA Automotive Lubricants Industry Revenue (Million) Forecast, by Application 2019 & 2032
- Table 64: Benelux USA Automotive Lubricants Industry Volume (Billion) Forecast, by Application 2019 & 2032
- Table 65: Nordics USA Automotive Lubricants Industry Revenue (Million) Forecast, by Application 2019 & 2032
- Table 66: Nordics USA Automotive Lubricants Industry Volume (Billion) Forecast, by Application 2019 & 2032
- Table 67: Rest of Europe USA Automotive Lubricants Industry Revenue (Million) Forecast, by Application 2019 & 2032
- Table 68: Rest of Europe USA Automotive Lubricants Industry Volume (Billion) Forecast, by Application 2019 & 2032
- Table 69: Global USA Automotive Lubricants Industry Revenue Million Forecast, by Vehicle Type 2019 & 2032
- Table 70: Global USA Automotive Lubricants Industry Volume Billion Forecast, by Vehicle Type 2019 & 2032
- Table 71: Global USA Automotive Lubricants Industry Revenue Million Forecast, by Product Type 2019 & 2032
- Table 72: Global USA Automotive Lubricants Industry Volume Billion Forecast, by Product Type 2019 & 2032
- Table 73: Global USA Automotive Lubricants Industry Revenue Million Forecast, by Country 2019 & 2032
- Table 74: Global USA Automotive Lubricants Industry Volume Billion Forecast, by Country 2019 & 2032
- Table 75: Turkey USA Automotive Lubricants Industry Revenue (Million) Forecast, by Application 2019 & 2032
- Table 76: Turkey USA Automotive Lubricants Industry Volume (Billion) Forecast, by Application 2019 & 2032
- Table 77: Israel USA Automotive Lubricants Industry Revenue (Million) Forecast, by Application 2019 & 2032
- Table 78: Israel USA Automotive Lubricants Industry Volume (Billion) Forecast, by Application 2019 & 2032
- Table 79: GCC USA Automotive Lubricants Industry Revenue (Million) Forecast, by Application 2019 & 2032
- Table 80: GCC USA Automotive Lubricants Industry Volume (Billion) Forecast, by Application 2019 & 2032
- Table 81: North Africa USA Automotive Lubricants Industry Revenue (Million) Forecast, by Application 2019 & 2032
- Table 82: North Africa USA Automotive Lubricants Industry Volume (Billion) Forecast, by Application 2019 & 2032
- Table 83: South Africa USA Automotive Lubricants Industry Revenue (Million) Forecast, by Application 2019 & 2032
- Table 84: South Africa USA Automotive Lubricants Industry Volume (Billion) Forecast, by Application 2019 & 2032
- Table 85: Rest of Middle East & Africa USA Automotive Lubricants Industry Revenue (Million) Forecast, by Application 2019 & 2032
- Table 86: Rest of Middle East & Africa USA Automotive Lubricants Industry Volume (Billion) Forecast, by Application 2019 & 2032
- Table 87: Global USA Automotive Lubricants Industry Revenue Million Forecast, by Vehicle Type 2019 & 2032
- Table 88: Global USA Automotive Lubricants Industry Volume Billion Forecast, by Vehicle Type 2019 & 2032
- Table 89: Global USA Automotive Lubricants Industry Revenue Million Forecast, by Product Type 2019 & 2032
- Table 90: Global USA Automotive Lubricants Industry Volume Billion Forecast, by Product Type 2019 & 2032
- Table 91: Global USA Automotive Lubricants Industry Revenue Million Forecast, by Country 2019 & 2032
- Table 92: Global USA Automotive Lubricants Industry Volume Billion Forecast, by Country 2019 & 2032
- Table 93: China USA Automotive Lubricants Industry Revenue (Million) Forecast, by Application 2019 & 2032
- Table 94: China USA Automotive Lubricants Industry Volume (Billion) Forecast, by Application 2019 & 2032
- Table 95: India USA Automotive Lubricants Industry Revenue (Million) Forecast, by Application 2019 & 2032
- Table 96: India USA Automotive Lubricants Industry Volume (Billion) Forecast, by Application 2019 & 2032
- Table 97: Japan USA Automotive Lubricants Industry Revenue (Million) Forecast, by Application 2019 & 2032
- Table 98: Japan USA Automotive Lubricants Industry Volume (Billion) Forecast, by Application 2019 & 2032
- Table 99: South Korea USA Automotive Lubricants Industry Revenue (Million) Forecast, by Application 2019 & 2032
- Table 100: South Korea USA Automotive Lubricants Industry Volume (Billion) Forecast, by Application 2019 & 2032
- Table 101: ASEAN USA Automotive Lubricants Industry Revenue (Million) Forecast, by Application 2019 & 2032
- Table 102: ASEAN USA Automotive Lubricants Industry Volume (Billion) Forecast, by Application 2019 & 2032
- Table 103: Oceania USA Automotive Lubricants Industry Revenue (Million) Forecast, by Application 2019 & 2032
- Table 104: Oceania USA Automotive Lubricants Industry Volume (Billion) Forecast, by Application 2019 & 2032
- Table 105: Rest of Asia Pacific USA Automotive Lubricants Industry Revenue (Million) Forecast, by Application 2019 & 2032
- Table 106: Rest of Asia Pacific USA Automotive Lubricants Industry Volume (Billion) Forecast, by Application 2019 & 2032
Frequently Asked Questions
1. What is the projected Compound Annual Growth Rate (CAGR) of the USA Automotive Lubricants Industry?
The projected CAGR is approximately 0.99%.
2. Which companies are prominent players in the USA Automotive Lubricants Industry?
Key companies in the market include CITGO, ExxonMobil Corporation, BP PLC (Castrol), Phillips 66 Lubricants, Motul, Royal Dutch Shell Plc, Chevron Corporation, TotalEnergies, Valvoline Inc, AMSOIL Inc.
3. What are the main segments of the USA Automotive Lubricants Industry?
The market segments include Vehicle Type, Product Type.
4. Can you provide details about the market size?
The market size is estimated to be USD XX Million as of 2022.
5. What are some drivers contributing to market growth?
Increasing Automotive Production and Sales; Increasing Adoption of High-performance Lubricants.
6. What are the notable trends driving market growth?
Largest Segment By Vehicle Type : <span style="font-family: 'regular_bold';color:#0e7db3;">Passenger Vehicles</span>.
7. Are there any restraints impacting market growth?
Extended Drain Intervals; Modest Impact of Electric Vehicles (EVs) in the Future.
8. Can you provide examples of recent developments in the market?
January 2022: Effective April 1, ExxonMobil Corporation was organized along three business lines - ExxonMobil Upstream Company, ExxonMobil Product Solutions and ExxonMobil Low Carbon Solutions.October 2021: Valvoline and Cummins extended their long-standing marketing and technology collaboration agreement for another five years. Cummins will endorse and promote Valvoline's Premium Blue engine oil for its heavy-duty diesel engines and generators and will distribute Valvoline products through its global distribution networks.July 2021: Mighty Distributing System (Mighty Auto Parts), a pioneer in automotive aftermarket goods and services, announced a new relationship with Total Specialties USA. It would target the Quartz Ineo and Quartz 9000 sub-ranges, geared for light automobiles and meet European OEMs' most stringent criteria.
9. What pricing options are available for accessing the report?
Pricing options include single-user, multi-user, and enterprise licenses priced at USD 3800, USD 4500, and USD 5800 respectively.
10. Is the market size provided in terms of value or volume?
The market size is provided in terms of value, measured in Million and volume, measured in Billion.
11. Are there any specific market keywords associated with the report?
Yes, the market keyword associated with the report is "USA Automotive Lubricants Industry," which aids in identifying and referencing the specific market segment covered.
12. How do I determine which pricing option suits my needs best?
The pricing options vary based on user requirements and access needs. Individual users may opt for single-user licenses, while businesses requiring broader access may choose multi-user or enterprise licenses for cost-effective access to the report.
13. Are there any additional resources or data provided in the USA Automotive Lubricants Industry report?
While the report offers comprehensive insights, it's advisable to review the specific contents or supplementary materials provided to ascertain if additional resources or data are available.
14. How can I stay updated on further developments or reports in the USA Automotive Lubricants Industry?
To stay informed about further developments, trends, and reports in the USA Automotive Lubricants Industry, consider subscribing to industry newsletters, following relevant companies and organizations, or regularly checking reputable industry news sources and publications.
Methodology
Step 1 - Identification of Relevant Samples Size from Population Database


Step 2 - Approaches for Defining Global Market Size (Value, Volume* & Price*)

Note*: In applicable scenarios
Step 3 - Data Sources
Primary Research
- Web Analytics
- Survey Reports
- Research Institute
- Latest Research Reports
- Opinion Leaders
Secondary Research
- Annual Reports
- White Paper
- Latest Press Release
- Industry Association
- Paid Database
- Investor Presentations

Step 4 - Data Triangulation
Involves using different sources of information in order to increase the validity of a study
These sources are likely to be stakeholders in a program - participants, other researchers, program staff, other community members, and so on.
Then we put all data in single framework & apply various statistical tools to find out the dynamic on the market.
During the analysis stage, feedback from the stakeholder groups would be compared to determine areas of agreement as well as areas of divergence
