

Key Insights
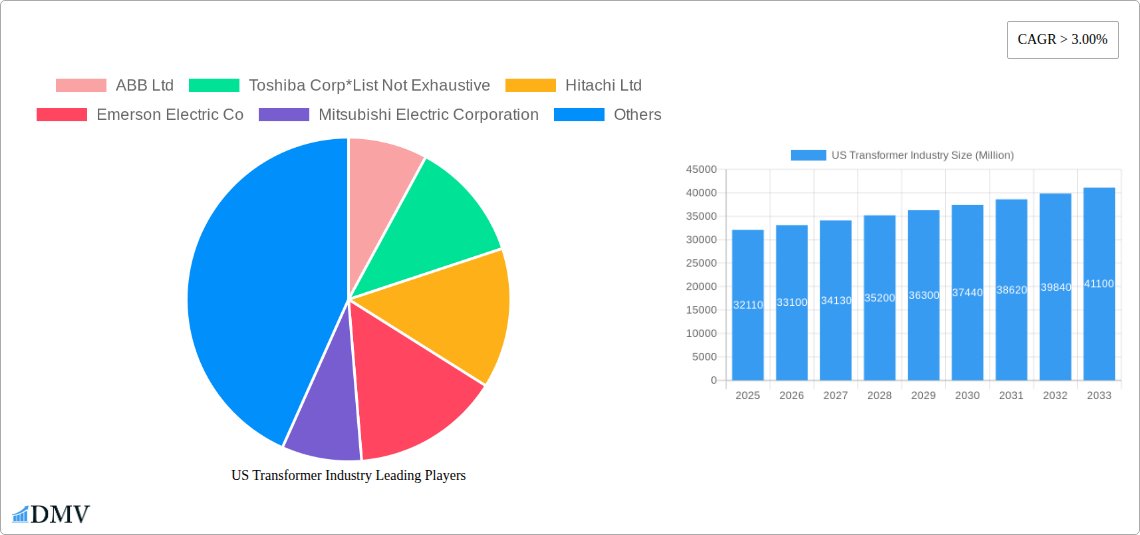
The US transformer industry, a crucial component of the nation's power infrastructure, is projected to experience robust growth over the next decade. With a 2025 market size of $32.11 billion and a Compound Annual Growth Rate (CAGR) exceeding 3%, the market is poised for significant expansion through 2033. Several factors drive this growth, including increasing investments in renewable energy sources like solar and wind power, necessitating efficient and reliable power transmission and distribution. Furthermore, the modernization and upgrading of aging grid infrastructure across the United States, particularly in the Northeast and West regions experiencing population growth and industrial development, contribute significantly to market demand. The increasing adoption of smart grid technologies and the growing need for improved energy efficiency further fuel this expansion. Market segmentation reveals strong demand across various transformer types, including power and distribution transformers, with large-scale transformers experiencing particularly robust growth driven by large-scale energy projects. Air-cooled transformers currently dominate the market, though oil-cooled transformers are expected to witness increased adoption due to their higher efficiency in specific applications.
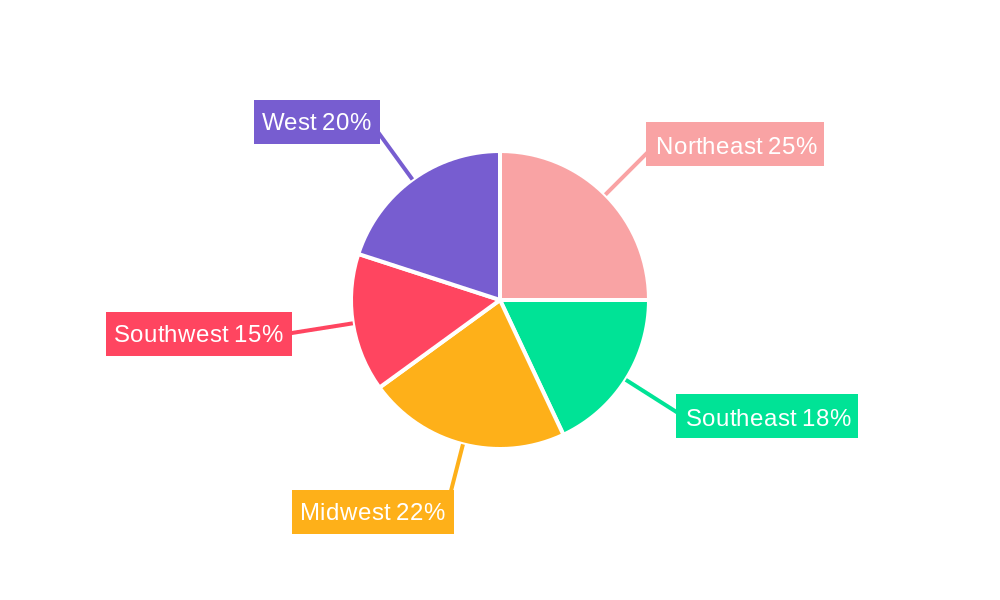
Competition in the US transformer market is intense, with major players such as ABB, Toshiba, Hitachi, Emerson Electric, Mitsubishi Electric, Siemens, Schneider Electric, Eaton, General Electric, and Panasonic vying for market share. However, the market also presents opportunities for smaller, specialized companies focusing on niche applications or innovative technologies. Restraining factors include fluctuating raw material prices (particularly copper and steel), supply chain disruptions, and potential regulatory changes impacting grid modernization initiatives. Despite these challenges, the long-term outlook remains positive, driven by consistent investment in grid infrastructure and the broader transition to renewable energy, ensuring sustained growth for the US transformer market throughout the forecast period. This growth will be unevenly distributed across regions, with the Northeast, West, and Southwest likely to see faster expansion due to factors such as increased population density and ongoing infrastructure projects.
US Transformer Industry Market Report: 2019-2033
This comprehensive report provides a detailed analysis of the US transformer industry, encompassing market trends, leading players, technological advancements, and future growth prospects. Covering the period from 2019 to 2033, with a base year of 2025 and a forecast period of 2025-2033, this report is an indispensable resource for stakeholders seeking to navigate this dynamic sector.
US Transformer Industry Market Composition & Trends
The US transformer market, valued at $XX Million in 2024, is characterized by a moderately concentrated landscape, with key players such as ABB Ltd, Toshiba Corp, Hitachi Ltd, Emerson Electric Co, Mitsubishi Electric Corporation, Siemens AG, Schneider Electric SE, Eaton Corporation PLC, General Electric Company, and Panasonic Corporation holding significant market share. Market concentration is estimated at xx%, with the top five players commanding approximately xx% of the market. Innovation is driven by increasing demand for energy-efficient transformers, necessitating advancements in core materials and cooling technologies. Stringent environmental regulations, including the DOE's December 2022 initiative on energy-efficient distribution transformers, are shaping industry practices. Substitute products, though limited, include alternative energy distribution methods, while end-user demand is primarily driven by the power generation, transmission, and distribution sectors, as well as industrial and commercial applications. M&A activity has been moderate in recent years, with deal values averaging $XX Million annually.
- Market Share Distribution: Top 5 players: xx%; Remaining players: xx%.
- M&A Deal Value (2019-2024): Average $XX Million annually.
- Key Innovation Catalysts: Energy efficiency standards, renewable energy integration.
- Regulatory Landscape: Stringent environmental regulations, focus on grid modernization.
US Transformer Industry Industry Evolution
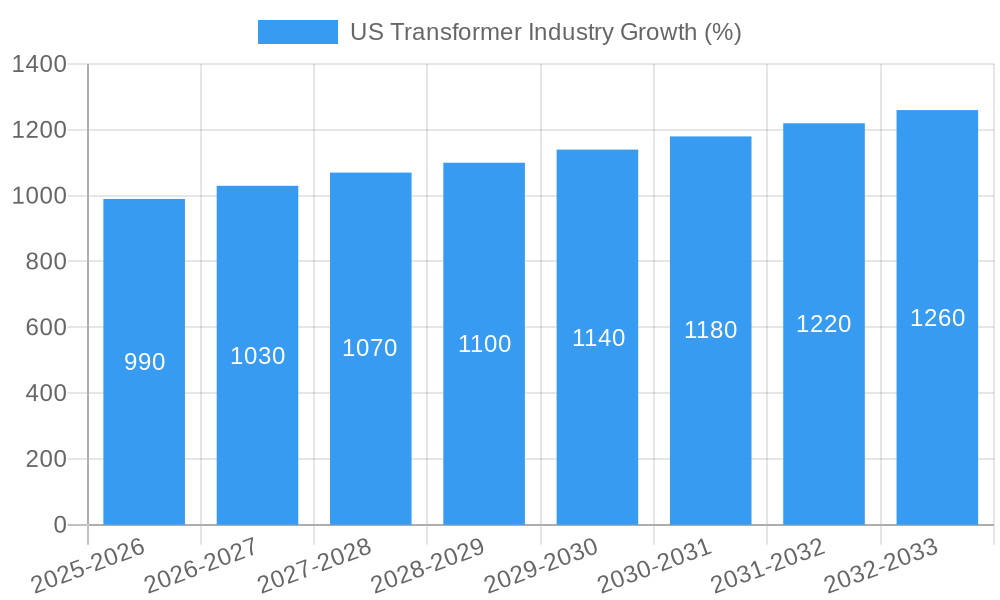
The US transformer industry has witnessed consistent growth over the historical period (2019-2024), with a Compound Annual Growth Rate (CAGR) of xx%. This growth is attributed to increased infrastructure investments, rising electricity demand fueled by industrial expansion and data center growth, and the ongoing transition to renewable energy sources. Technological advancements, particularly in the development of higher-efficiency transformers with improved cooling systems (air-cooled and oil-cooled) and advanced materials, have been a key driver of this growth. Consumer demand is shifting towards more sustainable and reliable transformer solutions, emphasizing energy efficiency and reduced environmental impact. The market is expected to maintain a healthy CAGR of xx% during the forecast period (2025-2033), driven by continuous infrastructure development and the increasing adoption of smart grid technologies.
- Historical Growth Rate (2019-2024): xx% CAGR
- Projected Growth Rate (2025-2033): xx% CAGR
- Key Technological Advancements: Advanced cooling systems, improved core materials, smart grid integration.
Leading Regions, Countries, or Segments in US Transformer Industry
The US transformer market demonstrates regional variations, with the Northeast and West Coast experiencing comparatively higher growth due to robust infrastructure development and concentration of data centers and renewable energy projects. Within transformer types, power transformers dominate the market due to their crucial role in high-voltage transmission. Similarly, large power rating transformers are in high demand, owing to expanding power generation and transmission capacity. Air-cooled transformers hold a larger market share compared to oil-cooled, primarily driven by cost-effectiveness and ease of maintenance.
- Key Drivers (Northeast & West Coast): High infrastructure investment, data center expansion, renewable energy projects.
- Dominant Transformer Type: Power Transformers
- Dominant Power Rating: Large
- Dominant Cooling Type: Air-Cooled
US Transformer Industry Product Innovations
Recent innovations focus on enhancing energy efficiency, improving reliability, and reducing environmental impact. This includes the development of amorphous core transformers with significantly reduced energy losses, advanced cooling technologies like liquid-cooled systems, and smart transformers with built-in monitoring and diagnostic capabilities. These innovations offer unique selling propositions such as lower operating costs, improved grid stability, and reduced carbon footprint.
Propelling Factors for US Transformer Industry Growth
The US transformer industry's growth is propelled by several factors: rising electricity demand across various sectors, increasing investments in grid modernization and expansion, the deployment of renewable energy sources (driving demand for large-scale transformers), government initiatives promoting energy efficiency, and technological advancements leading to higher efficiency and reliability.
Obstacles in the US Transformer Industry Market
The industry faces challenges such as supply chain disruptions affecting the availability of raw materials, increased competition from international players, and the complexity and cost associated with regulatory compliance (like meeting increasingly stringent energy efficiency standards). These factors can lead to price fluctuations and potential delays in project implementation.
Future Opportunities in US Transformer Industry
Significant opportunities exist in the development and adoption of smart grid technologies, the integration of renewable energy sources, and the expansion of data centers. The increasing demand for energy-efficient solutions and the development of advanced materials offer further growth potential. Expansion into emerging markets and the integration of digital technologies into transformer design and operation present considerable untapped potential.
Major Players in the US Transformer Industry Ecosystem
- ABB Ltd
- Toshiba Corp
- Hitachi Ltd
- Emerson Electric Co
- Mitsubishi Electric Corporation
- Siemens AG
- Schneider Electric SE
- Eaton Corporation PLC
- General Electric Company
- Panasonic Corporation
Key Developments in US Transformer Industry Industry
- December 2022: Hitachi Energy announced a USD 37 Million investment to expand its power transformer manufacturing facility in South Boston, Virginia. This expansion is aimed at meeting the growing demand from utility customers and renewable energy applications.
- December 2022: The US Department of Energy (DOE) proposed new energy-efficiency criteria for distribution transformers, promoting energy savings and reducing CO2 emissions.
Strategic US Transformer Industry Market Forecast
The US transformer market is poised for sustained growth, driven by the ongoing expansion of the power grid, increasing penetration of renewable energy, and the growing demand for reliable and efficient power solutions. The focus on energy efficiency, technological advancements, and government support will continue to shape the industry's trajectory, creating significant opportunities for both established players and new entrants.
US Transformer Industry Segmentation
- 1. Production Analysis
- 2. Consumption Analysis
- 3. Import Market Analysis (Value & Volume)
- 4. Export Market Analysis (Value & Volume)
- 5. Price Trend Analysis
US Transformer Industry Segmentation By Geography
-
1. North America
- 1.1. United States
- 1.2. Canada
- 1.3. Mexico
-
2. South America
- 2.1. Brazil
- 2.2. Argentina
- 2.3. Rest of South America
-
3. Europe
- 3.1. United Kingdom
- 3.2. Germany
- 3.3. France
- 3.4. Italy
- 3.5. Spain
- 3.6. Russia
- 3.7. Benelux
- 3.8. Nordics
- 3.9. Rest of Europe
-
4. Middle East & Africa
- 4.1. Turkey
- 4.2. Israel
- 4.3. GCC
- 4.4. North Africa
- 4.5. South Africa
- 4.6. Rest of Middle East & Africa
-
5. Asia Pacific
- 5.1. China
- 5.2. India
- 5.3. Japan
- 5.4. South Korea
- 5.5. ASEAN
- 5.6. Oceania
- 5.7. Rest of Asia Pacific
US Transformer Industry REPORT HIGHLIGHTS
| Aspects | Details |
|---|---|
| Study Period | 2019-2033 |
| Base Year | 2024 |
| Estimated Year | 2025 |
| Forecast Period | 2025-2033 |
| Historical Period | 2019-2024 |
| Growth Rate | CAGR of > 3.00% from 2019-2033 |
| Segmentation |
|
Table of Contents
- 1. Introduction
- 1.1. Research Scope
- 1.2. Market Segmentation
- 1.3. Research Methodology
- 1.4. Definitions and Assumptions
- 2. Executive Summary
- 2.1. Introduction
- 3. Market Dynamics
- 3.1. Introduction
- 3.2. Market Drivers
- 3.2.1. 4.; Increasing Natural Gas Demand4.; Rising Pipeline Network and Associated Infrastructure Development
- 3.3. Market Restrains
- 3.3.1. 4.; Rising Shift toward Renewable Energy
- 3.4. Market Trends
- 3.4.1. Distribution Transformer Expected to Dominate the Market
- 4. Market Factor Analysis
- 4.1. Porters Five Forces
- 4.2. Supply/Value Chain
- 4.3. PESTEL analysis
- 4.4. Market Entropy
- 4.5. Patent/Trademark Analysis
- 5. Global US Transformer Industry Analysis, Insights and Forecast, 2019-2031
- 5.1. Market Analysis, Insights and Forecast - by Production Analysis
- 5.2. Market Analysis, Insights and Forecast - by Consumption Analysis
- 5.3. Market Analysis, Insights and Forecast - by Import Market Analysis (Value & Volume)
- 5.4. Market Analysis, Insights and Forecast - by Export Market Analysis (Value & Volume)
- 5.5. Market Analysis, Insights and Forecast - by Price Trend Analysis
- 5.6. Market Analysis, Insights and Forecast - by Region
- 5.6.1. North America
- 5.6.2. South America
- 5.6.3. Europe
- 5.6.4. Middle East & Africa
- 5.6.5. Asia Pacific
- 5.1. Market Analysis, Insights and Forecast - by Production Analysis
- 6. North America US Transformer Industry Analysis, Insights and Forecast, 2019-2031
- 6.1. Market Analysis, Insights and Forecast - by Production Analysis
- 6.2. Market Analysis, Insights and Forecast - by Consumption Analysis
- 6.3. Market Analysis, Insights and Forecast - by Import Market Analysis (Value & Volume)
- 6.4. Market Analysis, Insights and Forecast - by Export Market Analysis (Value & Volume)
- 6.5. Market Analysis, Insights and Forecast - by Price Trend Analysis
- 6.1. Market Analysis, Insights and Forecast - by Production Analysis
- 7. South America US Transformer Industry Analysis, Insights and Forecast, 2019-2031
- 7.1. Market Analysis, Insights and Forecast - by Production Analysis
- 7.2. Market Analysis, Insights and Forecast - by Consumption Analysis
- 7.3. Market Analysis, Insights and Forecast - by Import Market Analysis (Value & Volume)
- 7.4. Market Analysis, Insights and Forecast - by Export Market Analysis (Value & Volume)
- 7.5. Market Analysis, Insights and Forecast - by Price Trend Analysis
- 7.1. Market Analysis, Insights and Forecast - by Production Analysis
- 8. Europe US Transformer Industry Analysis, Insights and Forecast, 2019-2031
- 8.1. Market Analysis, Insights and Forecast - by Production Analysis
- 8.2. Market Analysis, Insights and Forecast - by Consumption Analysis
- 8.3. Market Analysis, Insights and Forecast - by Import Market Analysis (Value & Volume)
- 8.4. Market Analysis, Insights and Forecast - by Export Market Analysis (Value & Volume)
- 8.5. Market Analysis, Insights and Forecast - by Price Trend Analysis
- 8.1. Market Analysis, Insights and Forecast - by Production Analysis
- 9. Middle East & Africa US Transformer Industry Analysis, Insights and Forecast, 2019-2031
- 9.1. Market Analysis, Insights and Forecast - by Production Analysis
- 9.2. Market Analysis, Insights and Forecast - by Consumption Analysis
- 9.3. Market Analysis, Insights and Forecast - by Import Market Analysis (Value & Volume)
- 9.4. Market Analysis, Insights and Forecast - by Export Market Analysis (Value & Volume)
- 9.5. Market Analysis, Insights and Forecast - by Price Trend Analysis
- 9.1. Market Analysis, Insights and Forecast - by Production Analysis
- 10. Asia Pacific US Transformer Industry Analysis, Insights and Forecast, 2019-2031
- 10.1. Market Analysis, Insights and Forecast - by Production Analysis
- 10.2. Market Analysis, Insights and Forecast - by Consumption Analysis
- 10.3. Market Analysis, Insights and Forecast - by Import Market Analysis (Value & Volume)
- 10.4. Market Analysis, Insights and Forecast - by Export Market Analysis (Value & Volume)
- 10.5. Market Analysis, Insights and Forecast - by Price Trend Analysis
- 10.1. Market Analysis, Insights and Forecast - by Production Analysis
- 11. Northeast US Transformer Industry Analysis, Insights and Forecast, 2019-2031
- 12. Southeast US Transformer Industry Analysis, Insights and Forecast, 2019-2031
- 13. Midwest US Transformer Industry Analysis, Insights and Forecast, 2019-2031
- 14. Southwest US Transformer Industry Analysis, Insights and Forecast, 2019-2031
- 15. West US Transformer Industry Analysis, Insights and Forecast, 2019-2031
- 16. Competitive Analysis
- 16.1. Global Market Share Analysis 2024
- 16.2. Company Profiles
- 16.2.1 ABB Ltd
- 16.2.1.1. Overview
- 16.2.1.2. Products
- 16.2.1.3. SWOT Analysis
- 16.2.1.4. Recent Developments
- 16.2.1.5. Financials (Based on Availability)
- 16.2.2 Toshiba Corp*List Not Exhaustive
- 16.2.2.1. Overview
- 16.2.2.2. Products
- 16.2.2.3. SWOT Analysis
- 16.2.2.4. Recent Developments
- 16.2.2.5. Financials (Based on Availability)
- 16.2.3 Hitachi Ltd
- 16.2.3.1. Overview
- 16.2.3.2. Products
- 16.2.3.3. SWOT Analysis
- 16.2.3.4. Recent Developments
- 16.2.3.5. Financials (Based on Availability)
- 16.2.4 Emerson Electric Co
- 16.2.4.1. Overview
- 16.2.4.2. Products
- 16.2.4.3. SWOT Analysis
- 16.2.4.4. Recent Developments
- 16.2.4.5. Financials (Based on Availability)
- 16.2.5 Mitsubishi Electric Corporation
- 16.2.5.1. Overview
- 16.2.5.2. Products
- 16.2.5.3. SWOT Analysis
- 16.2.5.4. Recent Developments
- 16.2.5.5. Financials (Based on Availability)
- 16.2.6 Siemens AG
- 16.2.6.1. Overview
- 16.2.6.2. Products
- 16.2.6.3. SWOT Analysis
- 16.2.6.4. Recent Developments
- 16.2.6.5. Financials (Based on Availability)
- 16.2.7 Schneider Electric SE
- 16.2.7.1. Overview
- 16.2.7.2. Products
- 16.2.7.3. SWOT Analysis
- 16.2.7.4. Recent Developments
- 16.2.7.5. Financials (Based on Availability)
- 16.2.8 Eaton Corporation PLC
- 16.2.8.1. Overview
- 16.2.8.2. Products
- 16.2.8.3. SWOT Analysis
- 16.2.8.4. Recent Developments
- 16.2.8.5. Financials (Based on Availability)
- 16.2.9 General Electric Company
- 16.2.9.1. Overview
- 16.2.9.2. Products
- 16.2.9.3. SWOT Analysis
- 16.2.9.4. Recent Developments
- 16.2.9.5. Financials (Based on Availability)
- 16.2.10 Panasonic Corporation
- 16.2.10.1. Overview
- 16.2.10.2. Products
- 16.2.10.3. SWOT Analysis
- 16.2.10.4. Recent Developments
- 16.2.10.5. Financials (Based on Availability)
- 16.2.1 ABB Ltd
List of Figures
- Figure 1: Global US Transformer Industry Revenue Breakdown (Million, %) by Region 2024 & 2032
- Figure 2: United states US Transformer Industry Revenue (Million), by Country 2024 & 2032
- Figure 3: United states US Transformer Industry Revenue Share (%), by Country 2024 & 2032
- Figure 4: North America US Transformer Industry Revenue (Million), by Production Analysis 2024 & 2032
- Figure 5: North America US Transformer Industry Revenue Share (%), by Production Analysis 2024 & 2032
- Figure 6: North America US Transformer Industry Revenue (Million), by Consumption Analysis 2024 & 2032
- Figure 7: North America US Transformer Industry Revenue Share (%), by Consumption Analysis 2024 & 2032
- Figure 8: North America US Transformer Industry Revenue (Million), by Import Market Analysis (Value & Volume) 2024 & 2032
- Figure 9: North America US Transformer Industry Revenue Share (%), by Import Market Analysis (Value & Volume) 2024 & 2032
- Figure 10: North America US Transformer Industry Revenue (Million), by Export Market Analysis (Value & Volume) 2024 & 2032
- Figure 11: North America US Transformer Industry Revenue Share (%), by Export Market Analysis (Value & Volume) 2024 & 2032
- Figure 12: North America US Transformer Industry Revenue (Million), by Price Trend Analysis 2024 & 2032
- Figure 13: North America US Transformer Industry Revenue Share (%), by Price Trend Analysis 2024 & 2032
- Figure 14: North America US Transformer Industry Revenue (Million), by Country 2024 & 2032
- Figure 15: North America US Transformer Industry Revenue Share (%), by Country 2024 & 2032
- Figure 16: South America US Transformer Industry Revenue (Million), by Production Analysis 2024 & 2032
- Figure 17: South America US Transformer Industry Revenue Share (%), by Production Analysis 2024 & 2032
- Figure 18: South America US Transformer Industry Revenue (Million), by Consumption Analysis 2024 & 2032
- Figure 19: South America US Transformer Industry Revenue Share (%), by Consumption Analysis 2024 & 2032
- Figure 20: South America US Transformer Industry Revenue (Million), by Import Market Analysis (Value & Volume) 2024 & 2032
- Figure 21: South America US Transformer Industry Revenue Share (%), by Import Market Analysis (Value & Volume) 2024 & 2032
- Figure 22: South America US Transformer Industry Revenue (Million), by Export Market Analysis (Value & Volume) 2024 & 2032
- Figure 23: South America US Transformer Industry Revenue Share (%), by Export Market Analysis (Value & Volume) 2024 & 2032
- Figure 24: South America US Transformer Industry Revenue (Million), by Price Trend Analysis 2024 & 2032
- Figure 25: South America US Transformer Industry Revenue Share (%), by Price Trend Analysis 2024 & 2032
- Figure 26: South America US Transformer Industry Revenue (Million), by Country 2024 & 2032
- Figure 27: South America US Transformer Industry Revenue Share (%), by Country 2024 & 2032
- Figure 28: Europe US Transformer Industry Revenue (Million), by Production Analysis 2024 & 2032
- Figure 29: Europe US Transformer Industry Revenue Share (%), by Production Analysis 2024 & 2032
- Figure 30: Europe US Transformer Industry Revenue (Million), by Consumption Analysis 2024 & 2032
- Figure 31: Europe US Transformer Industry Revenue Share (%), by Consumption Analysis 2024 & 2032
- Figure 32: Europe US Transformer Industry Revenue (Million), by Import Market Analysis (Value & Volume) 2024 & 2032
- Figure 33: Europe US Transformer Industry Revenue Share (%), by Import Market Analysis (Value & Volume) 2024 & 2032
- Figure 34: Europe US Transformer Industry Revenue (Million), by Export Market Analysis (Value & Volume) 2024 & 2032
- Figure 35: Europe US Transformer Industry Revenue Share (%), by Export Market Analysis (Value & Volume) 2024 & 2032
- Figure 36: Europe US Transformer Industry Revenue (Million), by Price Trend Analysis 2024 & 2032
- Figure 37: Europe US Transformer Industry Revenue Share (%), by Price Trend Analysis 2024 & 2032
- Figure 38: Europe US Transformer Industry Revenue (Million), by Country 2024 & 2032
- Figure 39: Europe US Transformer Industry Revenue Share (%), by Country 2024 & 2032
- Figure 40: Middle East & Africa US Transformer Industry Revenue (Million), by Production Analysis 2024 & 2032
- Figure 41: Middle East & Africa US Transformer Industry Revenue Share (%), by Production Analysis 2024 & 2032
- Figure 42: Middle East & Africa US Transformer Industry Revenue (Million), by Consumption Analysis 2024 & 2032
- Figure 43: Middle East & Africa US Transformer Industry Revenue Share (%), by Consumption Analysis 2024 & 2032
- Figure 44: Middle East & Africa US Transformer Industry Revenue (Million), by Import Market Analysis (Value & Volume) 2024 & 2032
- Figure 45: Middle East & Africa US Transformer Industry Revenue Share (%), by Import Market Analysis (Value & Volume) 2024 & 2032
- Figure 46: Middle East & Africa US Transformer Industry Revenue (Million), by Export Market Analysis (Value & Volume) 2024 & 2032
- Figure 47: Middle East & Africa US Transformer Industry Revenue Share (%), by Export Market Analysis (Value & Volume) 2024 & 2032
- Figure 48: Middle East & Africa US Transformer Industry Revenue (Million), by Price Trend Analysis 2024 & 2032
- Figure 49: Middle East & Africa US Transformer Industry Revenue Share (%), by Price Trend Analysis 2024 & 2032
- Figure 50: Middle East & Africa US Transformer Industry Revenue (Million), by Country 2024 & 2032
- Figure 51: Middle East & Africa US Transformer Industry Revenue Share (%), by Country 2024 & 2032
- Figure 52: Asia Pacific US Transformer Industry Revenue (Million), by Production Analysis 2024 & 2032
- Figure 53: Asia Pacific US Transformer Industry Revenue Share (%), by Production Analysis 2024 & 2032
- Figure 54: Asia Pacific US Transformer Industry Revenue (Million), by Consumption Analysis 2024 & 2032
- Figure 55: Asia Pacific US Transformer Industry Revenue Share (%), by Consumption Analysis 2024 & 2032
- Figure 56: Asia Pacific US Transformer Industry Revenue (Million), by Import Market Analysis (Value & Volume) 2024 & 2032
- Figure 57: Asia Pacific US Transformer Industry Revenue Share (%), by Import Market Analysis (Value & Volume) 2024 & 2032
- Figure 58: Asia Pacific US Transformer Industry Revenue (Million), by Export Market Analysis (Value & Volume) 2024 & 2032
- Figure 59: Asia Pacific US Transformer Industry Revenue Share (%), by Export Market Analysis (Value & Volume) 2024 & 2032
- Figure 60: Asia Pacific US Transformer Industry Revenue (Million), by Price Trend Analysis 2024 & 2032
- Figure 61: Asia Pacific US Transformer Industry Revenue Share (%), by Price Trend Analysis 2024 & 2032
- Figure 62: Asia Pacific US Transformer Industry Revenue (Million), by Country 2024 & 2032
- Figure 63: Asia Pacific US Transformer Industry Revenue Share (%), by Country 2024 & 2032
List of Tables
- Table 1: Global US Transformer Industry Revenue Million Forecast, by Region 2019 & 2032
- Table 2: Global US Transformer Industry Revenue Million Forecast, by Production Analysis 2019 & 2032
- Table 3: Global US Transformer Industry Revenue Million Forecast, by Consumption Analysis 2019 & 2032
- Table 4: Global US Transformer Industry Revenue Million Forecast, by Import Market Analysis (Value & Volume) 2019 & 2032
- Table 5: Global US Transformer Industry Revenue Million Forecast, by Export Market Analysis (Value & Volume) 2019 & 2032
- Table 6: Global US Transformer Industry Revenue Million Forecast, by Price Trend Analysis 2019 & 2032
- Table 7: Global US Transformer Industry Revenue Million Forecast, by Region 2019 & 2032
- Table 8: Global US Transformer Industry Revenue Million Forecast, by Country 2019 & 2032
- Table 9: Northeast US Transformer Industry Revenue (Million) Forecast, by Application 2019 & 2032
- Table 10: Southeast US Transformer Industry Revenue (Million) Forecast, by Application 2019 & 2032
- Table 11: Midwest US Transformer Industry Revenue (Million) Forecast, by Application 2019 & 2032
- Table 12: Southwest US Transformer Industry Revenue (Million) Forecast, by Application 2019 & 2032
- Table 13: West US Transformer Industry Revenue (Million) Forecast, by Application 2019 & 2032
- Table 14: Global US Transformer Industry Revenue Million Forecast, by Production Analysis 2019 & 2032
- Table 15: Global US Transformer Industry Revenue Million Forecast, by Consumption Analysis 2019 & 2032
- Table 16: Global US Transformer Industry Revenue Million Forecast, by Import Market Analysis (Value & Volume) 2019 & 2032
- Table 17: Global US Transformer Industry Revenue Million Forecast, by Export Market Analysis (Value & Volume) 2019 & 2032
- Table 18: Global US Transformer Industry Revenue Million Forecast, by Price Trend Analysis 2019 & 2032
- Table 19: Global US Transformer Industry Revenue Million Forecast, by Country 2019 & 2032
- Table 20: United States US Transformer Industry Revenue (Million) Forecast, by Application 2019 & 2032
- Table 21: Canada US Transformer Industry Revenue (Million) Forecast, by Application 2019 & 2032
- Table 22: Mexico US Transformer Industry Revenue (Million) Forecast, by Application 2019 & 2032
- Table 23: Global US Transformer Industry Revenue Million Forecast, by Production Analysis 2019 & 2032
- Table 24: Global US Transformer Industry Revenue Million Forecast, by Consumption Analysis 2019 & 2032
- Table 25: Global US Transformer Industry Revenue Million Forecast, by Import Market Analysis (Value & Volume) 2019 & 2032
- Table 26: Global US Transformer Industry Revenue Million Forecast, by Export Market Analysis (Value & Volume) 2019 & 2032
- Table 27: Global US Transformer Industry Revenue Million Forecast, by Price Trend Analysis 2019 & 2032
- Table 28: Global US Transformer Industry Revenue Million Forecast, by Country 2019 & 2032
- Table 29: Brazil US Transformer Industry Revenue (Million) Forecast, by Application 2019 & 2032
- Table 30: Argentina US Transformer Industry Revenue (Million) Forecast, by Application 2019 & 2032
- Table 31: Rest of South America US Transformer Industry Revenue (Million) Forecast, by Application 2019 & 2032
- Table 32: Global US Transformer Industry Revenue Million Forecast, by Production Analysis 2019 & 2032
- Table 33: Global US Transformer Industry Revenue Million Forecast, by Consumption Analysis 2019 & 2032
- Table 34: Global US Transformer Industry Revenue Million Forecast, by Import Market Analysis (Value & Volume) 2019 & 2032
- Table 35: Global US Transformer Industry Revenue Million Forecast, by Export Market Analysis (Value & Volume) 2019 & 2032
- Table 36: Global US Transformer Industry Revenue Million Forecast, by Price Trend Analysis 2019 & 2032
- Table 37: Global US Transformer Industry Revenue Million Forecast, by Country 2019 & 2032
- Table 38: United Kingdom US Transformer Industry Revenue (Million) Forecast, by Application 2019 & 2032
- Table 39: Germany US Transformer Industry Revenue (Million) Forecast, by Application 2019 & 2032
- Table 40: France US Transformer Industry Revenue (Million) Forecast, by Application 2019 & 2032
- Table 41: Italy US Transformer Industry Revenue (Million) Forecast, by Application 2019 & 2032
- Table 42: Spain US Transformer Industry Revenue (Million) Forecast, by Application 2019 & 2032
- Table 43: Russia US Transformer Industry Revenue (Million) Forecast, by Application 2019 & 2032
- Table 44: Benelux US Transformer Industry Revenue (Million) Forecast, by Application 2019 & 2032
- Table 45: Nordics US Transformer Industry Revenue (Million) Forecast, by Application 2019 & 2032
- Table 46: Rest of Europe US Transformer Industry Revenue (Million) Forecast, by Application 2019 & 2032
- Table 47: Global US Transformer Industry Revenue Million Forecast, by Production Analysis 2019 & 2032
- Table 48: Global US Transformer Industry Revenue Million Forecast, by Consumption Analysis 2019 & 2032
- Table 49: Global US Transformer Industry Revenue Million Forecast, by Import Market Analysis (Value & Volume) 2019 & 2032
- Table 50: Global US Transformer Industry Revenue Million Forecast, by Export Market Analysis (Value & Volume) 2019 & 2032
- Table 51: Global US Transformer Industry Revenue Million Forecast, by Price Trend Analysis 2019 & 2032
- Table 52: Global US Transformer Industry Revenue Million Forecast, by Country 2019 & 2032
- Table 53: Turkey US Transformer Industry Revenue (Million) Forecast, by Application 2019 & 2032
- Table 54: Israel US Transformer Industry Revenue (Million) Forecast, by Application 2019 & 2032
- Table 55: GCC US Transformer Industry Revenue (Million) Forecast, by Application 2019 & 2032
- Table 56: North Africa US Transformer Industry Revenue (Million) Forecast, by Application 2019 & 2032
- Table 57: South Africa US Transformer Industry Revenue (Million) Forecast, by Application 2019 & 2032
- Table 58: Rest of Middle East & Africa US Transformer Industry Revenue (Million) Forecast, by Application 2019 & 2032
- Table 59: Global US Transformer Industry Revenue Million Forecast, by Production Analysis 2019 & 2032
- Table 60: Global US Transformer Industry Revenue Million Forecast, by Consumption Analysis 2019 & 2032
- Table 61: Global US Transformer Industry Revenue Million Forecast, by Import Market Analysis (Value & Volume) 2019 & 2032
- Table 62: Global US Transformer Industry Revenue Million Forecast, by Export Market Analysis (Value & Volume) 2019 & 2032
- Table 63: Global US Transformer Industry Revenue Million Forecast, by Price Trend Analysis 2019 & 2032
- Table 64: Global US Transformer Industry Revenue Million Forecast, by Country 2019 & 2032
- Table 65: China US Transformer Industry Revenue (Million) Forecast, by Application 2019 & 2032
- Table 66: India US Transformer Industry Revenue (Million) Forecast, by Application 2019 & 2032
- Table 67: Japan US Transformer Industry Revenue (Million) Forecast, by Application 2019 & 2032
- Table 68: South Korea US Transformer Industry Revenue (Million) Forecast, by Application 2019 & 2032
- Table 69: ASEAN US Transformer Industry Revenue (Million) Forecast, by Application 2019 & 2032
- Table 70: Oceania US Transformer Industry Revenue (Million) Forecast, by Application 2019 & 2032
- Table 71: Rest of Asia Pacific US Transformer Industry Revenue (Million) Forecast, by Application 2019 & 2032
Frequently Asked Questions
1. What is the projected Compound Annual Growth Rate (CAGR) of the US Transformer Industry?
The projected CAGR is approximately > 3.00%.
2. Which companies are prominent players in the US Transformer Industry?
Key companies in the market include ABB Ltd, Toshiba Corp*List Not Exhaustive, Hitachi Ltd, Emerson Electric Co, Mitsubishi Electric Corporation, Siemens AG, Schneider Electric SE, Eaton Corporation PLC, General Electric Company, Panasonic Corporation.
3. What are the main segments of the US Transformer Industry?
The market segments include Production Analysis, Consumption Analysis, Import Market Analysis (Value & Volume), Export Market Analysis (Value & Volume), Price Trend Analysis.
4. Can you provide details about the market size?
The market size is estimated to be USD 32.11 Million as of 2022.
5. What are some drivers contributing to market growth?
4.; Increasing Natural Gas Demand4.; Rising Pipeline Network and Associated Infrastructure Development.
6. What are the notable trends driving market growth?
Distribution Transformer Expected to Dominate the Market.
7. Are there any restraints impacting market growth?
4.; Rising Shift toward Renewable Energy.
8. Can you provide examples of recent developments in the market?
December 2022: Hitachi Energy announced plans to invest more than USD 37 million in the expansion and modernization of its power transformer manufacturing facility in South Boston, Virginia, to meet rapidly growing demand from utility customers and for applications such as renewable energy generation and data centers.
9. What pricing options are available for accessing the report?
Pricing options include single-user, multi-user, and enterprise licenses priced at USD 3800, USD 4500, and USD 5800 respectively.
10. Is the market size provided in terms of value or volume?
The market size is provided in terms of value, measured in Million.
11. Are there any specific market keywords associated with the report?
Yes, the market keyword associated with the report is "US Transformer Industry," which aids in identifying and referencing the specific market segment covered.
12. How do I determine which pricing option suits my needs best?
The pricing options vary based on user requirements and access needs. Individual users may opt for single-user licenses, while businesses requiring broader access may choose multi-user or enterprise licenses for cost-effective access to the report.
13. Are there any additional resources or data provided in the US Transformer Industry report?
While the report offers comprehensive insights, it's advisable to review the specific contents or supplementary materials provided to ascertain if additional resources or data are available.
14. How can I stay updated on further developments or reports in the US Transformer Industry?
To stay informed about further developments, trends, and reports in the US Transformer Industry, consider subscribing to industry newsletters, following relevant companies and organizations, or regularly checking reputable industry news sources and publications.
Methodology
Step 1 - Identification of Relevant Samples Size from Population Database


Step 2 - Approaches for Defining Global Market Size (Value, Volume* & Price*)

Note*: In applicable scenarios
Step 3 - Data Sources
Primary Research
- Web Analytics
- Survey Reports
- Research Institute
- Latest Research Reports
- Opinion Leaders
Secondary Research
- Annual Reports
- White Paper
- Latest Press Release
- Industry Association
- Paid Database
- Investor Presentations

Step 4 - Data Triangulation
Involves using different sources of information in order to increase the validity of a study
These sources are likely to be stakeholders in a program - participants, other researchers, program staff, other community members, and so on.
Then we put all data in single framework & apply various statistical tools to find out the dynamic on the market.
During the analysis stage, feedback from the stakeholder groups would be compared to determine areas of agreement as well as areas of divergence
