

Key Insights
The U.S. soft drinks packaging market is poised for substantial expansion, driven by the escalating demand for convenient, on-the-go beverage consumption. The market, valued at $26.86 billion in 2025, is projected to achieve a Compound Annual Growth Rate (CAGR) of 4.4% between 2025 and 2033. Key growth catalysts include the rising popularity of ready-to-drink (RTD) beverages, a growing consumer preference for single-serve packaging for hygiene and portion control, and the increasing adoption of sustainable materials like recycled plastics and paperboard. The trend towards healthier beverage options, such as juices and sports drinks, further fuels growth across specific packaging segments. However, the industry navigates challenges including volatile raw material costs, stringent environmental regulations aimed at reducing plastic waste, and continuous consumer demand for innovative and functional packaging. Major players, including WestRock, Ball Corporation, and Amcor, are actively investing in research and development to address these evolving market needs. The Southwest and West regions are anticipated to lead growth due to higher population densities and robust consumer spending.
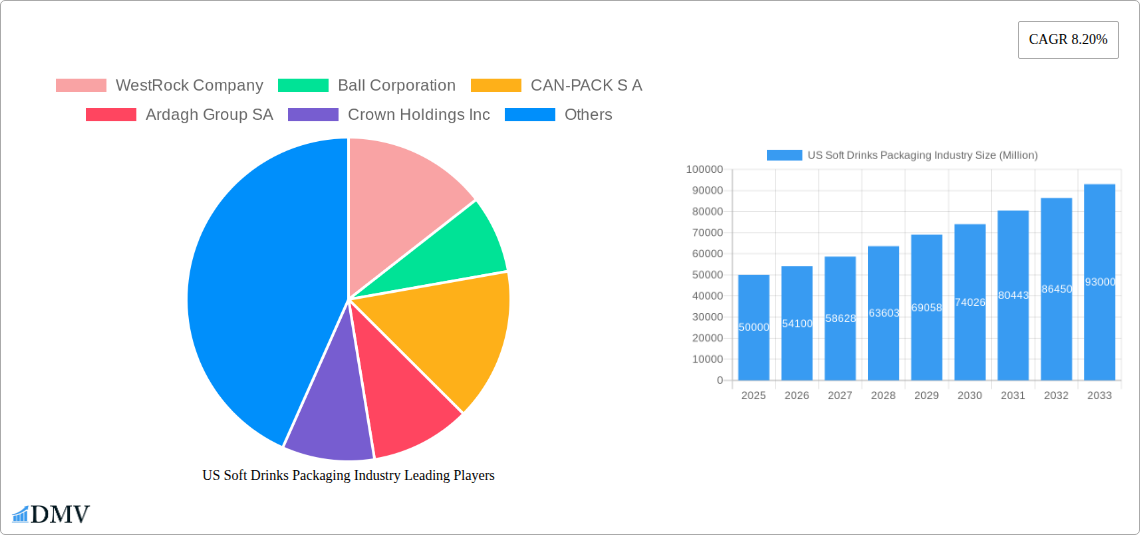
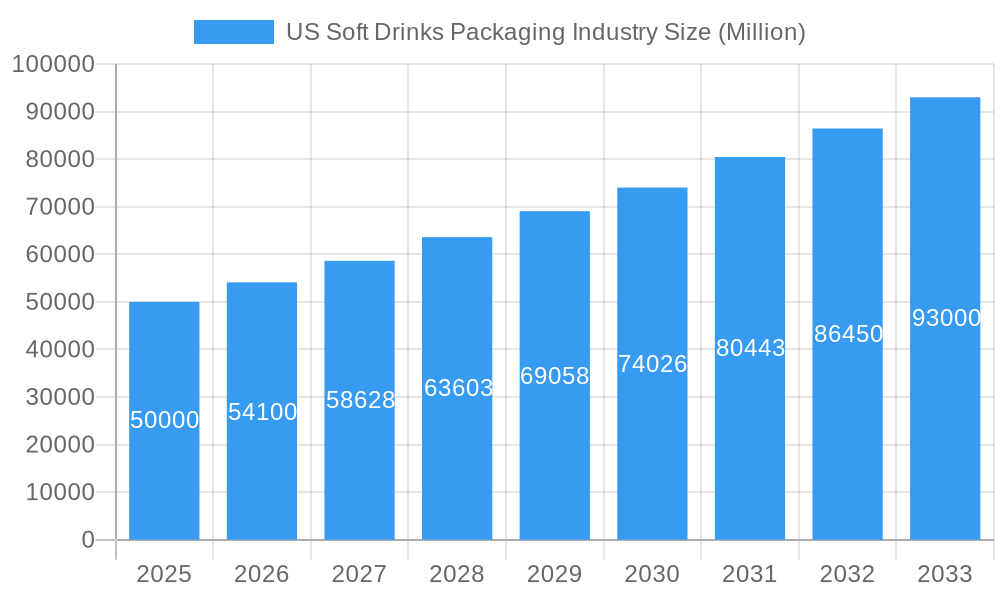
US Soft Drinks Packaging Industry Market Size (In Billion)
Market segmentation highlights significant trends within the U.S. soft drinks packaging industry. While plastic remains a dominant material due to its cost-effectiveness and versatility, its market share is gradually declining amid growing environmental concerns. Conversely, paper and paperboard, glass, and metal packaging are gaining prominence, attributed to their perceived sustainability advantages and premium appeal. Bottled water and carbonated beverages are consistent drivers, yet the growth of RTD beverages and sports drinks significantly influences packaging choices toward more convenient and functional formats. Furthermore, the increasing demand for premiumization and personalized packaging experiences shapes consumer decisions, encouraging manufacturers to pursue innovative designs and materials. Navigating regulatory frameworks, mitigating supply chain disruptions, and prioritizing sustainable practices are critical for success in this dynamic market.
US Soft Drinks Packaging Industry Company Market Share
US Soft Drinks Packaging Industry: A Comprehensive Market Report (2019-2033)
This insightful report provides a detailed analysis of the US soft drinks packaging industry, encompassing market size, segmentation, competitive landscape, and future growth projections. With a study period spanning 2019-2033, a base year of 2025, and a forecast period of 2025-2033, this report is an indispensable resource for stakeholders seeking to understand and capitalize on opportunities within this dynamic sector. The market value in 2025 is estimated at $xx Million.
US Soft Drinks Packaging Industry Market Composition & Trends
The US soft drinks packaging market is a complex ecosystem characterized by moderate concentration, with several major players holding significant market share. WestRock Company, Ball Corporation, and Crown Holdings Inc. are among the leading players, collectively accounting for an estimated xx% of the market in 2025. However, the presence of numerous smaller players contributes to a competitive landscape. Market share distribution is heavily influenced by packaging material preferences, with plastic currently dominating, but significant shifts are occurring due to sustainability concerns and regulatory pressures. Innovation is driven by the demand for lightweight, sustainable, and aesthetically appealing packaging solutions. The regulatory landscape is constantly evolving, with increasing focus on recyclability and reduction of plastic waste, shaping packaging material choices and manufacturing processes. Substitute products, such as reusable containers and alternative beverage delivery systems, pose a growing threat to traditional packaging. End-users range from large multinational beverage companies to smaller regional players. M&A activity has been significant, with deal values exceeding $xx Million in the past five years, signifying industry consolidation and strategic expansion.
- Market Concentration: Moderately concentrated, with top 3 players holding xx% market share in 2025.
- Innovation Catalysts: Sustainability concerns, consumer preferences for convenience, and brand differentiation.
- Regulatory Landscape: Increasing focus on recyclability and reduced plastic waste.
- Substitute Products: Reusable containers, alternative delivery systems (e.g., tap systems).
- End-User Profile: Multinational beverage corporations, regional players, and private label brands.
- M&A Activity: Significant, with total deal values exceeding $xx Million (2019-2024).
US Soft Drinks Packaging Industry Evolution
The US soft drinks packaging industry has witnessed substantial evolution over the historical period (2019-2024), driven by several key factors. Market growth has averaged xx% annually, with fluctuations influenced by economic conditions and consumer spending patterns. Technological advancements, such as lightweighting technologies, improved barrier properties, and advanced printing techniques, have significantly impacted packaging design and production efficiency. The industry has responded to shifting consumer demands for sustainable and convenient packaging, leading to an increased adoption of recycled materials and eco-friendly designs. The growth in the bottled water segment has particularly boosted demand for plastic bottles, while the increasing popularity of RTD beverages has fueled the demand for a variety of packaging formats, including cans and flexible pouches.
Leading Regions, Countries, or Segments in US Soft Drinks Packaging Industry
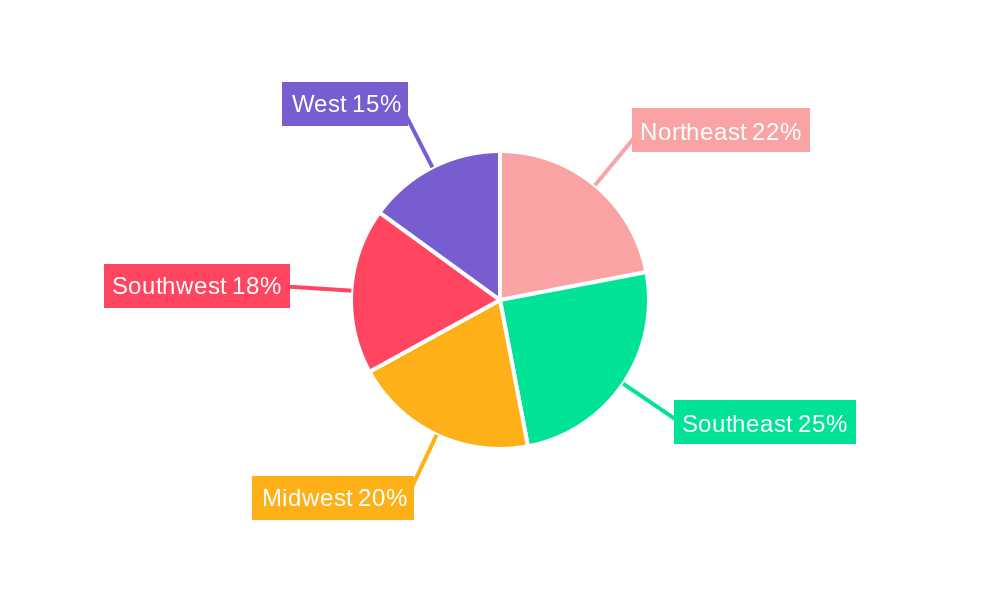
The US soft drinks packaging market is geographically diverse, with significant variations in consumption patterns and packaging preferences across regions. However, specific regional data is unavailable.
By Packaging Material Type:
- Plastic: Remains the dominant segment driven by cost-effectiveness and ease of use. Key driver: Lower manufacturing costs.
- Paper & Paperboard: Growth is spurred by increased sustainability concerns and regulatory pressures. Key driver: Growing demand for eco-friendly options.
- Glass: Maintains a significant share in premium segments. Key driver: Perceived quality and brand image.
- Metal: Strong demand in carbonated drinks and energy drinks. Key driver: Durability and protective properties.
- Other Materials: Niche applications with potential for future growth.
By Product Type:
- Bottled Water: Significant growth driver due to health and wellness trends. Key driver: Increased consumption.
- Carbonated Drinks: A large segment, influenced by fluctuating consumer preferences. Key driver: Market stability, despite shifts in taste.
- Juices: Growing demand, supported by health-conscious consumers. Key driver: Emphasis on natural and healthy products.
- RTD Beverages: Rapid growth due to convenience and variety. Key driver: Growing preference for ready-to-drink formats.
- Sports Drinks: Market growth is influenced by fitness trends. Key driver: Popularity among active individuals.
- Other Products: Includes a variety of beverages with varied packaging demands.
US Soft Drinks Packaging Industry Product Innovations
Recent innovations focus on enhanced sustainability, improved barrier properties, and lighter weight designs. Amcor's AmPrima line, launched in June 2021, exemplifies this trend with its ultra-clear, heat-resistant, and recyclable films produced at unmatched speeds. Other innovations include the use of bio-based materials, improved recyclability through design modifications, and the integration of smart packaging technologies for enhanced product traceability and consumer engagement. These innovations aim to address consumer demand for environmentally friendly and convenient packaging while maintaining product quality and shelf life.
Propelling Factors for US Soft Drinks Packaging Industry Growth
Several factors are driving growth in the US soft drinks packaging market. Technological advancements, such as lightweighting and improved barrier technologies, enhance efficiency and reduce costs. Economic factors, such as increasing disposable incomes and consumer spending on beverages, fuel demand. Government regulations promoting sustainability and recyclability encourage the adoption of eco-friendly packaging materials. The growing preference for convenience and on-the-go consumption continues to drive demand for single-serve packaging options.
Obstacles in the US Soft Drinks Packaging Industry Market
The industry faces challenges including fluctuating raw material prices, impacting production costs. Supply chain disruptions, particularly in the wake of global events, can lead to production delays and shortages. Intense competition from both established and new players necessitates continuous innovation and cost optimization. Stringent environmental regulations and consumer pressure for sustainability create challenges in balancing cost-effectiveness with eco-friendly practices.
Future Opportunities in US Soft Drinks Packaging Industry
The US soft drinks packaging market presents several promising opportunities. Growth is anticipated in sustainable packaging solutions made from recycled and renewable materials. The adoption of smart packaging technologies offering enhanced consumer interaction and traceability offers potential for premiumization and brand differentiation. Expansion into emerging beverage segments, such as functional beverages and plant-based drinks, is likely to drive demand for innovative packaging formats.
Major Players in the US Soft Drinks Packaging Industry Ecosystem
- WestRock Company
- Ball Corporation
- CAN-PACK S A
- Ardagh Group SA
- Crown Holdings Inc
- Graham Packaging Company
- Tetra Pak International
- Toyo Seikan Group Holdings Ltd
- Placon Corporation
- Sealed Air Corporation
- Owens-Illinois Inc
- Refresco Group NV
- Amcor Ltd
Key Developments in US Soft Drinks Packaging Industry Industry
- June 2021: Amcor launched the AmPrima line of ultra-clear and heat-resistant films, leveraging machine-direction orientation technology for high-speed production and recyclability. This significantly enhanced the speed and efficiency of film production within the recycle-ready packaging market.
Strategic US Soft Drinks Packaging Industry Market Forecast
The US soft drinks packaging market is poised for continued growth, driven by factors including technological innovation, sustainability concerns, and evolving consumer preferences. Opportunities in sustainable and smart packaging are expected to drive future growth, as companies seek to meet the growing demand for eco-friendly and convenient packaging solutions. The market is anticipated to continue its expansion in the coming years, although the exact growth rate will be contingent upon economic conditions and prevailing consumer behavior.
US Soft Drinks Packaging Industry Segmentation
-
1. Packaging Material Type
- 1.1. Plastic
- 1.2. Paper & Paperboard
- 1.3. Glass
- 1.4. Metal
- 1.5. Other Materials
-
2. Product Type
- 2.1. Bottled Water
- 2.2. Carbonated Drinks
- 2.3. Juices
- 2.4. RTD Beverages
- 2.5. Sports Drink
- 2.6. Other Products
US Soft Drinks Packaging Industry Segmentation By Geography
-
1. North America
- 1.1. United States
- 1.2. Canada
- 1.3. Mexico
-
2. South America
- 2.1. Brazil
- 2.2. Argentina
- 2.3. Rest of South America
-
3. Europe
- 3.1. United Kingdom
- 3.2. Germany
- 3.3. France
- 3.4. Italy
- 3.5. Spain
- 3.6. Russia
- 3.7. Benelux
- 3.8. Nordics
- 3.9. Rest of Europe
-
4. Middle East & Africa
- 4.1. Turkey
- 4.2. Israel
- 4.3. GCC
- 4.4. North Africa
- 4.5. South Africa
- 4.6. Rest of Middle East & Africa
-
5. Asia Pacific
- 5.1. China
- 5.2. India
- 5.3. Japan
- 5.4. South Korea
- 5.5. ASEAN
- 5.6. Oceania
- 5.7. Rest of Asia Pacific
US Soft Drinks Packaging Industry Regional Market Share
Geographic Coverage of US Soft Drinks Packaging Industry
US Soft Drinks Packaging Industry REPORT HIGHLIGHTS
| Aspects | Details |
|---|---|
| Study Period | 2020-2034 |
| Base Year | 2025 |
| Estimated Year | 2026 |
| Forecast Period | 2026-2034 |
| Historical Period | 2020-2025 |
| Growth Rate | CAGR of 4.4% from 2020-2034 |
| Segmentation |
|
Table of Contents
- 1. Introduction
- 1.1. Research Scope
- 1.2. Market Segmentation
- 1.3. Research Objective
- 1.4. Definitions and Assumptions
- 2. Executive Summary
- 2.1. Market Snapshot
- 3. Market Dynamics
- 3.1. Market Drivers
- 3.2. Market Restrains
- 3.3. Market Trends
- 3.4. Market Opportunities
- 4. Market Factor Analysis
- 4.1. Porters Five Forces
- 4.1.1. Bargaining Power of Suppliers
- 4.1.2. Bargaining Power of Buyers
- 4.1.3. Threat of New Entrants
- 4.1.4. Threat of Substitutes
- 4.1.5. Competitive Rivalry
- 4.2. PESTEL analysis
- 4.3. BCG Analysis
- 4.3.1. Stars (High Growth, High Market Share)
- 4.3.2. Cash Cows (Low Growth, High Market Share)
- 4.3.3. Question Mark (High Growth, Low Market Share)
- 4.3.4. Dogs (Low Growth, Low Market Share)
- 4.4. Ansoff Matrix Analysis
- 4.5. Supply Chain Analysis
- 4.6. Regulatory Landscape
- 4.7. Current Market Potential and Opportunity Assessment (TAM–SAM–SOM Framework)
- 4.8. DMV Analyst Note
- 4.1. Porters Five Forces
- 5. Market Analysis, Insights and Forecast 2021-2033
- 5.1. Market Analysis, Insights and Forecast - by Packaging Material Type
- 5.1.1. Plastic
- 5.1.2. Paper & Paperboard
- 5.1.3. Glass
- 5.1.4. Metal
- 5.1.5. Other Materials
- 5.2. Market Analysis, Insights and Forecast - by Product Type
- 5.2.1. Bottled Water
- 5.2.2. Carbonated Drinks
- 5.2.3. Juices
- 5.2.4. RTD Beverages
- 5.2.5. Sports Drink
- 5.2.6. Other Products
- 5.3. Market Analysis, Insights and Forecast - by Region
- 5.3.1. North America
- 5.3.2. South America
- 5.3.3. Europe
- 5.3.4. Middle East & Africa
- 5.3.5. Asia Pacific
- 5.1. Market Analysis, Insights and Forecast - by Packaging Material Type
- 6. Global US Soft Drinks Packaging Industry Analysis, Insights and Forecast, 2021-2033
- 6.1. Market Analysis, Insights and Forecast - by Packaging Material Type
- 6.1.1. Plastic
- 6.1.2. Paper & Paperboard
- 6.1.3. Glass
- 6.1.4. Metal
- 6.1.5. Other Materials
- 6.2. Market Analysis, Insights and Forecast - by Product Type
- 6.2.1. Bottled Water
- 6.2.2. Carbonated Drinks
- 6.2.3. Juices
- 6.2.4. RTD Beverages
- 6.2.5. Sports Drink
- 6.2.6. Other Products
- 6.1. Market Analysis, Insights and Forecast - by Packaging Material Type
- 7. North America US Soft Drinks Packaging Industry Analysis, Insights and Forecast, 2020-2032
- 7.1. Market Analysis, Insights and Forecast - by Packaging Material Type
- 7.1.1. Plastic
- 7.1.2. Paper & Paperboard
- 7.1.3. Glass
- 7.1.4. Metal
- 7.1.5. Other Materials
- 7.2. Market Analysis, Insights and Forecast - by Product Type
- 7.2.1. Bottled Water
- 7.2.2. Carbonated Drinks
- 7.2.3. Juices
- 7.2.4. RTD Beverages
- 7.2.5. Sports Drink
- 7.2.6. Other Products
- 7.1. Market Analysis, Insights and Forecast - by Packaging Material Type
- 8. South America US Soft Drinks Packaging Industry Analysis, Insights and Forecast, 2020-2032
- 8.1. Market Analysis, Insights and Forecast - by Packaging Material Type
- 8.1.1. Plastic
- 8.1.2. Paper & Paperboard
- 8.1.3. Glass
- 8.1.4. Metal
- 8.1.5. Other Materials
- 8.2. Market Analysis, Insights and Forecast - by Product Type
- 8.2.1. Bottled Water
- 8.2.2. Carbonated Drinks
- 8.2.3. Juices
- 8.2.4. RTD Beverages
- 8.2.5. Sports Drink
- 8.2.6. Other Products
- 8.1. Market Analysis, Insights and Forecast - by Packaging Material Type
- 9. Europe US Soft Drinks Packaging Industry Analysis, Insights and Forecast, 2020-2032
- 9.1. Market Analysis, Insights and Forecast - by Packaging Material Type
- 9.1.1. Plastic
- 9.1.2. Paper & Paperboard
- 9.1.3. Glass
- 9.1.4. Metal
- 9.1.5. Other Materials
- 9.2. Market Analysis, Insights and Forecast - by Product Type
- 9.2.1. Bottled Water
- 9.2.2. Carbonated Drinks
- 9.2.3. Juices
- 9.2.4. RTD Beverages
- 9.2.5. Sports Drink
- 9.2.6. Other Products
- 9.1. Market Analysis, Insights and Forecast - by Packaging Material Type
- 10. Middle East & Africa US Soft Drinks Packaging Industry Analysis, Insights and Forecast, 2020-2032
- 10.1. Market Analysis, Insights and Forecast - by Packaging Material Type
- 10.1.1. Plastic
- 10.1.2. Paper & Paperboard
- 10.1.3. Glass
- 10.1.4. Metal
- 10.1.5. Other Materials
- 10.2. Market Analysis, Insights and Forecast - by Product Type
- 10.2.1. Bottled Water
- 10.2.2. Carbonated Drinks
- 10.2.3. Juices
- 10.2.4. RTD Beverages
- 10.2.5. Sports Drink
- 10.2.6. Other Products
- 10.1. Market Analysis, Insights and Forecast - by Packaging Material Type
- 11. Asia Pacific US Soft Drinks Packaging Industry Analysis, Insights and Forecast, 2020-2032
- 11.1. Market Analysis, Insights and Forecast - by Packaging Material Type
- 11.1.1. Plastic
- 11.1.2. Paper & Paperboard
- 11.1.3. Glass
- 11.1.4. Metal
- 11.1.5. Other Materials
- 11.2. Market Analysis, Insights and Forecast - by Product Type
- 11.2.1. Bottled Water
- 11.2.2. Carbonated Drinks
- 11.2.3. Juices
- 11.2.4. RTD Beverages
- 11.2.5. Sports Drink
- 11.2.6. Other Products
- 11.1. Market Analysis, Insights and Forecast - by Packaging Material Type
- 12. Competitive Analysis
- 12.1. Company Profiles
- 12.1.1 WestRock Company
- 12.1.1.1. Company Overview
- 12.1.1.2. Products
- 12.1.1.3. Company Financials
- 12.1.1.4. SWOT Analysis
- 12.1.2 Ball Corporation
- 12.1.2.1. Company Overview
- 12.1.2.2. Products
- 12.1.2.3. Company Financials
- 12.1.2.4. SWOT Analysis
- 12.1.3 CAN-PACK S A
- 12.1.3.1. Company Overview
- 12.1.3.2. Products
- 12.1.3.3. Company Financials
- 12.1.3.4. SWOT Analysis
- 12.1.4 Ardagh Group SA
- 12.1.4.1. Company Overview
- 12.1.4.2. Products
- 12.1.4.3. Company Financials
- 12.1.4.4. SWOT Analysis
- 12.1.5 Crown Holdings Inc
- 12.1.5.1. Company Overview
- 12.1.5.2. Products
- 12.1.5.3. Company Financials
- 12.1.5.4. SWOT Analysis
- 12.1.6 Graham Packaging Company
- 12.1.6.1. Company Overview
- 12.1.6.2. Products
- 12.1.6.3. Company Financials
- 12.1.6.4. SWOT Analysis
- 12.1.7 Tetra Pak International
- 12.1.7.1. Company Overview
- 12.1.7.2. Products
- 12.1.7.3. Company Financials
- 12.1.7.4. SWOT Analysis
- 12.1.8 Toyo Seikan Group Holdings Ltd
- 12.1.8.1. Company Overview
- 12.1.8.2. Products
- 12.1.8.3. Company Financials
- 12.1.8.4. SWOT Analysis
- 12.1.9 Placon Corporation
- 12.1.9.1. Company Overview
- 12.1.9.2. Products
- 12.1.9.3. Company Financials
- 12.1.9.4. SWOT Analysis
- 12.1.10 Sealed Air Corporation
- 12.1.10.1. Company Overview
- 12.1.10.2. Products
- 12.1.10.3. Company Financials
- 12.1.10.4. SWOT Analysis
- 12.1.11 Owens-Illinois Inc
- 12.1.11.1. Company Overview
- 12.1.11.2. Products
- 12.1.11.3. Company Financials
- 12.1.11.4. SWOT Analysis
- 12.1.12 Refresco Group NV
- 12.1.12.1. Company Overview
- 12.1.12.2. Products
- 12.1.12.3. Company Financials
- 12.1.12.4. SWOT Analysis
- 12.1.13 Amcor Ltd
- 12.1.13.1. Company Overview
- 12.1.13.2. Products
- 12.1.13.3. Company Financials
- 12.1.13.4. SWOT Analysis
- 12.1.1 WestRock Company
- 12.2. Market Entropy
- 12.2.1 Company's Key Areas Served
- 12.2.2 Recent Developments
- 12.3. Company Market Share Analysis 2025
- 12.3.1 Top 5 Companies Market Share Analysis
- 12.3.2 Top 3 Companies Market Share Analysis
- 12.4. List of Potential Customers
- 13. Research Methodology
List of Figures
- Figure 1: Global US Soft Drinks Packaging Industry Revenue Breakdown (billion, %) by Region 2025 & 2033
- Figure 2: North America US Soft Drinks Packaging Industry Revenue (billion), by Packaging Material Type 2025 & 2033
- Figure 3: North America US Soft Drinks Packaging Industry Revenue Share (%), by Packaging Material Type 2025 & 2033
- Figure 4: North America US Soft Drinks Packaging Industry Revenue (billion), by Product Type 2025 & 2033
- Figure 5: North America US Soft Drinks Packaging Industry Revenue Share (%), by Product Type 2025 & 2033
- Figure 6: North America US Soft Drinks Packaging Industry Revenue (billion), by Country 2025 & 2033
- Figure 7: North America US Soft Drinks Packaging Industry Revenue Share (%), by Country 2025 & 2033
- Figure 8: South America US Soft Drinks Packaging Industry Revenue (billion), by Packaging Material Type 2025 & 2033
- Figure 9: South America US Soft Drinks Packaging Industry Revenue Share (%), by Packaging Material Type 2025 & 2033
- Figure 10: South America US Soft Drinks Packaging Industry Revenue (billion), by Product Type 2025 & 2033
- Figure 11: South America US Soft Drinks Packaging Industry Revenue Share (%), by Product Type 2025 & 2033
- Figure 12: South America US Soft Drinks Packaging Industry Revenue (billion), by Country 2025 & 2033
- Figure 13: South America US Soft Drinks Packaging Industry Revenue Share (%), by Country 2025 & 2033
- Figure 14: Europe US Soft Drinks Packaging Industry Revenue (billion), by Packaging Material Type 2025 & 2033
- Figure 15: Europe US Soft Drinks Packaging Industry Revenue Share (%), by Packaging Material Type 2025 & 2033
- Figure 16: Europe US Soft Drinks Packaging Industry Revenue (billion), by Product Type 2025 & 2033
- Figure 17: Europe US Soft Drinks Packaging Industry Revenue Share (%), by Product Type 2025 & 2033
- Figure 18: Europe US Soft Drinks Packaging Industry Revenue (billion), by Country 2025 & 2033
- Figure 19: Europe US Soft Drinks Packaging Industry Revenue Share (%), by Country 2025 & 2033
- Figure 20: Middle East & Africa US Soft Drinks Packaging Industry Revenue (billion), by Packaging Material Type 2025 & 2033
- Figure 21: Middle East & Africa US Soft Drinks Packaging Industry Revenue Share (%), by Packaging Material Type 2025 & 2033
- Figure 22: Middle East & Africa US Soft Drinks Packaging Industry Revenue (billion), by Product Type 2025 & 2033
- Figure 23: Middle East & Africa US Soft Drinks Packaging Industry Revenue Share (%), by Product Type 2025 & 2033
- Figure 24: Middle East & Africa US Soft Drinks Packaging Industry Revenue (billion), by Country 2025 & 2033
- Figure 25: Middle East & Africa US Soft Drinks Packaging Industry Revenue Share (%), by Country 2025 & 2033
- Figure 26: Asia Pacific US Soft Drinks Packaging Industry Revenue (billion), by Packaging Material Type 2025 & 2033
- Figure 27: Asia Pacific US Soft Drinks Packaging Industry Revenue Share (%), by Packaging Material Type 2025 & 2033
- Figure 28: Asia Pacific US Soft Drinks Packaging Industry Revenue (billion), by Product Type 2025 & 2033
- Figure 29: Asia Pacific US Soft Drinks Packaging Industry Revenue Share (%), by Product Type 2025 & 2033
- Figure 30: Asia Pacific US Soft Drinks Packaging Industry Revenue (billion), by Country 2025 & 2033
- Figure 31: Asia Pacific US Soft Drinks Packaging Industry Revenue Share (%), by Country 2025 & 2033
List of Tables
- Table 1: Global US Soft Drinks Packaging Industry Revenue billion Forecast, by Packaging Material Type 2020 & 2033
- Table 2: Global US Soft Drinks Packaging Industry Revenue billion Forecast, by Product Type 2020 & 2033
- Table 3: Global US Soft Drinks Packaging Industry Revenue billion Forecast, by Region 2020 & 2033
- Table 4: Global US Soft Drinks Packaging Industry Revenue billion Forecast, by Packaging Material Type 2020 & 2033
- Table 5: Global US Soft Drinks Packaging Industry Revenue billion Forecast, by Product Type 2020 & 2033
- Table 6: Global US Soft Drinks Packaging Industry Revenue billion Forecast, by Country 2020 & 2033
- Table 7: United States US Soft Drinks Packaging Industry Revenue (billion) Forecast, by Application 2020 & 2033
- Table 8: Canada US Soft Drinks Packaging Industry Revenue (billion) Forecast, by Application 2020 & 2033
- Table 9: Mexico US Soft Drinks Packaging Industry Revenue (billion) Forecast, by Application 2020 & 2033
- Table 10: Global US Soft Drinks Packaging Industry Revenue billion Forecast, by Packaging Material Type 2020 & 2033
- Table 11: Global US Soft Drinks Packaging Industry Revenue billion Forecast, by Product Type 2020 & 2033
- Table 12: Global US Soft Drinks Packaging Industry Revenue billion Forecast, by Country 2020 & 2033
- Table 13: Brazil US Soft Drinks Packaging Industry Revenue (billion) Forecast, by Application 2020 & 2033
- Table 14: Argentina US Soft Drinks Packaging Industry Revenue (billion) Forecast, by Application 2020 & 2033
- Table 15: Rest of South America US Soft Drinks Packaging Industry Revenue (billion) Forecast, by Application 2020 & 2033
- Table 16: Global US Soft Drinks Packaging Industry Revenue billion Forecast, by Packaging Material Type 2020 & 2033
- Table 17: Global US Soft Drinks Packaging Industry Revenue billion Forecast, by Product Type 2020 & 2033
- Table 18: Global US Soft Drinks Packaging Industry Revenue billion Forecast, by Country 2020 & 2033
- Table 19: United Kingdom US Soft Drinks Packaging Industry Revenue (billion) Forecast, by Application 2020 & 2033
- Table 20: Germany US Soft Drinks Packaging Industry Revenue (billion) Forecast, by Application 2020 & 2033
- Table 21: France US Soft Drinks Packaging Industry Revenue (billion) Forecast, by Application 2020 & 2033
- Table 22: Italy US Soft Drinks Packaging Industry Revenue (billion) Forecast, by Application 2020 & 2033
- Table 23: Spain US Soft Drinks Packaging Industry Revenue (billion) Forecast, by Application 2020 & 2033
- Table 24: Russia US Soft Drinks Packaging Industry Revenue (billion) Forecast, by Application 2020 & 2033
- Table 25: Benelux US Soft Drinks Packaging Industry Revenue (billion) Forecast, by Application 2020 & 2033
- Table 26: Nordics US Soft Drinks Packaging Industry Revenue (billion) Forecast, by Application 2020 & 2033
- Table 27: Rest of Europe US Soft Drinks Packaging Industry Revenue (billion) Forecast, by Application 2020 & 2033
- Table 28: Global US Soft Drinks Packaging Industry Revenue billion Forecast, by Packaging Material Type 2020 & 2033
- Table 29: Global US Soft Drinks Packaging Industry Revenue billion Forecast, by Product Type 2020 & 2033
- Table 30: Global US Soft Drinks Packaging Industry Revenue billion Forecast, by Country 2020 & 2033
- Table 31: Turkey US Soft Drinks Packaging Industry Revenue (billion) Forecast, by Application 2020 & 2033
- Table 32: Israel US Soft Drinks Packaging Industry Revenue (billion) Forecast, by Application 2020 & 2033
- Table 33: GCC US Soft Drinks Packaging Industry Revenue (billion) Forecast, by Application 2020 & 2033
- Table 34: North Africa US Soft Drinks Packaging Industry Revenue (billion) Forecast, by Application 2020 & 2033
- Table 35: South Africa US Soft Drinks Packaging Industry Revenue (billion) Forecast, by Application 2020 & 2033
- Table 36: Rest of Middle East & Africa US Soft Drinks Packaging Industry Revenue (billion) Forecast, by Application 2020 & 2033
- Table 37: Global US Soft Drinks Packaging Industry Revenue billion Forecast, by Packaging Material Type 2020 & 2033
- Table 38: Global US Soft Drinks Packaging Industry Revenue billion Forecast, by Product Type 2020 & 2033
- Table 39: Global US Soft Drinks Packaging Industry Revenue billion Forecast, by Country 2020 & 2033
- Table 40: China US Soft Drinks Packaging Industry Revenue (billion) Forecast, by Application 2020 & 2033
- Table 41: India US Soft Drinks Packaging Industry Revenue (billion) Forecast, by Application 2020 & 2033
- Table 42: Japan US Soft Drinks Packaging Industry Revenue (billion) Forecast, by Application 2020 & 2033
- Table 43: South Korea US Soft Drinks Packaging Industry Revenue (billion) Forecast, by Application 2020 & 2033
- Table 44: ASEAN US Soft Drinks Packaging Industry Revenue (billion) Forecast, by Application 2020 & 2033
- Table 45: Oceania US Soft Drinks Packaging Industry Revenue (billion) Forecast, by Application 2020 & 2033
- Table 46: Rest of Asia Pacific US Soft Drinks Packaging Industry Revenue (billion) Forecast, by Application 2020 & 2033
Frequently Asked Questions
1. What is the projected Compound Annual Growth Rate (CAGR) of the US Soft Drinks Packaging Industry?
The projected CAGR is approximately 4.4%.
2. Which companies are prominent players in the US Soft Drinks Packaging Industry?
Key companies in the market include WestRock Company, Ball Corporation, CAN-PACK S A, Ardagh Group SA, Crown Holdings Inc, Graham Packaging Company, Tetra Pak International, Toyo Seikan Group Holdings Ltd, Placon Corporation, Sealed Air Corporation, Owens-Illinois Inc, Refresco Group NV, Amcor Ltd.
3. What are the main segments of the US Soft Drinks Packaging Industry?
The market segments include Packaging Material Type, Product Type.
4. Can you provide details about the market size?
The market size is estimated to be USD 26.86 billion as of 2022.
5. What are some drivers contributing to market growth?
Growing Demand for Ready-to-use Drinks; Increased demand for convenience packaging from consumers.
6. What are the notable trends driving market growth?
Plastic is Expected to Hold Significant Market Share.
7. Are there any restraints impacting market growth?
Environmental concerns regarding usage of plastic; Stringent Government Regulations.
8. Can you provide examples of recent developments in the market?
June 2021 - Amcor launched new machines to produce ultra-clear and heat resistance films. The AmPrima line uses machine-direction orientation technology to produce films that can run at speeds that competitors cannot match in a recycle-ready solution for packaging purposes.
9. What pricing options are available for accessing the report?
Pricing options include single-user, multi-user, and enterprise licenses priced at USD 3800, USD 4500, and USD 5800 respectively.
10. Is the market size provided in terms of value or volume?
The market size is provided in terms of value, measured in billion.
11. Are there any specific market keywords associated with the report?
Yes, the market keyword associated with the report is "US Soft Drinks Packaging Industry," which aids in identifying and referencing the specific market segment covered.
12. How do I determine which pricing option suits my needs best?
The pricing options vary based on user requirements and access needs. Individual users may opt for single-user licenses, while businesses requiring broader access may choose multi-user or enterprise licenses for cost-effective access to the report.
13. Are there any additional resources or data provided in the US Soft Drinks Packaging Industry report?
While the report offers comprehensive insights, it's advisable to review the specific contents or supplementary materials provided to ascertain if additional resources or data are available.
14. How can I stay updated on further developments or reports in the US Soft Drinks Packaging Industry?
To stay informed about further developments, trends, and reports in the US Soft Drinks Packaging Industry, consider subscribing to industry newsletters, following relevant companies and organizations, or regularly checking reputable industry news sources and publications.
Methodology
Step 1 - Identification of Relevant Samples Size from Population Database


Step 2 - Approaches for Defining Global Market Size (Value, Volume* & Price*)

Note*: In applicable scenarios
Step 3 - Data Sources
Primary Research
- Web Analytics
- Survey Reports
- Research Institute
- Latest Research Reports
- Opinion Leaders
Secondary Research
- Annual Reports
- White Paper
- Latest Press Release
- Industry Association
- Paid Database
- Investor Presentations

Step 4 - Data Triangulation
Involves using different sources of information in order to increase the validity of a study
These sources are likely to be stakeholders in a program - participants, other researchers, program staff, other community members, and so on.
Then we put all data in single framework & apply various statistical tools to find out the dynamic on the market.
During the analysis stage, feedback from the stakeholder groups would be compared to determine areas of agreement as well as areas of divergence