

Key Insights
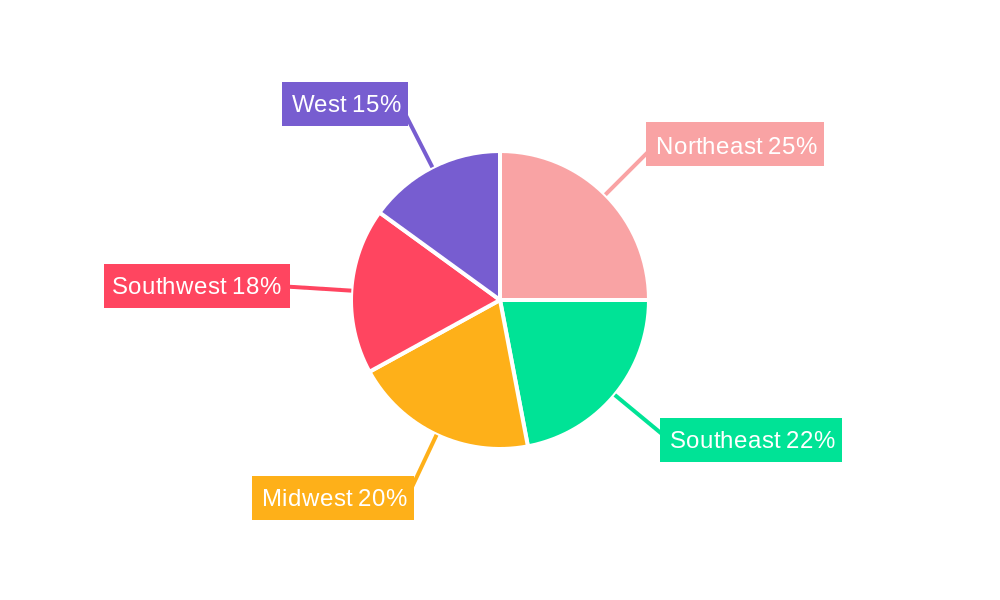
The US material handling industry, a crucial component of the nation's logistics and supply chain infrastructure, is experiencing robust growth. Driven by the e-commerce boom, increasing automation across various sectors, and a persistent need for efficiency improvements in warehousing and distribution, the market is projected to maintain a significant Compound Annual Growth Rate (CAGR). The substantial investment in automated systems like Automated Guided Vehicles (AGVs), Autonomous Mobile Robots (AMRs), and Automated Storage and Retrieval Systems (ASRS) is fueling this expansion. Segmentation analysis reveals strong performance across various end-user verticals, including automotive, e-commerce warehousing, food and beverage, and pharmaceuticals, each contributing uniquely to the overall market value. The Northeast, Southeast, and West regions of the US are expected to be key growth drivers, reflecting the concentration of major manufacturing and distribution hubs. However, challenges remain, including rising labor costs, the need for skilled technicians to operate and maintain advanced equipment, and the initial high capital expenditure associated with automation technologies.
The ongoing adoption of Industry 4.0 principles and the integration of advanced technologies like AI and machine learning in material handling solutions present significant opportunities. The market's evolution is also influenced by increasing demand for sustainable and energy-efficient solutions, prompting manufacturers to develop eco-friendly equipment and optimize logistics processes. Competitive pressures are intense, with established players and emerging technology companies vying for market share. The future growth of the US material handling industry hinges on the successful integration of advanced technologies, overcoming labor challenges, and adapting to the evolving needs of diverse end-user verticals in the face of a dynamic global economic landscape. Continued government investment in infrastructure development will also significantly influence the industry's trajectory.
US Material Handling Industry Market Report: 2019-2033
This comprehensive report provides an in-depth analysis of the US Material Handling Industry, offering valuable insights for stakeholders seeking to navigate this dynamic market. With a study period spanning 2019-2033, a base year of 2025, and a forecast period of 2025-2033, this report delivers a robust understanding of past performance, current trends, and future projections. The US Material Handling market is expected to reach xx Million by 2033, exhibiting a CAGR of xx% during the forecast period.
US Material Handling Industry Market Composition & Trends
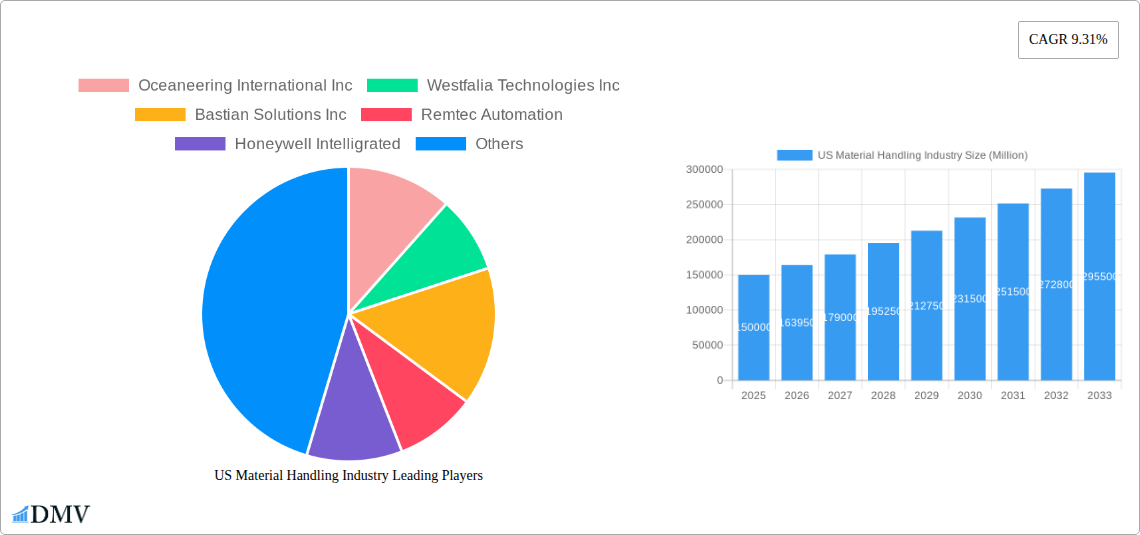
The US Material Handling market, valued at xx Million in 2024, is characterized by a moderately consolidated landscape with key players like Oceaneering International Inc, Westfalia Technologies Inc, Bastian Solutions Inc, Remtec Automation, Honeywell Intelligrated, Daifuku Co Ltd, Vanderlande Industries B V, Siggins Company, Kion Group AG, Dorner Manufacturing Corporation, Aethon Inc, DMW&H, and Cornerstone Automation Systems LLC holding significant market share. Innovation is driven by the increasing adoption of automation technologies, particularly AMRs and ASRS, fueled by e-commerce growth and labor shortages. Regulatory changes focusing on safety and efficiency standards continue to shape market dynamics. Substitute products, including manual handling techniques, are increasingly less competitive due to cost and efficiency considerations.
- Market Share Distribution (2024): Top 5 players account for approximately xx% of the market.
- M&A Activity (2019-2024): A total of xx M&A deals were recorded, with an aggregate value of approximately xx Million. Examples include the acquisition of Lauyans & Co. Inc. by W. M. Kelley Co. Inc. in January 2021.
- End-User Profile: Key end-user verticals include Retail/Warehousing/Distribution Centers/Logistic Centers, Automotive, Food and Beverage, and Pharmaceuticals, each exhibiting unique automation needs.
US Material Handling Industry Industry Evolution
The US Material Handling industry has witnessed significant growth, driven by the explosive growth of e-commerce, necessitating efficient and scalable logistics solutions. From 2019 to 2024, the market experienced a CAGR of xx%, exceeding previous projections due to increased adoption of automation technologies. Technological advancements, particularly in robotics (AGVs, AMRs), AI-powered systems, and cloud-based software solutions, have transformed operational efficiency and reduced operational costs. Consumer demand for faster delivery times and increased supply chain transparency continues to fuel this growth. The shift towards Industry 4.0 and the Internet of Things (IoT) is further driving the integration of smart material handling solutions. The market is also witnessing increased focus on sustainability, with companies adopting green initiatives in their operations. The integration of data analytics and predictive maintenance is another key trend, allowing companies to optimize their material handling operations in real-time and reduce downtime.
Leading Regions, Countries, or Segments in US Material Handling Industry
The largest segments by product type are Hardware (xx Million), followed by Services (xx Million) and Software (xx Million). Within equipment types, Automated Storage and Retrieval Systems (ASRS) and Automated Guided Vehicles (AGVs) dominate. The Retail/Warehousing/Distribution Centers/Logistic Centers segment is the largest end-user vertical, driving significant demand for automated solutions.
- Key Drivers:
- Significant investments in automation across major industries.
- Government incentives and regulations promoting efficiency and safety in material handling.
- E-commerce boom and increasing demand for faster delivery times.
- Dominance Factors: High concentration of warehouses and distribution centers, coupled with the need for increased efficiency and reduced labor costs, particularly within the e-commerce sector, drives the Retail/Warehousing/Distribution Centers/Logistic Centers segment's dominance.
US Material Handling Industry Product Innovations
Recent innovations focus on improving efficiency, flexibility, and safety. This includes advanced AGVs and AMRs with improved navigation and obstacle avoidance capabilities, ASRS systems with increased storage capacity and faster retrieval times, and sophisticated warehouse management systems (WMS) incorporating AI and machine learning for predictive maintenance and optimization. The integration of IoT sensors and cloud connectivity allows for real-time monitoring and data analytics, enhancing overall operational visibility and responsiveness. Unique selling propositions include customized solutions tailored to specific industry needs and improved ROI through reduced labor costs and increased throughput.
Propelling Factors for US Material Handling Industry Growth
The industry's growth is driven by several factors: Firstly, the relentless expansion of e-commerce fuels the need for efficient and automated warehousing and distribution. Secondly, labor shortages and rising labor costs incentivize automation adoption. Thirdly, technological advancements, such as AI and robotics, continue to improve the capabilities and efficiency of material handling equipment. Finally, government regulations focused on safety and environmental sustainability drive innovation and adoption of greener solutions.
Obstacles in the US Material Handling Industry Market
Challenges include the high initial investment costs associated with automation, supply chain disruptions impacting the availability of components, and intense competition among established players and new entrants. Regulatory complexities regarding safety standards and environmental compliance add further challenges. Furthermore, the integration of new technologies requires skilled labor and robust IT infrastructure, posing potential bottlenecks for some companies. These factors can contribute to unpredictable project timelines and potential cost overruns.
Future Opportunities in US Material Handling Industry
Emerging opportunities include the integration of Artificial Intelligence (AI) and Machine Learning (ML) for predictive maintenance and optimized workflows, the adoption of collaborative robots (cobots) for safer and more efficient human-robot interaction, the expansion into new and underserved markets (e.g., healthcare, renewable energy), and the development of more sustainable and environmentally friendly solutions. The growing demand for flexible and scalable solutions will also create opportunities for providers offering adaptable and modular systems.
Major Players in the US Material Handling Industry Ecosystem
- Oceaneering International Inc
- Westfalia Technologies Inc
- Bastian Solutions Inc
- Remtec Automation
- Honeywell Intelligrated
- Daifuku Co Ltd
- Vanderlande Industries B V
- Siggins Company
- Kion Group AG
- Dorner Manufacturing Corporation
- Aethon Inc
- DMW&H
- Cornerstone Automation Systems LLC
Key Developments in US Material Handling Industry Industry
- February 2021: Urban Outfitters Inc. partners with TGW to implement an automated fulfillment center solution using TGW's FlashPick system.
- January 2021: W. M. Kelley Co. Inc. acquires Lauyans & Co. Inc., expanding its overhead conveyor and permanent magnet solutions capabilities.
Strategic US Material Handling Industry Market Forecast
The US Material Handling market is poised for continued robust growth, driven by sustained e-commerce expansion, technological advancements, and increasing demand for efficient and automated solutions across various industries. The focus on sustainability, increased connectivity, and the integration of AI and ML will further shape market dynamics, presenting significant opportunities for innovative players. The market is expected to witness a consolidation trend as larger players acquire smaller companies, leading to a more competitive landscape.
US Material Handling Industry Segmentation
-
1. Product Type
- 1.1. Hardware
- 1.2. Software
- 1.3. Services
-
2. Equipment Type
-
2.1. Automated Guided Vehicle (AGV)
- 2.1.1. Automated Forklift
- 2.1.2. Automated Tow/Tractor/Tug
- 2.1.3. Unit Load
- 2.1.4. Assembly Line
- 2.1.5. Special Purpose
- 2.2. Autonomous Mobile Robots (AMR)
- 2.3. Laser Guided Vehicle
-
2.4. Automated Storage and Retrieval System (ASRS)
- 2.4.1. Fixed Aisle (Stacker Crane + Shuttle System)
- 2.4.2. Carousel (Horizontal Carousel + Vertical Carousel)
- 2.4.3. Vertical Lift Module
-
2.5. Automated Conveyor
- 2.5.1. Belt
- 2.5.2. Roller
- 2.5.3. Pallet
- 2.5.4. Overhead
-
2.6. Palletizer
- 2.6.1. Conventional (High Level + Low Level)
- 2.6.2. Robotic
- 2.7. Sortation System
-
2.1. Automated Guided Vehicle (AGV)
-
3. End-user Vertical
- 3.1. Airport
- 3.2. Automotive
- 3.3. Food and Beverage
- 3.4. Retail/W
- 3.5. General Manufacturing
- 3.6. Pharmaceuticals
- 3.7. Post and Parcel
- 3.8. Other End-Users
US Material Handling Industry Segmentation By Geography
-
1. North America
- 1.1. United States
- 1.2. Canada
- 1.3. Mexico
-
2. South America
- 2.1. Brazil
- 2.2. Argentina
- 2.3. Rest of South America
-
3. Europe
- 3.1. United Kingdom
- 3.2. Germany
- 3.3. France
- 3.4. Italy
- 3.5. Spain
- 3.6. Russia
- 3.7. Benelux
- 3.8. Nordics
- 3.9. Rest of Europe
-
4. Middle East & Africa
- 4.1. Turkey
- 4.2. Israel
- 4.3. GCC
- 4.4. North Africa
- 4.5. South Africa
- 4.6. Rest of Middle East & Africa
-
5. Asia Pacific
- 5.1. China
- 5.2. India
- 5.3. Japan
- 5.4. South Korea
- 5.5. ASEAN
- 5.6. Oceania
- 5.7. Rest of Asia Pacific
US Material Handling Industry REPORT HIGHLIGHTS
| Aspects | Details |
|---|---|
| Study Period | 2019-2033 |
| Base Year | 2024 |
| Estimated Year | 2025 |
| Forecast Period | 2025-2033 |
| Historical Period | 2019-2024 |
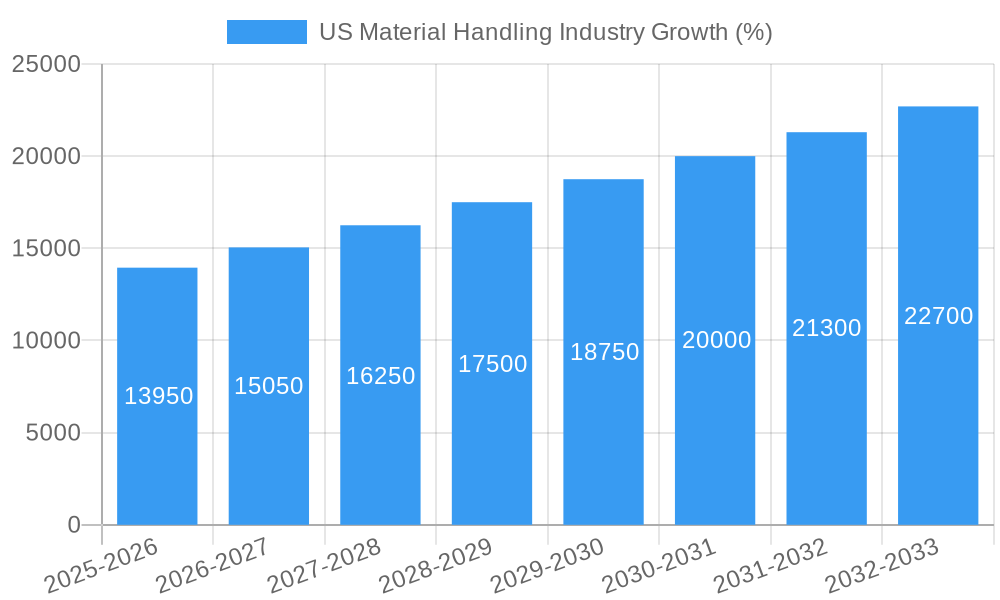
| Growth Rate | CAGR of 9.31% from 2019-2033 |
| Segmentation |
|
Table of Contents
- 1. Introduction
- 1.1. Research Scope
- 1.2. Market Segmentation
- 1.3. Research Methodology
- 1.4. Definitions and Assumptions
- 2. Executive Summary
- 2.1. Introduction
- 3. Market Dynamics
- 3.1. Introduction
- 3.2. Market Drivers
- 3.2.1. Increasing Manufacturing Complexity and Technology Availability; Increasing Demand for Improving Order Accuracy and SKU Proliferation; Emergence of Smart City Logistics and Wide Adoption of Robotics in Warehouse Applications
- 3.3. Market Restrains
- 3.3.1. Gap in Supply Chain Skills and Workforce Shortage; High initial costs
- 3.4. Market Trends
- 3.4.1. Autonomous Mobile Robots (AMR) is Expected to Hold Significant Market Share
- 4. Market Factor Analysis
- 4.1. Porters Five Forces
- 4.2. Supply/Value Chain
- 4.3. PESTEL analysis
- 4.4. Market Entropy
- 4.5. Patent/Trademark Analysis
- 5. Global US Material Handling Industry Analysis, Insights and Forecast, 2019-2031
- 5.1. Market Analysis, Insights and Forecast - by Product Type
- 5.1.1. Hardware
- 5.1.2. Software
- 5.1.3. Services
- 5.2. Market Analysis, Insights and Forecast - by Equipment Type
- 5.2.1. Automated Guided Vehicle (AGV)
- 5.2.1.1. Automated Forklift
- 5.2.1.2. Automated Tow/Tractor/Tug
- 5.2.1.3. Unit Load
- 5.2.1.4. Assembly Line
- 5.2.1.5. Special Purpose
- 5.2.2. Autonomous Mobile Robots (AMR)
- 5.2.3. Laser Guided Vehicle
- 5.2.4. Automated Storage and Retrieval System (ASRS)
- 5.2.4.1. Fixed Aisle (Stacker Crane + Shuttle System)
- 5.2.4.2. Carousel (Horizontal Carousel + Vertical Carousel)
- 5.2.4.3. Vertical Lift Module
- 5.2.5. Automated Conveyor
- 5.2.5.1. Belt
- 5.2.5.2. Roller
- 5.2.5.3. Pallet
- 5.2.5.4. Overhead
- 5.2.6. Palletizer
- 5.2.6.1. Conventional (High Level + Low Level)
- 5.2.6.2. Robotic
- 5.2.7. Sortation System
- 5.2.1. Automated Guided Vehicle (AGV)
- 5.3. Market Analysis, Insights and Forecast - by End-user Vertical
- 5.3.1. Airport
- 5.3.2. Automotive
- 5.3.3. Food and Beverage
- 5.3.4. Retail/W
- 5.3.5. General Manufacturing
- 5.3.6. Pharmaceuticals
- 5.3.7. Post and Parcel
- 5.3.8. Other End-Users
- 5.4. Market Analysis, Insights and Forecast - by Region
- 5.4.1. North America
- 5.4.2. South America
- 5.4.3. Europe
- 5.4.4. Middle East & Africa
- 5.4.5. Asia Pacific
- 5.1. Market Analysis, Insights and Forecast - by Product Type
- 6. North America US Material Handling Industry Analysis, Insights and Forecast, 2019-2031
- 6.1. Market Analysis, Insights and Forecast - by Product Type
- 6.1.1. Hardware
- 6.1.2. Software
- 6.1.3. Services
- 6.2. Market Analysis, Insights and Forecast - by Equipment Type
- 6.2.1. Automated Guided Vehicle (AGV)
- 6.2.1.1. Automated Forklift
- 6.2.1.2. Automated Tow/Tractor/Tug
- 6.2.1.3. Unit Load
- 6.2.1.4. Assembly Line
- 6.2.1.5. Special Purpose
- 6.2.2. Autonomous Mobile Robots (AMR)
- 6.2.3. Laser Guided Vehicle
- 6.2.4. Automated Storage and Retrieval System (ASRS)
- 6.2.4.1. Fixed Aisle (Stacker Crane + Shuttle System)
- 6.2.4.2. Carousel (Horizontal Carousel + Vertical Carousel)
- 6.2.4.3. Vertical Lift Module
- 6.2.5. Automated Conveyor
- 6.2.5.1. Belt
- 6.2.5.2. Roller
- 6.2.5.3. Pallet
- 6.2.5.4. Overhead
- 6.2.6. Palletizer
- 6.2.6.1. Conventional (High Level + Low Level)
- 6.2.6.2. Robotic
- 6.2.7. Sortation System
- 6.2.1. Automated Guided Vehicle (AGV)
- 6.3. Market Analysis, Insights and Forecast - by End-user Vertical
- 6.3.1. Airport
- 6.3.2. Automotive
- 6.3.3. Food and Beverage
- 6.3.4. Retail/W
- 6.3.5. General Manufacturing
- 6.3.6. Pharmaceuticals
- 6.3.7. Post and Parcel
- 6.3.8. Other End-Users
- 6.1. Market Analysis, Insights and Forecast - by Product Type
- 7. South America US Material Handling Industry Analysis, Insights and Forecast, 2019-2031
- 7.1. Market Analysis, Insights and Forecast - by Product Type
- 7.1.1. Hardware
- 7.1.2. Software
- 7.1.3. Services
- 7.2. Market Analysis, Insights and Forecast - by Equipment Type
- 7.2.1. Automated Guided Vehicle (AGV)
- 7.2.1.1. Automated Forklift
- 7.2.1.2. Automated Tow/Tractor/Tug
- 7.2.1.3. Unit Load
- 7.2.1.4. Assembly Line
- 7.2.1.5. Special Purpose
- 7.2.2. Autonomous Mobile Robots (AMR)
- 7.2.3. Laser Guided Vehicle
- 7.2.4. Automated Storage and Retrieval System (ASRS)
- 7.2.4.1. Fixed Aisle (Stacker Crane + Shuttle System)
- 7.2.4.2. Carousel (Horizontal Carousel + Vertical Carousel)
- 7.2.4.3. Vertical Lift Module
- 7.2.5. Automated Conveyor
- 7.2.5.1. Belt
- 7.2.5.2. Roller
- 7.2.5.3. Pallet
- 7.2.5.4. Overhead
- 7.2.6. Palletizer
- 7.2.6.1. Conventional (High Level + Low Level)
- 7.2.6.2. Robotic
- 7.2.7. Sortation System
- 7.2.1. Automated Guided Vehicle (AGV)
- 7.3. Market Analysis, Insights and Forecast - by End-user Vertical
- 7.3.1. Airport
- 7.3.2. Automotive
- 7.3.3. Food and Beverage
- 7.3.4. Retail/W
- 7.3.5. General Manufacturing
- 7.3.6. Pharmaceuticals
- 7.3.7. Post and Parcel
- 7.3.8. Other End-Users
- 7.1. Market Analysis, Insights and Forecast - by Product Type
- 8. Europe US Material Handling Industry Analysis, Insights and Forecast, 2019-2031
- 8.1. Market Analysis, Insights and Forecast - by Product Type
- 8.1.1. Hardware
- 8.1.2. Software
- 8.1.3. Services
- 8.2. Market Analysis, Insights and Forecast - by Equipment Type
- 8.2.1. Automated Guided Vehicle (AGV)
- 8.2.1.1. Automated Forklift
- 8.2.1.2. Automated Tow/Tractor/Tug
- 8.2.1.3. Unit Load
- 8.2.1.4. Assembly Line
- 8.2.1.5. Special Purpose
- 8.2.2. Autonomous Mobile Robots (AMR)
- 8.2.3. Laser Guided Vehicle
- 8.2.4. Automated Storage and Retrieval System (ASRS)
- 8.2.4.1. Fixed Aisle (Stacker Crane + Shuttle System)
- 8.2.4.2. Carousel (Horizontal Carousel + Vertical Carousel)
- 8.2.4.3. Vertical Lift Module
- 8.2.5. Automated Conveyor
- 8.2.5.1. Belt
- 8.2.5.2. Roller
- 8.2.5.3. Pallet
- 8.2.5.4. Overhead
- 8.2.6. Palletizer
- 8.2.6.1. Conventional (High Level + Low Level)
- 8.2.6.2. Robotic
- 8.2.7. Sortation System
- 8.2.1. Automated Guided Vehicle (AGV)
- 8.3. Market Analysis, Insights and Forecast - by End-user Vertical
- 8.3.1. Airport
- 8.3.2. Automotive
- 8.3.3. Food and Beverage
- 8.3.4. Retail/W
- 8.3.5. General Manufacturing
- 8.3.6. Pharmaceuticals
- 8.3.7. Post and Parcel
- 8.3.8. Other End-Users
- 8.1. Market Analysis, Insights and Forecast - by Product Type
- 9. Middle East & Africa US Material Handling Industry Analysis, Insights and Forecast, 2019-2031
- 9.1. Market Analysis, Insights and Forecast - by Product Type
- 9.1.1. Hardware
- 9.1.2. Software
- 9.1.3. Services
- 9.2. Market Analysis, Insights and Forecast - by Equipment Type
- 9.2.1. Automated Guided Vehicle (AGV)
- 9.2.1.1. Automated Forklift
- 9.2.1.2. Automated Tow/Tractor/Tug
- 9.2.1.3. Unit Load
- 9.2.1.4. Assembly Line
- 9.2.1.5. Special Purpose
- 9.2.2. Autonomous Mobile Robots (AMR)
- 9.2.3. Laser Guided Vehicle
- 9.2.4. Automated Storage and Retrieval System (ASRS)
- 9.2.4.1. Fixed Aisle (Stacker Crane + Shuttle System)
- 9.2.4.2. Carousel (Horizontal Carousel + Vertical Carousel)
- 9.2.4.3. Vertical Lift Module
- 9.2.5. Automated Conveyor
- 9.2.5.1. Belt
- 9.2.5.2. Roller
- 9.2.5.3. Pallet
- 9.2.5.4. Overhead
- 9.2.6. Palletizer
- 9.2.6.1. Conventional (High Level + Low Level)
- 9.2.6.2. Robotic
- 9.2.7. Sortation System
- 9.2.1. Automated Guided Vehicle (AGV)
- 9.3. Market Analysis, Insights and Forecast - by End-user Vertical
- 9.3.1. Airport
- 9.3.2. Automotive
- 9.3.3. Food and Beverage
- 9.3.4. Retail/W
- 9.3.5. General Manufacturing
- 9.3.6. Pharmaceuticals
- 9.3.7. Post and Parcel
- 9.3.8. Other End-Users
- 9.1. Market Analysis, Insights and Forecast - by Product Type
- 10. Asia Pacific US Material Handling Industry Analysis, Insights and Forecast, 2019-2031
- 10.1. Market Analysis, Insights and Forecast - by Product Type
- 10.1.1. Hardware
- 10.1.2. Software
- 10.1.3. Services
- 10.2. Market Analysis, Insights and Forecast - by Equipment Type
- 10.2.1. Automated Guided Vehicle (AGV)
- 10.2.1.1. Automated Forklift
- 10.2.1.2. Automated Tow/Tractor/Tug
- 10.2.1.3. Unit Load
- 10.2.1.4. Assembly Line
- 10.2.1.5. Special Purpose
- 10.2.2. Autonomous Mobile Robots (AMR)
- 10.2.3. Laser Guided Vehicle
- 10.2.4. Automated Storage and Retrieval System (ASRS)
- 10.2.4.1. Fixed Aisle (Stacker Crane + Shuttle System)
- 10.2.4.2. Carousel (Horizontal Carousel + Vertical Carousel)
- 10.2.4.3. Vertical Lift Module
- 10.2.5. Automated Conveyor
- 10.2.5.1. Belt
- 10.2.5.2. Roller
- 10.2.5.3. Pallet
- 10.2.5.4. Overhead
- 10.2.6. Palletizer
- 10.2.6.1. Conventional (High Level + Low Level)
- 10.2.6.2. Robotic
- 10.2.7. Sortation System
- 10.2.1. Automated Guided Vehicle (AGV)
- 10.3. Market Analysis, Insights and Forecast - by End-user Vertical
- 10.3.1. Airport
- 10.3.2. Automotive
- 10.3.3. Food and Beverage
- 10.3.4. Retail/W
- 10.3.5. General Manufacturing
- 10.3.6. Pharmaceuticals
- 10.3.7. Post and Parcel
- 10.3.8. Other End-Users
- 10.1. Market Analysis, Insights and Forecast - by Product Type
- 11. Northeast US Material Handling Industry Analysis, Insights and Forecast, 2019-2031
- 12. Southeast US Material Handling Industry Analysis, Insights and Forecast, 2019-2031
- 13. Midwest US Material Handling Industry Analysis, Insights and Forecast, 2019-2031
- 14. Southwest US Material Handling Industry Analysis, Insights and Forecast, 2019-2031
- 15. West US Material Handling Industry Analysis, Insights and Forecast, 2019-2031
- 16. Competitive Analysis
- 16.1. Global Market Share Analysis 2024
- 16.2. Company Profiles
- 16.2.1 Oceaneering International Inc
- 16.2.1.1. Overview
- 16.2.1.2. Products
- 16.2.1.3. SWOT Analysis
- 16.2.1.4. Recent Developments
- 16.2.1.5. Financials (Based on Availability)
- 16.2.2 Westfalia Technologies Inc
- 16.2.2.1. Overview
- 16.2.2.2. Products
- 16.2.2.3. SWOT Analysis
- 16.2.2.4. Recent Developments
- 16.2.2.5. Financials (Based on Availability)
- 16.2.3 Bastian Solutions Inc
- 16.2.3.1. Overview
- 16.2.3.2. Products
- 16.2.3.3. SWOT Analysis
- 16.2.3.4. Recent Developments
- 16.2.3.5. Financials (Based on Availability)
- 16.2.4 Remtec Automation
- 16.2.4.1. Overview
- 16.2.4.2. Products
- 16.2.4.3. SWOT Analysis
- 16.2.4.4. Recent Developments
- 16.2.4.5. Financials (Based on Availability)
- 16.2.5 Honeywell Intelligrated
- 16.2.5.1. Overview
- 16.2.5.2. Products
- 16.2.5.3. SWOT Analysis
- 16.2.5.4. Recent Developments
- 16.2.5.5. Financials (Based on Availability)
- 16.2.6 Daifuku Co Ltd
- 16.2.6.1. Overview
- 16.2.6.2. Products
- 16.2.6.3. SWOT Analysis
- 16.2.6.4. Recent Developments
- 16.2.6.5. Financials (Based on Availability)
- 16.2.7 Vanderlande Industries B V *List Not Exhaustive
- 16.2.7.1. Overview
- 16.2.7.2. Products
- 16.2.7.3. SWOT Analysis
- 16.2.7.4. Recent Developments
- 16.2.7.5. Financials (Based on Availability)
- 16.2.8 Siggins Company
- 16.2.8.1. Overview
- 16.2.8.2. Products
- 16.2.8.3. SWOT Analysis
- 16.2.8.4. Recent Developments
- 16.2.8.5. Financials (Based on Availability)
- 16.2.9 Kion Group AG
- 16.2.9.1. Overview
- 16.2.9.2. Products
- 16.2.9.3. SWOT Analysis
- 16.2.9.4. Recent Developments
- 16.2.9.5. Financials (Based on Availability)
- 16.2.10 Dorner Manufacturing Corporation
- 16.2.10.1. Overview
- 16.2.10.2. Products
- 16.2.10.3. SWOT Analysis
- 16.2.10.4. Recent Developments
- 16.2.10.5. Financials (Based on Availability)
- 16.2.11 Aethon Inc
- 16.2.11.1. Overview
- 16.2.11.2. Products
- 16.2.11.3. SWOT Analysis
- 16.2.11.4. Recent Developments
- 16.2.11.5. Financials (Based on Availability)
- 16.2.12 DMW&H
- 16.2.12.1. Overview
- 16.2.12.2. Products
- 16.2.12.3. SWOT Analysis
- 16.2.12.4. Recent Developments
- 16.2.12.5. Financials (Based on Availability)
- 16.2.13 Cornerstone Automation Systems LLC
- 16.2.13.1. Overview
- 16.2.13.2. Products
- 16.2.13.3. SWOT Analysis
- 16.2.13.4. Recent Developments
- 16.2.13.5. Financials (Based on Availability)
- 16.2.1 Oceaneering International Inc
List of Figures
- Figure 1: Global US Material Handling Industry Revenue Breakdown (Million, %) by Region 2024 & 2032
- Figure 2: United states US Material Handling Industry Revenue (Million), by Country 2024 & 2032
- Figure 3: United states US Material Handling Industry Revenue Share (%), by Country 2024 & 2032
- Figure 4: North America US Material Handling Industry Revenue (Million), by Product Type 2024 & 2032
- Figure 5: North America US Material Handling Industry Revenue Share (%), by Product Type 2024 & 2032
- Figure 6: North America US Material Handling Industry Revenue (Million), by Equipment Type 2024 & 2032
- Figure 7: North America US Material Handling Industry Revenue Share (%), by Equipment Type 2024 & 2032
- Figure 8: North America US Material Handling Industry Revenue (Million), by End-user Vertical 2024 & 2032
- Figure 9: North America US Material Handling Industry Revenue Share (%), by End-user Vertical 2024 & 2032
- Figure 10: North America US Material Handling Industry Revenue (Million), by Country 2024 & 2032
- Figure 11: North America US Material Handling Industry Revenue Share (%), by Country 2024 & 2032
- Figure 12: South America US Material Handling Industry Revenue (Million), by Product Type 2024 & 2032
- Figure 13: South America US Material Handling Industry Revenue Share (%), by Product Type 2024 & 2032
- Figure 14: South America US Material Handling Industry Revenue (Million), by Equipment Type 2024 & 2032
- Figure 15: South America US Material Handling Industry Revenue Share (%), by Equipment Type 2024 & 2032
- Figure 16: South America US Material Handling Industry Revenue (Million), by End-user Vertical 2024 & 2032
- Figure 17: South America US Material Handling Industry Revenue Share (%), by End-user Vertical 2024 & 2032
- Figure 18: South America US Material Handling Industry Revenue (Million), by Country 2024 & 2032
- Figure 19: South America US Material Handling Industry Revenue Share (%), by Country 2024 & 2032
- Figure 20: Europe US Material Handling Industry Revenue (Million), by Product Type 2024 & 2032
- Figure 21: Europe US Material Handling Industry Revenue Share (%), by Product Type 2024 & 2032
- Figure 22: Europe US Material Handling Industry Revenue (Million), by Equipment Type 2024 & 2032
- Figure 23: Europe US Material Handling Industry Revenue Share (%), by Equipment Type 2024 & 2032
- Figure 24: Europe US Material Handling Industry Revenue (Million), by End-user Vertical 2024 & 2032
- Figure 25: Europe US Material Handling Industry Revenue Share (%), by End-user Vertical 2024 & 2032
- Figure 26: Europe US Material Handling Industry Revenue (Million), by Country 2024 & 2032
- Figure 27: Europe US Material Handling Industry Revenue Share (%), by Country 2024 & 2032
- Figure 28: Middle East & Africa US Material Handling Industry Revenue (Million), by Product Type 2024 & 2032
- Figure 29: Middle East & Africa US Material Handling Industry Revenue Share (%), by Product Type 2024 & 2032
- Figure 30: Middle East & Africa US Material Handling Industry Revenue (Million), by Equipment Type 2024 & 2032
- Figure 31: Middle East & Africa US Material Handling Industry Revenue Share (%), by Equipment Type 2024 & 2032
- Figure 32: Middle East & Africa US Material Handling Industry Revenue (Million), by End-user Vertical 2024 & 2032
- Figure 33: Middle East & Africa US Material Handling Industry Revenue Share (%), by End-user Vertical 2024 & 2032
- Figure 34: Middle East & Africa US Material Handling Industry Revenue (Million), by Country 2024 & 2032
- Figure 35: Middle East & Africa US Material Handling Industry Revenue Share (%), by Country 2024 & 2032
- Figure 36: Asia Pacific US Material Handling Industry Revenue (Million), by Product Type 2024 & 2032
- Figure 37: Asia Pacific US Material Handling Industry Revenue Share (%), by Product Type 2024 & 2032
- Figure 38: Asia Pacific US Material Handling Industry Revenue (Million), by Equipment Type 2024 & 2032
- Figure 39: Asia Pacific US Material Handling Industry Revenue Share (%), by Equipment Type 2024 & 2032
- Figure 40: Asia Pacific US Material Handling Industry Revenue (Million), by End-user Vertical 2024 & 2032
- Figure 41: Asia Pacific US Material Handling Industry Revenue Share (%), by End-user Vertical 2024 & 2032
- Figure 42: Asia Pacific US Material Handling Industry Revenue (Million), by Country 2024 & 2032
- Figure 43: Asia Pacific US Material Handling Industry Revenue Share (%), by Country 2024 & 2032
List of Tables
- Table 1: Global US Material Handling Industry Revenue Million Forecast, by Region 2019 & 2032
- Table 2: Global US Material Handling Industry Revenue Million Forecast, by Product Type 2019 & 2032
- Table 3: Global US Material Handling Industry Revenue Million Forecast, by Equipment Type 2019 & 2032
- Table 4: Global US Material Handling Industry Revenue Million Forecast, by End-user Vertical 2019 & 2032
- Table 5: Global US Material Handling Industry Revenue Million Forecast, by Region 2019 & 2032
- Table 6: Global US Material Handling Industry Revenue Million Forecast, by Country 2019 & 2032
- Table 7: Northeast US Material Handling Industry Revenue (Million) Forecast, by Application 2019 & 2032
- Table 8: Southeast US Material Handling Industry Revenue (Million) Forecast, by Application 2019 & 2032
- Table 9: Midwest US Material Handling Industry Revenue (Million) Forecast, by Application 2019 & 2032
- Table 10: Southwest US Material Handling Industry Revenue (Million) Forecast, by Application 2019 & 2032
- Table 11: West US Material Handling Industry Revenue (Million) Forecast, by Application 2019 & 2032
- Table 12: Global US Material Handling Industry Revenue Million Forecast, by Product Type 2019 & 2032
- Table 13: Global US Material Handling Industry Revenue Million Forecast, by Equipment Type 2019 & 2032
- Table 14: Global US Material Handling Industry Revenue Million Forecast, by End-user Vertical 2019 & 2032
- Table 15: Global US Material Handling Industry Revenue Million Forecast, by Country 2019 & 2032
- Table 16: United States US Material Handling Industry Revenue (Million) Forecast, by Application 2019 & 2032
- Table 17: Canada US Material Handling Industry Revenue (Million) Forecast, by Application 2019 & 2032
- Table 18: Mexico US Material Handling Industry Revenue (Million) Forecast, by Application 2019 & 2032
- Table 19: Global US Material Handling Industry Revenue Million Forecast, by Product Type 2019 & 2032
- Table 20: Global US Material Handling Industry Revenue Million Forecast, by Equipment Type 2019 & 2032
- Table 21: Global US Material Handling Industry Revenue Million Forecast, by End-user Vertical 2019 & 2032
- Table 22: Global US Material Handling Industry Revenue Million Forecast, by Country 2019 & 2032
- Table 23: Brazil US Material Handling Industry Revenue (Million) Forecast, by Application 2019 & 2032
- Table 24: Argentina US Material Handling Industry Revenue (Million) Forecast, by Application 2019 & 2032
- Table 25: Rest of South America US Material Handling Industry Revenue (Million) Forecast, by Application 2019 & 2032
- Table 26: Global US Material Handling Industry Revenue Million Forecast, by Product Type 2019 & 2032
- Table 27: Global US Material Handling Industry Revenue Million Forecast, by Equipment Type 2019 & 2032
- Table 28: Global US Material Handling Industry Revenue Million Forecast, by End-user Vertical 2019 & 2032
- Table 29: Global US Material Handling Industry Revenue Million Forecast, by Country 2019 & 2032
- Table 30: United Kingdom US Material Handling Industry Revenue (Million) Forecast, by Application 2019 & 2032
- Table 31: Germany US Material Handling Industry Revenue (Million) Forecast, by Application 2019 & 2032
- Table 32: France US Material Handling Industry Revenue (Million) Forecast, by Application 2019 & 2032
- Table 33: Italy US Material Handling Industry Revenue (Million) Forecast, by Application 2019 & 2032
- Table 34: Spain US Material Handling Industry Revenue (Million) Forecast, by Application 2019 & 2032
- Table 35: Russia US Material Handling Industry Revenue (Million) Forecast, by Application 2019 & 2032
- Table 36: Benelux US Material Handling Industry Revenue (Million) Forecast, by Application 2019 & 2032
- Table 37: Nordics US Material Handling Industry Revenue (Million) Forecast, by Application 2019 & 2032
- Table 38: Rest of Europe US Material Handling Industry Revenue (Million) Forecast, by Application 2019 & 2032
- Table 39: Global US Material Handling Industry Revenue Million Forecast, by Product Type 2019 & 2032
- Table 40: Global US Material Handling Industry Revenue Million Forecast, by Equipment Type 2019 & 2032
- Table 41: Global US Material Handling Industry Revenue Million Forecast, by End-user Vertical 2019 & 2032
- Table 42: Global US Material Handling Industry Revenue Million Forecast, by Country 2019 & 2032
- Table 43: Turkey US Material Handling Industry Revenue (Million) Forecast, by Application 2019 & 2032
- Table 44: Israel US Material Handling Industry Revenue (Million) Forecast, by Application 2019 & 2032
- Table 45: GCC US Material Handling Industry Revenue (Million) Forecast, by Application 2019 & 2032
- Table 46: North Africa US Material Handling Industry Revenue (Million) Forecast, by Application 2019 & 2032
- Table 47: South Africa US Material Handling Industry Revenue (Million) Forecast, by Application 2019 & 2032
- Table 48: Rest of Middle East & Africa US Material Handling Industry Revenue (Million) Forecast, by Application 2019 & 2032
- Table 49: Global US Material Handling Industry Revenue Million Forecast, by Product Type 2019 & 2032
- Table 50: Global US Material Handling Industry Revenue Million Forecast, by Equipment Type 2019 & 2032
- Table 51: Global US Material Handling Industry Revenue Million Forecast, by End-user Vertical 2019 & 2032
- Table 52: Global US Material Handling Industry Revenue Million Forecast, by Country 2019 & 2032
- Table 53: China US Material Handling Industry Revenue (Million) Forecast, by Application 2019 & 2032
- Table 54: India US Material Handling Industry Revenue (Million) Forecast, by Application 2019 & 2032
- Table 55: Japan US Material Handling Industry Revenue (Million) Forecast, by Application 2019 & 2032
- Table 56: South Korea US Material Handling Industry Revenue (Million) Forecast, by Application 2019 & 2032
- Table 57: ASEAN US Material Handling Industry Revenue (Million) Forecast, by Application 2019 & 2032
- Table 58: Oceania US Material Handling Industry Revenue (Million) Forecast, by Application 2019 & 2032
- Table 59: Rest of Asia Pacific US Material Handling Industry Revenue (Million) Forecast, by Application 2019 & 2032
Frequently Asked Questions
1. What is the projected Compound Annual Growth Rate (CAGR) of the US Material Handling Industry?
The projected CAGR is approximately 9.31%.
2. Which companies are prominent players in the US Material Handling Industry?
Key companies in the market include Oceaneering International Inc, Westfalia Technologies Inc, Bastian Solutions Inc, Remtec Automation, Honeywell Intelligrated, Daifuku Co Ltd, Vanderlande Industries B V *List Not Exhaustive, Siggins Company, Kion Group AG, Dorner Manufacturing Corporation, Aethon Inc, DMW&H, Cornerstone Automation Systems LLC.
3. What are the main segments of the US Material Handling Industry?
The market segments include Product Type, Equipment Type, End-user Vertical.
4. Can you provide details about the market size?
The market size is estimated to be USD XX Million as of 2022.
5. What are some drivers contributing to market growth?
Increasing Manufacturing Complexity and Technology Availability; Increasing Demand for Improving Order Accuracy and SKU Proliferation; Emergence of Smart City Logistics and Wide Adoption of Robotics in Warehouse Applications.
6. What are the notable trends driving market growth?
Autonomous Mobile Robots (AMR) is Expected to Hold Significant Market Share.
7. Are there any restraints impacting market growth?
Gap in Supply Chain Skills and Workforce Shortage; High initial costs.
8. Can you provide examples of recent developments in the market?
February 2021- Urban Outfitters Inc. (URBN), one of the providers of lifestyle products and services companies, that operates a portfolio of global consumer brands comprised of Anthropologie, BHLDN, Free People, Terrain, Urban Outfitters, Nuuly, and a Food and Beverage division partnered with TGW to design and implement an automation solution for a new fulfillment center in Kansas City, in the US. The company's FlashPick system is provided as a solution as the product picks orders fully automatically and ensures the next phase of picking is being addressed.
9. What pricing options are available for accessing the report?
Pricing options include single-user, multi-user, and enterprise licenses priced at USD 3800, USD 4500, and USD 5800 respectively.
10. Is the market size provided in terms of value or volume?
The market size is provided in terms of value, measured in Million.
11. Are there any specific market keywords associated with the report?
Yes, the market keyword associated with the report is "US Material Handling Industry," which aids in identifying and referencing the specific market segment covered.
12. How do I determine which pricing option suits my needs best?
The pricing options vary based on user requirements and access needs. Individual users may opt for single-user licenses, while businesses requiring broader access may choose multi-user or enterprise licenses for cost-effective access to the report.
13. Are there any additional resources or data provided in the US Material Handling Industry report?
While the report offers comprehensive insights, it's advisable to review the specific contents or supplementary materials provided to ascertain if additional resources or data are available.
14. How can I stay updated on further developments or reports in the US Material Handling Industry?
To stay informed about further developments, trends, and reports in the US Material Handling Industry, consider subscribing to industry newsletters, following relevant companies and organizations, or regularly checking reputable industry news sources and publications.
Methodology
Step 1 - Identification of Relevant Samples Size from Population Database


Step 2 - Approaches for Defining Global Market Size (Value, Volume* & Price*)

Note*: In applicable scenarios
Step 3 - Data Sources
Primary Research
- Web Analytics
- Survey Reports
- Research Institute
- Latest Research Reports
- Opinion Leaders
Secondary Research
- Annual Reports
- White Paper
- Latest Press Release
- Industry Association
- Paid Database
- Investor Presentations

Step 4 - Data Triangulation
Involves using different sources of information in order to increase the validity of a study
These sources are likely to be stakeholders in a program - participants, other researchers, program staff, other community members, and so on.
Then we put all data in single framework & apply various statistical tools to find out the dynamic on the market.
During the analysis stage, feedback from the stakeholder groups would be compared to determine areas of agreement as well as areas of divergence
