

Key Insights
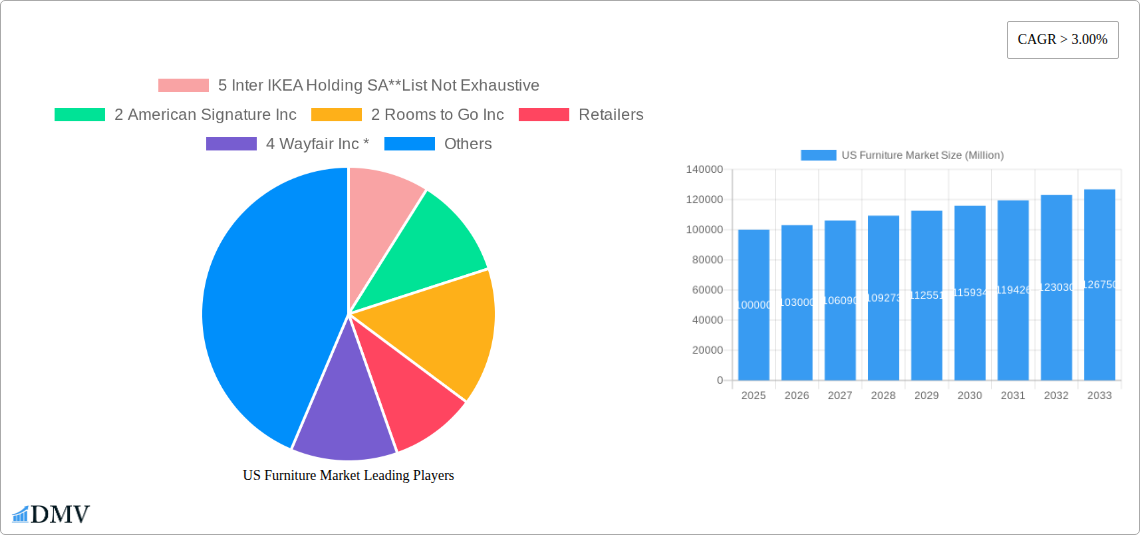
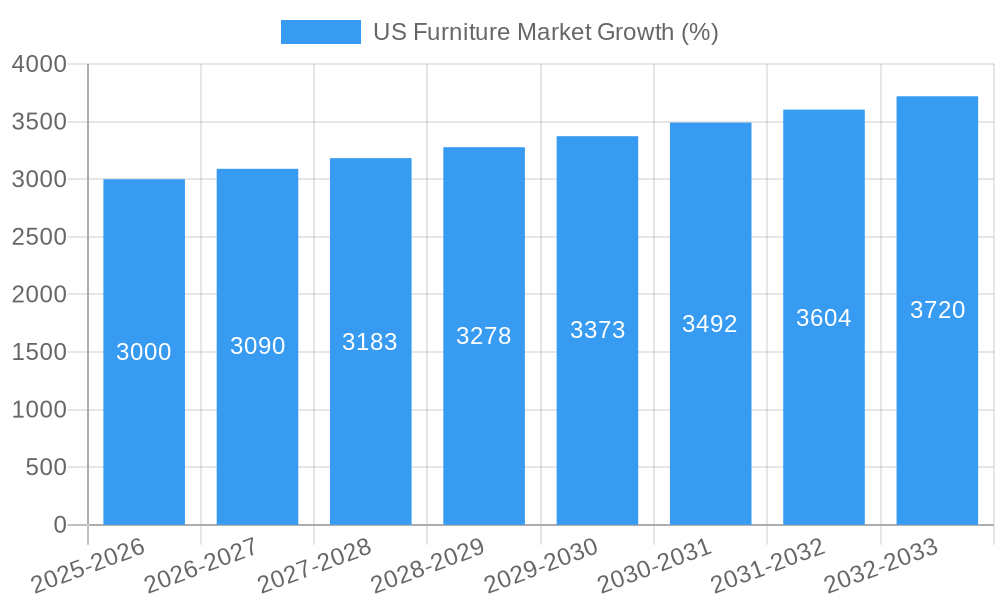
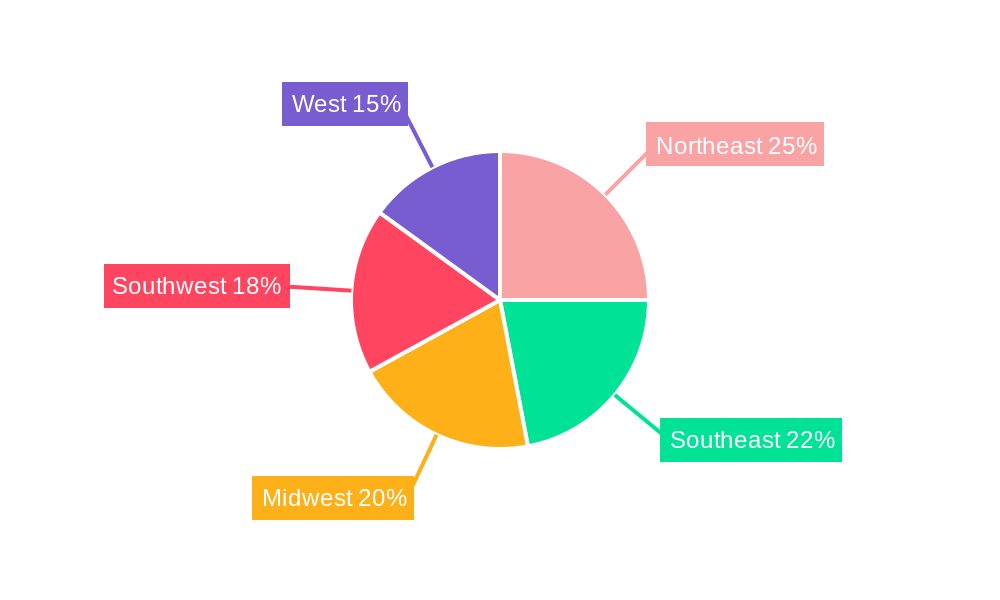
The US furniture market, valued at approximately $100 billion in 2025, is projected to experience robust growth, exceeding a 3% CAGR through 2033. This expansion is fueled by several key drivers. Rising disposable incomes, particularly among millennials and Gen Z, are leading to increased spending on home furnishings. A shift towards a preference for comfortable and stylish home environments, amplified by the pandemic-induced increase in remote work and home-based leisure, significantly boosts demand. The growing popularity of online furniture retail, offering convenience and a wider selection, further contributes to market growth. While increasing raw material costs and supply chain disruptions pose challenges, innovation in furniture design and sustainable manufacturing practices are emerging as countervailing forces. The market segmentation reveals strong performance across various product categories, with kitchen and living room furniture dominating, followed by bedroom and outdoor furniture. Online channels, while still growing, face competition from established home centers and flagship stores, showcasing a diverse and dynamic retail landscape. Regional variations in market size reflect differences in population density, income levels, and housing markets, with the Northeast and West Coast potentially showing higher per capita spending.
The competitive landscape is characterized by a mix of large multinational corporations like Inter IKEA Holding SA and Wayfair Inc., alongside regional and national players like American Signature Inc. and Ashley Furniture Store. The presence of both established brands and emerging online retailers ensures dynamic competition and a continuous evolution of product offerings and pricing strategies. Manufacturers are focusing on customization options and personalized experiences to meet evolving consumer preferences. This trend towards personalization, combined with a growing focus on sustainable and ethically sourced materials, will likely shape the future trajectory of the US furniture market. The forecast period (2025-2033) promises sustained growth, underpinned by continued economic expansion, demographic shifts, and the enduring appeal of comfortable and stylish home environments.
US Furniture Market: A Comprehensive Report (2019-2033)
This insightful report provides a detailed analysis of the US furniture market, offering a comprehensive overview of its current state, future trends, and key players. The study covers the period from 2019 to 2033, with 2025 serving as the base and estimated year. The report is crucial for stakeholders seeking to understand market dynamics, identify growth opportunities, and make informed strategic decisions. The US furniture market, valued at $xx Million in 2025, is projected to reach $xx Million by 2033, exhibiting a CAGR of xx%.
US Furniture Market Composition & Trends
The US furniture market is a dynamic landscape characterized by varying degrees of market concentration across different segments. While some segments, like online furniture retail, display higher concentration with key players controlling significant market share, others remain relatively fragmented. This report analyzes market share distribution for major players such as Wayfair Inc, Ashley Furniture, and Inter IKEA Holding SA. Innovation is driven by consumer demand for sustainable, smart, and customizable furniture, leading to the emergence of new materials, designs, and manufacturing processes. The regulatory landscape, including safety and environmental standards, significantly impacts manufacturers and retailers. Substitute products, such as modular and multi-functional furniture, are increasingly gaining popularity, impacting traditional furniture sales. End-user profiles are diverse, ranging from individual homeowners to businesses and institutions. M&A activity in the market has been moderate, with deal values ranging from $xx Million to $xx Million in recent years, driven by companies seeking expansion and diversification.
- Market Concentration: Highly concentrated in online retail, fragmented in other segments.
- Innovation Catalysts: Sustainable materials, smart furniture, customization options.
- Regulatory Landscape: Safety and environmental standards impacting manufacturing and sales.
- Substitute Products: Modular furniture, multi-functional designs impacting traditional sales.
- End-User Profiles: Homeowners, businesses, institutions.
- M&A Activity: Moderate activity, deal values ranging from $xx Million to $xx Million.
US Furniture Market Industry Evolution
The US furniture market has experienced significant evolution over the historical period (2019-2024). Growth has been driven by several factors, including rising disposable incomes, increasing urbanization, and a growing preference for home improvement projects. Technological advancements such as 3D printing and automation have influenced manufacturing processes, improving efficiency and customization. Consumer demands have shifted towards sustainable and eco-friendly furniture, prompting manufacturers to adopt responsible sourcing practices and eco-conscious materials. The rise of e-commerce has revolutionized distribution channels, with online retailers like Wayfair Inc gaining substantial market share. The market experienced a growth rate of xx% from 2019 to 2024, with a notable acceleration in online sales adoption. The forecast period (2025-2033) anticipates continued growth, although potentially at a slightly moderated pace, due to factors such as economic uncertainty and supply chain resilience.
Leading Regions, Countries, or Segments in US Furniture Market
The US furniture market is geographically diverse, with varying levels of growth and penetration across different regions. By product segment, the Living and Bedroom Furniture segment dominates, accounting for the largest market share, followed by Kitchen Furniture and Outdoor Furniture. This dominance is driven by consistently high demand for these product categories. Online stores are experiencing the fastest growth among distribution channels, fueled by increased e-commerce adoption and convenience. Flagship stores maintain a significant presence, offering consumers a tangible shopping experience and showroom displays.
- By Product:
- Living and Bedroom Furniture: High demand driven by home improvements and new household formations.
- Kitchen Furniture: Strong growth due to renovation projects and new home constructions.
- Outdoor Furniture: Seasonal demand influenced by weather conditions and lifestyle trends.
- By Distribution Channel:
- Online Stores: Rapid growth driven by e-commerce adoption and convenience.
- Flagship Stores: Maintain strong presence due to showroom experience and brand building.
- Specialty Stores: Cater to niche markets and offer specialized services.
US Furniture Market Product Innovations
Recent innovations in the US furniture market focus on incorporating smart technology, sustainable materials, and customizable designs. Smart furniture features integrated technology such as built-in charging stations, adjustable features, and integrated lighting. The use of sustainable materials such as reclaimed wood and recycled fabrics is gaining popularity, addressing growing environmental concerns. Customization options, allowing consumers to tailor furniture to their specific needs and preferences, are driving innovation and product differentiation. These features provide unique selling propositions and appeal to environmentally and technologically conscious consumers.
Propelling Factors for US Furniture Market Growth
Several factors fuel the growth of the US furniture market. Technological advancements in manufacturing and design contribute to efficiency and customization. Strong economic conditions, characterized by increasing disposable income and rising homeownership rates, boost consumer spending on furniture. Favorable regulatory policies, including incentives for sustainable practices, support market expansion. The growing preference for home improvement and renovation projects further fuels demand.
Obstacles in the US Furniture Market
Challenges facing the US furniture market include supply chain disruptions causing material shortages and price increases. Rising raw material costs and labor expenses impact profitability. Intense competition among numerous furniture manufacturers and retailers necessitates aggressive pricing strategies and differentiation. Stringent regulatory compliance requirements for safety and environmental standards increase manufacturing costs. These challenges can lead to reduced profit margins and restrain market growth.
Future Opportunities in US Furniture Market
Future opportunities lie in expanding into new markets, such as rental furniture and subscription services. The adoption of advanced technologies like augmented reality and virtual reality for enhanced shopping experiences presents significant potential. The increasing demand for sustainable and eco-friendly furniture creates opportunities for manufacturers using recycled materials and ethical sourcing. Catering to evolving consumer preferences, such as smaller living spaces and multi-functional furniture, opens new avenues for innovation and growth.
Major Players in the US Furniture Market Ecosystem
- 5 Inter IKEA Holding SA
- 2 American Signature Inc
- 2 Rooms to Go Inc
- 4 Wayfair Inc
- 3 Crate and Barrel
- 3 Williams-Sonoma Inc
- 4 La-Z-Boy
- 1 Ashley Furniture Store
- 1 Bed Bath & Beyond Inc
Key Developments in US Furniture Market Industry
- 2022 Q4: Wayfair Inc launched a new line of sustainable furniture.
- 2023 Q1: American Signature Inc acquired a smaller furniture manufacturer, expanding its product line.
- 2023 Q3: Increased adoption of 3D printing technologies by several manufacturers.
Strategic US Furniture Market Forecast
The US furniture market is poised for continued growth, driven by sustained demand for home improvement, technological innovation, and the rise of e-commerce. While challenges exist, the market's adaptability, ongoing product development, and increased focus on sustainability signal a positive outlook. This report projects strong growth in the coming years, with a particular emphasis on the online retail segment and the adoption of smart and sustainable products.
US Furniture Market Segmentation
- 1. Production Analysis
- 2. Consumption Analysis
- 3. Import Market Analysis (Value & Volume)
- 4. Export Market Analysis (Value & Volume)
- 5. Price Trend Analysis
US Furniture Market Segmentation By Geography
-
1. North America
- 1.1. United States
- 1.2. Canada
- 1.3. Mexico
-
2. South America
- 2.1. Brazil
- 2.2. Argentina
- 2.3. Rest of South America
-
3. Europe
- 3.1. United Kingdom
- 3.2. Germany
- 3.3. France
- 3.4. Italy
- 3.5. Spain
- 3.6. Russia
- 3.7. Benelux
- 3.8. Nordics
- 3.9. Rest of Europe
-
4. Middle East & Africa
- 4.1. Turkey
- 4.2. Israel
- 4.3. GCC
- 4.4. North Africa
- 4.5. South Africa
- 4.6. Rest of Middle East & Africa
-
5. Asia Pacific
- 5.1. China
- 5.2. India
- 5.3. Japan
- 5.4. South Korea
- 5.5. ASEAN
- 5.6. Oceania
- 5.7. Rest of Asia Pacific
US Furniture Market REPORT HIGHLIGHTS
| Aspects | Details |
|---|---|
| Study Period | 2019-2033 |
| Base Year | 2024 |
| Estimated Year | 2025 |
| Forecast Period | 2025-2033 |
| Historical Period | 2019-2024 |
| Growth Rate | CAGR of > 3.00% from 2019-2033 |
| Segmentation |
|
Table of Contents
- 1. Introduction
- 1.1. Research Scope
- 1.2. Market Segmentation
- 1.3. Research Methodology
- 1.4. Definitions and Assumptions
- 2. Executive Summary
- 2.1. Introduction
- 3. Market Dynamics
- 3.1. Introduction
- 3.2. Market Drivers
- 3.2.1. Rising Urbanization and Population Growth; Growth in the Construction Industry is Driving the Market
- 3.3. Market Restrains
- 3.3.1. Economic Uncertainty; Increasing Competition in the Market
- 3.4. Market Trends
- 3.4.1. Growing Sales of Bedroom Furniture is Driving the Market
- 4. Market Factor Analysis
- 4.1. Porters Five Forces
- 4.2. Supply/Value Chain
- 4.3. PESTEL analysis
- 4.4. Market Entropy
- 4.5. Patent/Trademark Analysis
- 5. Global US Furniture Market Analysis, Insights and Forecast, 2019-2031
- 5.1. Market Analysis, Insights and Forecast - by Production Analysis
- 5.2. Market Analysis, Insights and Forecast - by Consumption Analysis
- 5.3. Market Analysis, Insights and Forecast - by Import Market Analysis (Value & Volume)
- 5.4. Market Analysis, Insights and Forecast - by Export Market Analysis (Value & Volume)
- 5.5. Market Analysis, Insights and Forecast - by Price Trend Analysis
- 5.6. Market Analysis, Insights and Forecast - by Region
- 5.6.1. North America
- 5.6.2. South America
- 5.6.3. Europe
- 5.6.4. Middle East & Africa
- 5.6.5. Asia Pacific
- 5.1. Market Analysis, Insights and Forecast - by Production Analysis
- 6. North America US Furniture Market Analysis, Insights and Forecast, 2019-2031
- 6.1. Market Analysis, Insights and Forecast - by Production Analysis
- 6.2. Market Analysis, Insights and Forecast - by Consumption Analysis
- 6.3. Market Analysis, Insights and Forecast - by Import Market Analysis (Value & Volume)
- 6.4. Market Analysis, Insights and Forecast - by Export Market Analysis (Value & Volume)
- 6.5. Market Analysis, Insights and Forecast - by Price Trend Analysis
- 6.1. Market Analysis, Insights and Forecast - by Production Analysis
- 7. South America US Furniture Market Analysis, Insights and Forecast, 2019-2031
- 7.1. Market Analysis, Insights and Forecast - by Production Analysis
- 7.2. Market Analysis, Insights and Forecast - by Consumption Analysis
- 7.3. Market Analysis, Insights and Forecast - by Import Market Analysis (Value & Volume)
- 7.4. Market Analysis, Insights and Forecast - by Export Market Analysis (Value & Volume)
- 7.5. Market Analysis, Insights and Forecast - by Price Trend Analysis
- 7.1. Market Analysis, Insights and Forecast - by Production Analysis
- 8. Europe US Furniture Market Analysis, Insights and Forecast, 2019-2031
- 8.1. Market Analysis, Insights and Forecast - by Production Analysis
- 8.2. Market Analysis, Insights and Forecast - by Consumption Analysis
- 8.3. Market Analysis, Insights and Forecast - by Import Market Analysis (Value & Volume)
- 8.4. Market Analysis, Insights and Forecast - by Export Market Analysis (Value & Volume)
- 8.5. Market Analysis, Insights and Forecast - by Price Trend Analysis
- 8.1. Market Analysis, Insights and Forecast - by Production Analysis
- 9. Middle East & Africa US Furniture Market Analysis, Insights and Forecast, 2019-2031
- 9.1. Market Analysis, Insights and Forecast - by Production Analysis
- 9.2. Market Analysis, Insights and Forecast - by Consumption Analysis
- 9.3. Market Analysis, Insights and Forecast - by Import Market Analysis (Value & Volume)
- 9.4. Market Analysis, Insights and Forecast - by Export Market Analysis (Value & Volume)
- 9.5. Market Analysis, Insights and Forecast - by Price Trend Analysis
- 9.1. Market Analysis, Insights and Forecast - by Production Analysis
- 10. Asia Pacific US Furniture Market Analysis, Insights and Forecast, 2019-2031
- 10.1. Market Analysis, Insights and Forecast - by Production Analysis
- 10.2. Market Analysis, Insights and Forecast - by Consumption Analysis
- 10.3. Market Analysis, Insights and Forecast - by Import Market Analysis (Value & Volume)
- 10.4. Market Analysis, Insights and Forecast - by Export Market Analysis (Value & Volume)
- 10.5. Market Analysis, Insights and Forecast - by Price Trend Analysis
- 10.1. Market Analysis, Insights and Forecast - by Production Analysis
- 11. Northeast US Furniture Market Analysis, Insights and Forecast, 2019-2031
- 12. Southeast US Furniture Market Analysis, Insights and Forecast, 2019-2031
- 13. Midwest US Furniture Market Analysis, Insights and Forecast, 2019-2031
- 14. Southwest US Furniture Market Analysis, Insights and Forecast, 2019-2031
- 15. West US Furniture Market Analysis, Insights and Forecast, 2019-2031
- 16. Competitive Analysis
- 16.1. Global Market Share Analysis 2024
- 16.2. Company Profiles
- 16.2.1 5 Inter IKEA Holding SA**List Not Exhaustive
- 16.2.1.1. Overview
- 16.2.1.2. Products
- 16.2.1.3. SWOT Analysis
- 16.2.1.4. Recent Developments
- 16.2.1.5. Financials (Based on Availability)
- 16.2.2 2 American Signature Inc
- 16.2.2.1. Overview
- 16.2.2.2. Products
- 16.2.2.3. SWOT Analysis
- 16.2.2.4. Recent Developments
- 16.2.2.5. Financials (Based on Availability)
- 16.2.3 2 Rooms to Go Inc
- 16.2.3.1. Overview
- 16.2.3.2. Products
- 16.2.3.3. SWOT Analysis
- 16.2.3.4. Recent Developments
- 16.2.3.5. Financials (Based on Availability)
- 16.2.4 Retailers
- 16.2.4.1. Overview
- 16.2.4.2. Products
- 16.2.4.3. SWOT Analysis
- 16.2.4.4. Recent Developments
- 16.2.4.5. Financials (Based on Availability)
- 16.2.5 4 Wayfair Inc *
- 16.2.5.1. Overview
- 16.2.5.2. Products
- 16.2.5.3. SWOT Analysis
- 16.2.5.4. Recent Developments
- 16.2.5.5. Financials (Based on Availability)
- 16.2.6 3 Crate and Barrel
- 16.2.6.1. Overview
- 16.2.6.2. Products
- 16.2.6.3. SWOT Analysis
- 16.2.6.4. Recent Developments
- 16.2.6.5. Financials (Based on Availability)
- 16.2.7 3 Williams-Sonoma Inc
- 16.2.7.1. Overview
- 16.2.7.2. Products
- 16.2.7.3. SWOT Analysis
- 16.2.7.4. Recent Developments
- 16.2.7.5. Financials (Based on Availability)
- 16.2.8 4 La-Z-Boy
- 16.2.8.1. Overview
- 16.2.8.2. Products
- 16.2.8.3. SWOT Analysis
- 16.2.8.4. Recent Developments
- 16.2.8.5. Financials (Based on Availability)
- 16.2.9 1 Ashley Furniture Store
- 16.2.9.1. Overview
- 16.2.9.2. Products
- 16.2.9.3. SWOT Analysis
- 16.2.9.4. Recent Developments
- 16.2.9.5. Financials (Based on Availability)
- 16.2.10 1 Bed Bath & Beyond Inc
- 16.2.10.1. Overview
- 16.2.10.2. Products
- 16.2.10.3. SWOT Analysis
- 16.2.10.4. Recent Developments
- 16.2.10.5. Financials (Based on Availability)
- 16.2.11 Manufacturers
- 16.2.11.1. Overview
- 16.2.11.2. Products
- 16.2.11.3. SWOT Analysis
- 16.2.11.4. Recent Developments
- 16.2.11.5. Financials (Based on Availability)
- 16.2.1 5 Inter IKEA Holding SA**List Not Exhaustive
List of Figures
- Figure 1: Global US Furniture Market Revenue Breakdown (Million, %) by Region 2024 & 2032
- Figure 2: United states US Furniture Market Revenue (Million), by Country 2024 & 2032
- Figure 3: United states US Furniture Market Revenue Share (%), by Country 2024 & 2032
- Figure 4: North America US Furniture Market Revenue (Million), by Production Analysis 2024 & 2032
- Figure 5: North America US Furniture Market Revenue Share (%), by Production Analysis 2024 & 2032
- Figure 6: North America US Furniture Market Revenue (Million), by Consumption Analysis 2024 & 2032
- Figure 7: North America US Furniture Market Revenue Share (%), by Consumption Analysis 2024 & 2032
- Figure 8: North America US Furniture Market Revenue (Million), by Import Market Analysis (Value & Volume) 2024 & 2032
- Figure 9: North America US Furniture Market Revenue Share (%), by Import Market Analysis (Value & Volume) 2024 & 2032
- Figure 10: North America US Furniture Market Revenue (Million), by Export Market Analysis (Value & Volume) 2024 & 2032
- Figure 11: North America US Furniture Market Revenue Share (%), by Export Market Analysis (Value & Volume) 2024 & 2032
- Figure 12: North America US Furniture Market Revenue (Million), by Price Trend Analysis 2024 & 2032
- Figure 13: North America US Furniture Market Revenue Share (%), by Price Trend Analysis 2024 & 2032
- Figure 14: North America US Furniture Market Revenue (Million), by Country 2024 & 2032
- Figure 15: North America US Furniture Market Revenue Share (%), by Country 2024 & 2032
- Figure 16: South America US Furniture Market Revenue (Million), by Production Analysis 2024 & 2032
- Figure 17: South America US Furniture Market Revenue Share (%), by Production Analysis 2024 & 2032
- Figure 18: South America US Furniture Market Revenue (Million), by Consumption Analysis 2024 & 2032
- Figure 19: South America US Furniture Market Revenue Share (%), by Consumption Analysis 2024 & 2032
- Figure 20: South America US Furniture Market Revenue (Million), by Import Market Analysis (Value & Volume) 2024 & 2032
- Figure 21: South America US Furniture Market Revenue Share (%), by Import Market Analysis (Value & Volume) 2024 & 2032
- Figure 22: South America US Furniture Market Revenue (Million), by Export Market Analysis (Value & Volume) 2024 & 2032
- Figure 23: South America US Furniture Market Revenue Share (%), by Export Market Analysis (Value & Volume) 2024 & 2032
- Figure 24: South America US Furniture Market Revenue (Million), by Price Trend Analysis 2024 & 2032
- Figure 25: South America US Furniture Market Revenue Share (%), by Price Trend Analysis 2024 & 2032
- Figure 26: South America US Furniture Market Revenue (Million), by Country 2024 & 2032
- Figure 27: South America US Furniture Market Revenue Share (%), by Country 2024 & 2032
- Figure 28: Europe US Furniture Market Revenue (Million), by Production Analysis 2024 & 2032
- Figure 29: Europe US Furniture Market Revenue Share (%), by Production Analysis 2024 & 2032
- Figure 30: Europe US Furniture Market Revenue (Million), by Consumption Analysis 2024 & 2032
- Figure 31: Europe US Furniture Market Revenue Share (%), by Consumption Analysis 2024 & 2032
- Figure 32: Europe US Furniture Market Revenue (Million), by Import Market Analysis (Value & Volume) 2024 & 2032
- Figure 33: Europe US Furniture Market Revenue Share (%), by Import Market Analysis (Value & Volume) 2024 & 2032
- Figure 34: Europe US Furniture Market Revenue (Million), by Export Market Analysis (Value & Volume) 2024 & 2032
- Figure 35: Europe US Furniture Market Revenue Share (%), by Export Market Analysis (Value & Volume) 2024 & 2032
- Figure 36: Europe US Furniture Market Revenue (Million), by Price Trend Analysis 2024 & 2032
- Figure 37: Europe US Furniture Market Revenue Share (%), by Price Trend Analysis 2024 & 2032
- Figure 38: Europe US Furniture Market Revenue (Million), by Country 2024 & 2032
- Figure 39: Europe US Furniture Market Revenue Share (%), by Country 2024 & 2032
- Figure 40: Middle East & Africa US Furniture Market Revenue (Million), by Production Analysis 2024 & 2032
- Figure 41: Middle East & Africa US Furniture Market Revenue Share (%), by Production Analysis 2024 & 2032
- Figure 42: Middle East & Africa US Furniture Market Revenue (Million), by Consumption Analysis 2024 & 2032
- Figure 43: Middle East & Africa US Furniture Market Revenue Share (%), by Consumption Analysis 2024 & 2032
- Figure 44: Middle East & Africa US Furniture Market Revenue (Million), by Import Market Analysis (Value & Volume) 2024 & 2032
- Figure 45: Middle East & Africa US Furniture Market Revenue Share (%), by Import Market Analysis (Value & Volume) 2024 & 2032
- Figure 46: Middle East & Africa US Furniture Market Revenue (Million), by Export Market Analysis (Value & Volume) 2024 & 2032
- Figure 47: Middle East & Africa US Furniture Market Revenue Share (%), by Export Market Analysis (Value & Volume) 2024 & 2032
- Figure 48: Middle East & Africa US Furniture Market Revenue (Million), by Price Trend Analysis 2024 & 2032
- Figure 49: Middle East & Africa US Furniture Market Revenue Share (%), by Price Trend Analysis 2024 & 2032
- Figure 50: Middle East & Africa US Furniture Market Revenue (Million), by Country 2024 & 2032
- Figure 51: Middle East & Africa US Furniture Market Revenue Share (%), by Country 2024 & 2032
- Figure 52: Asia Pacific US Furniture Market Revenue (Million), by Production Analysis 2024 & 2032
- Figure 53: Asia Pacific US Furniture Market Revenue Share (%), by Production Analysis 2024 & 2032
- Figure 54: Asia Pacific US Furniture Market Revenue (Million), by Consumption Analysis 2024 & 2032
- Figure 55: Asia Pacific US Furniture Market Revenue Share (%), by Consumption Analysis 2024 & 2032
- Figure 56: Asia Pacific US Furniture Market Revenue (Million), by Import Market Analysis (Value & Volume) 2024 & 2032
- Figure 57: Asia Pacific US Furniture Market Revenue Share (%), by Import Market Analysis (Value & Volume) 2024 & 2032
- Figure 58: Asia Pacific US Furniture Market Revenue (Million), by Export Market Analysis (Value & Volume) 2024 & 2032
- Figure 59: Asia Pacific US Furniture Market Revenue Share (%), by Export Market Analysis (Value & Volume) 2024 & 2032
- Figure 60: Asia Pacific US Furniture Market Revenue (Million), by Price Trend Analysis 2024 & 2032
- Figure 61: Asia Pacific US Furniture Market Revenue Share (%), by Price Trend Analysis 2024 & 2032
- Figure 62: Asia Pacific US Furniture Market Revenue (Million), by Country 2024 & 2032
- Figure 63: Asia Pacific US Furniture Market Revenue Share (%), by Country 2024 & 2032
List of Tables
- Table 1: Global US Furniture Market Revenue Million Forecast, by Region 2019 & 2032
- Table 2: Global US Furniture Market Revenue Million Forecast, by Production Analysis 2019 & 2032
- Table 3: Global US Furniture Market Revenue Million Forecast, by Consumption Analysis 2019 & 2032
- Table 4: Global US Furniture Market Revenue Million Forecast, by Import Market Analysis (Value & Volume) 2019 & 2032
- Table 5: Global US Furniture Market Revenue Million Forecast, by Export Market Analysis (Value & Volume) 2019 & 2032
- Table 6: Global US Furniture Market Revenue Million Forecast, by Price Trend Analysis 2019 & 2032
- Table 7: Global US Furniture Market Revenue Million Forecast, by Region 2019 & 2032
- Table 8: Global US Furniture Market Revenue Million Forecast, by Country 2019 & 2032
- Table 9: Northeast US Furniture Market Revenue (Million) Forecast, by Application 2019 & 2032
- Table 10: Southeast US Furniture Market Revenue (Million) Forecast, by Application 2019 & 2032
- Table 11: Midwest US Furniture Market Revenue (Million) Forecast, by Application 2019 & 2032
- Table 12: Southwest US Furniture Market Revenue (Million) Forecast, by Application 2019 & 2032
- Table 13: West US Furniture Market Revenue (Million) Forecast, by Application 2019 & 2032
- Table 14: Global US Furniture Market Revenue Million Forecast, by Production Analysis 2019 & 2032
- Table 15: Global US Furniture Market Revenue Million Forecast, by Consumption Analysis 2019 & 2032
- Table 16: Global US Furniture Market Revenue Million Forecast, by Import Market Analysis (Value & Volume) 2019 & 2032
- Table 17: Global US Furniture Market Revenue Million Forecast, by Export Market Analysis (Value & Volume) 2019 & 2032
- Table 18: Global US Furniture Market Revenue Million Forecast, by Price Trend Analysis 2019 & 2032
- Table 19: Global US Furniture Market Revenue Million Forecast, by Country 2019 & 2032
- Table 20: United States US Furniture Market Revenue (Million) Forecast, by Application 2019 & 2032
- Table 21: Canada US Furniture Market Revenue (Million) Forecast, by Application 2019 & 2032
- Table 22: Mexico US Furniture Market Revenue (Million) Forecast, by Application 2019 & 2032
- Table 23: Global US Furniture Market Revenue Million Forecast, by Production Analysis 2019 & 2032
- Table 24: Global US Furniture Market Revenue Million Forecast, by Consumption Analysis 2019 & 2032
- Table 25: Global US Furniture Market Revenue Million Forecast, by Import Market Analysis (Value & Volume) 2019 & 2032
- Table 26: Global US Furniture Market Revenue Million Forecast, by Export Market Analysis (Value & Volume) 2019 & 2032
- Table 27: Global US Furniture Market Revenue Million Forecast, by Price Trend Analysis 2019 & 2032
- Table 28: Global US Furniture Market Revenue Million Forecast, by Country 2019 & 2032
- Table 29: Brazil US Furniture Market Revenue (Million) Forecast, by Application 2019 & 2032
- Table 30: Argentina US Furniture Market Revenue (Million) Forecast, by Application 2019 & 2032
- Table 31: Rest of South America US Furniture Market Revenue (Million) Forecast, by Application 2019 & 2032
- Table 32: Global US Furniture Market Revenue Million Forecast, by Production Analysis 2019 & 2032
- Table 33: Global US Furniture Market Revenue Million Forecast, by Consumption Analysis 2019 & 2032
- Table 34: Global US Furniture Market Revenue Million Forecast, by Import Market Analysis (Value & Volume) 2019 & 2032
- Table 35: Global US Furniture Market Revenue Million Forecast, by Export Market Analysis (Value & Volume) 2019 & 2032
- Table 36: Global US Furniture Market Revenue Million Forecast, by Price Trend Analysis 2019 & 2032
- Table 37: Global US Furniture Market Revenue Million Forecast, by Country 2019 & 2032
- Table 38: United Kingdom US Furniture Market Revenue (Million) Forecast, by Application 2019 & 2032
- Table 39: Germany US Furniture Market Revenue (Million) Forecast, by Application 2019 & 2032
- Table 40: France US Furniture Market Revenue (Million) Forecast, by Application 2019 & 2032
- Table 41: Italy US Furniture Market Revenue (Million) Forecast, by Application 2019 & 2032
- Table 42: Spain US Furniture Market Revenue (Million) Forecast, by Application 2019 & 2032
- Table 43: Russia US Furniture Market Revenue (Million) Forecast, by Application 2019 & 2032
- Table 44: Benelux US Furniture Market Revenue (Million) Forecast, by Application 2019 & 2032
- Table 45: Nordics US Furniture Market Revenue (Million) Forecast, by Application 2019 & 2032
- Table 46: Rest of Europe US Furniture Market Revenue (Million) Forecast, by Application 2019 & 2032
- Table 47: Global US Furniture Market Revenue Million Forecast, by Production Analysis 2019 & 2032
- Table 48: Global US Furniture Market Revenue Million Forecast, by Consumption Analysis 2019 & 2032
- Table 49: Global US Furniture Market Revenue Million Forecast, by Import Market Analysis (Value & Volume) 2019 & 2032
- Table 50: Global US Furniture Market Revenue Million Forecast, by Export Market Analysis (Value & Volume) 2019 & 2032
- Table 51: Global US Furniture Market Revenue Million Forecast, by Price Trend Analysis 2019 & 2032
- Table 52: Global US Furniture Market Revenue Million Forecast, by Country 2019 & 2032
- Table 53: Turkey US Furniture Market Revenue (Million) Forecast, by Application 2019 & 2032
- Table 54: Israel US Furniture Market Revenue (Million) Forecast, by Application 2019 & 2032
- Table 55: GCC US Furniture Market Revenue (Million) Forecast, by Application 2019 & 2032
- Table 56: North Africa US Furniture Market Revenue (Million) Forecast, by Application 2019 & 2032
- Table 57: South Africa US Furniture Market Revenue (Million) Forecast, by Application 2019 & 2032
- Table 58: Rest of Middle East & Africa US Furniture Market Revenue (Million) Forecast, by Application 2019 & 2032
- Table 59: Global US Furniture Market Revenue Million Forecast, by Production Analysis 2019 & 2032
- Table 60: Global US Furniture Market Revenue Million Forecast, by Consumption Analysis 2019 & 2032
- Table 61: Global US Furniture Market Revenue Million Forecast, by Import Market Analysis (Value & Volume) 2019 & 2032
- Table 62: Global US Furniture Market Revenue Million Forecast, by Export Market Analysis (Value & Volume) 2019 & 2032
- Table 63: Global US Furniture Market Revenue Million Forecast, by Price Trend Analysis 2019 & 2032
- Table 64: Global US Furniture Market Revenue Million Forecast, by Country 2019 & 2032
- Table 65: China US Furniture Market Revenue (Million) Forecast, by Application 2019 & 2032
- Table 66: India US Furniture Market Revenue (Million) Forecast, by Application 2019 & 2032
- Table 67: Japan US Furniture Market Revenue (Million) Forecast, by Application 2019 & 2032
- Table 68: South Korea US Furniture Market Revenue (Million) Forecast, by Application 2019 & 2032
- Table 69: ASEAN US Furniture Market Revenue (Million) Forecast, by Application 2019 & 2032
- Table 70: Oceania US Furniture Market Revenue (Million) Forecast, by Application 2019 & 2032
- Table 71: Rest of Asia Pacific US Furniture Market Revenue (Million) Forecast, by Application 2019 & 2032
Frequently Asked Questions
1. What is the projected Compound Annual Growth Rate (CAGR) of the US Furniture Market?
The projected CAGR is approximately > 3.00%.
2. Which companies are prominent players in the US Furniture Market?
Key companies in the market include 5 Inter IKEA Holding SA**List Not Exhaustive, 2 American Signature Inc, 2 Rooms to Go Inc, Retailers, 4 Wayfair Inc *, 3 Crate and Barrel, 3 Williams-Sonoma Inc, 4 La-Z-Boy, 1 Ashley Furniture Store, 1 Bed Bath & Beyond Inc, Manufacturers.
3. What are the main segments of the US Furniture Market?
The market segments include Production Analysis, Consumption Analysis, Import Market Analysis (Value & Volume), Export Market Analysis (Value & Volume), Price Trend Analysis.
4. Can you provide details about the market size?
The market size is estimated to be USD XX Million as of 2022.
5. What are some drivers contributing to market growth?
Rising Urbanization and Population Growth; Growth in the Construction Industry is Driving the Market.
6. What are the notable trends driving market growth?
Growing Sales of Bedroom Furniture is Driving the Market.
7. Are there any restraints impacting market growth?
Economic Uncertainty; Increasing Competition in the Market.
8. Can you provide examples of recent developments in the market?
N/A
9. What pricing options are available for accessing the report?
Pricing options include single-user, multi-user, and enterprise licenses priced at USD 3800, USD 4500, and USD 5800 respectively.
10. Is the market size provided in terms of value or volume?
The market size is provided in terms of value, measured in Million.
11. Are there any specific market keywords associated with the report?
Yes, the market keyword associated with the report is "US Furniture Market," which aids in identifying and referencing the specific market segment covered.
12. How do I determine which pricing option suits my needs best?
The pricing options vary based on user requirements and access needs. Individual users may opt for single-user licenses, while businesses requiring broader access may choose multi-user or enterprise licenses for cost-effective access to the report.
13. Are there any additional resources or data provided in the US Furniture Market report?
While the report offers comprehensive insights, it's advisable to review the specific contents or supplementary materials provided to ascertain if additional resources or data are available.
14. How can I stay updated on further developments or reports in the US Furniture Market?
To stay informed about further developments, trends, and reports in the US Furniture Market, consider subscribing to industry newsletters, following relevant companies and organizations, or regularly checking reputable industry news sources and publications.
Methodology
Step 1 - Identification of Relevant Samples Size from Population Database


Step 2 - Approaches for Defining Global Market Size (Value, Volume* & Price*)

Note*: In applicable scenarios
Step 3 - Data Sources
Primary Research
- Web Analytics
- Survey Reports
- Research Institute
- Latest Research Reports
- Opinion Leaders
Secondary Research
- Annual Reports
- White Paper
- Latest Press Release
- Industry Association
- Paid Database
- Investor Presentations

Step 4 - Data Triangulation
Involves using different sources of information in order to increase the validity of a study
These sources are likely to be stakeholders in a program - participants, other researchers, program staff, other community members, and so on.
Then we put all data in single framework & apply various statistical tools to find out the dynamic on the market.
During the analysis stage, feedback from the stakeholder groups would be compared to determine areas of agreement as well as areas of divergence
