

Key Insights
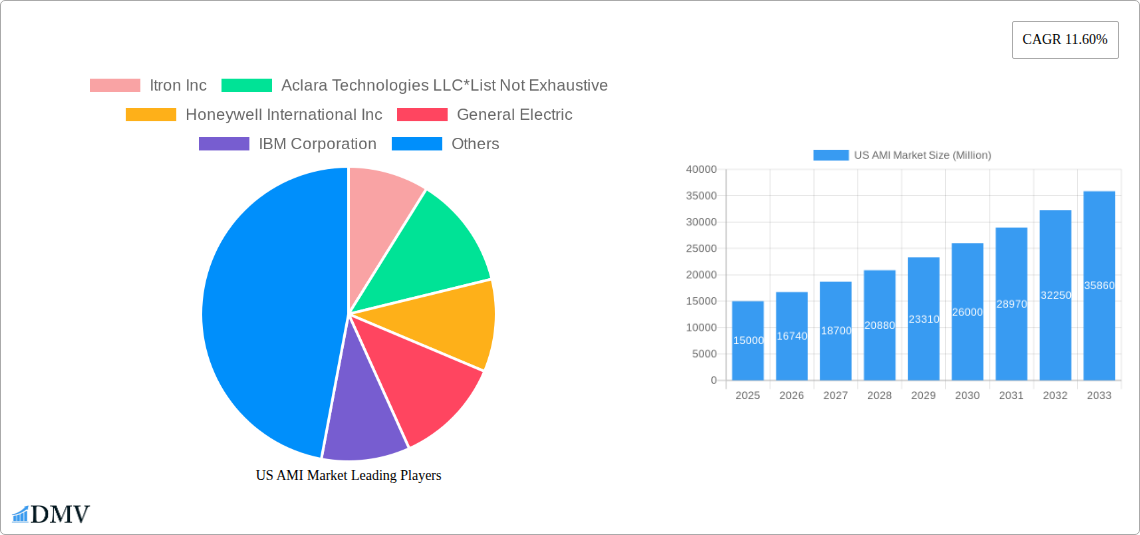
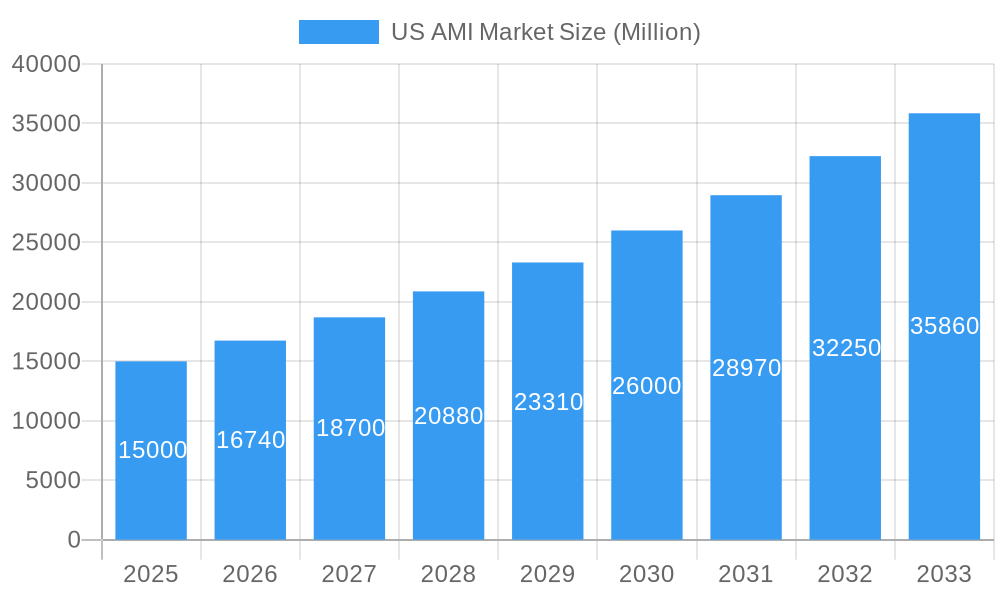
The United States Advanced Metering Infrastructure (AMI) market is poised for significant expansion, driven by escalating demand for energy efficiency, enhanced grid management, and the seamless integration of renewable energy sources. The market, encompassing smart metering devices (electricity, water, gas), comprehensive solutions (software, services), and diverse end-users (residential, commercial, industrial), is forecasted to achieve a Compound Annual Growth Rate (CAGR) of 14.6%. This growth trajectory, with a base year of 2024, is propelled by supportive government policies advocating for smart grid modernization, alongside growing consumer consciousness regarding energy conservation and the resultant cost-saving opportunities from optimized energy consumption. Leading industry players, including Itron, Aclara Technologies, Honeywell, and General Electric, are making substantial investments in cutting-edge technologies and broadening their service portfolios to address this surging market demand. The software segment, particularly meter data management and analytics, is witnessing remarkable traction due to the imperative for real-time data insights to optimize grid operations and elevate customer service standards. Further market impetus is expected from the accelerated deployment of smart meters across the commercial and industrial sectors, driven by the critical need for precise energy consumption monitoring and robust cost control in larger facilities. The continuous evolution of sophisticated AMI solutions, incorporating integration with IoT platforms and AI-powered analytics, will remain a pivotal market driver. The current market size stands at an estimated 5.1 billion.
US AMI Market Market Size (In Billion)
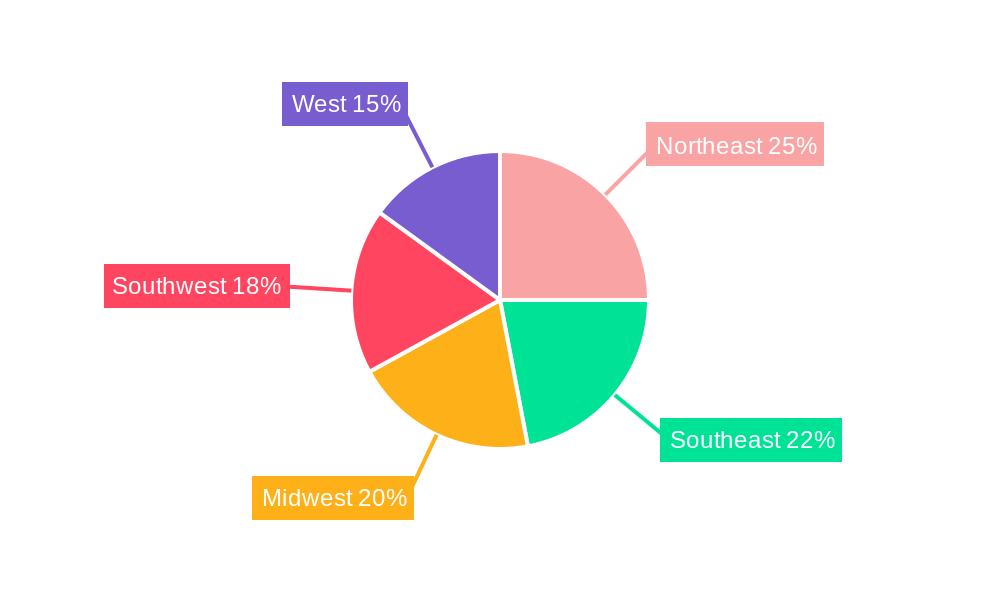
The geographical distribution of the US AMI market reflects variations in infrastructure development and governmental support across states. While precise market share data by region (Northeast, Southeast, Midwest, Southwest, West) is not yet available, it is anticipated that states with ambitious renewable energy targets and established smart grid initiatives will experience accelerated adoption rates. The residential sector currently constitutes a significant market share; however, the commercial and industrial segments are projected to exhibit higher growth rates in the coming years, owing to the substantial potential for cost reduction and operational efficiency gains facilitated by AMI implementation. Factors such as implementation costs, cybersecurity vulnerabilities, and regulatory challenges present potential restraints to market expansion. Nevertheless, ongoing technological advancements and favorable governmental policies are actively mitigating these concerns, ensuring a positive long-term outlook for the US AMI market with sustained growth anticipated throughout the forecast period.
US AMI Market Company Market Share
US AMI Market: A Comprehensive Market Report (2019-2033)
This insightful report provides a detailed analysis of the US Advanced Metering Infrastructure (AMI) market, offering a comprehensive overview of its current state, future trajectory, and key players. The study covers the period from 2019 to 2033, with a focus on the forecast period from 2025 to 2033 and a base year of 2025. This report is essential for stakeholders seeking to understand the market dynamics, identify growth opportunities, and make informed strategic decisions within the rapidly evolving US AMI landscape. The total market value in 2025 is estimated at $XX Million.
US AMI Market Composition & Trends
The US AMI market is characterized by a moderately concentrated landscape, with key players like Itron Inc, Aclara Technologies LLC, Honeywell International Inc, and General Electric holding significant market share. However, the market is witnessing increased competition from emerging players and technology providers. Market share distribution in 2025 is estimated as follows: Itron Inc (XX%), Aclara Technologies LLC (XX%), Honeywell International Inc (XX%), General Electric (XX%), and Others (XX%). Innovation in areas like narrowband IoT (NB-IoT), LoRaWAN, and cellular technologies is driving market growth. Regulatory mandates promoting smart grid initiatives and energy efficiency are significant catalysts. Substitute products, such as traditional meter reading methods, are losing ground due to the cost-effectiveness and efficiency benefits of AMI. The residential segment holds the largest market share, driven by increasing adoption of smart meters. M&A activities have been moderate, with deal values totaling approximately $XX Million in the last five years.
- Market Concentration: Moderately concentrated, with key players holding significant shares.
- Innovation Catalysts: NB-IoT, LoRaWAN, cellular technologies.
- Regulatory Landscape: Favorable, with mandates promoting smart grid deployment.
- Substitute Products: Traditional meter reading (declining market share).
- End-User Profiles: Dominated by the residential segment, followed by commercial and industrial.
- M&A Activity: Moderate, with a total deal value of approximately $XX Million over the past five years.
US AMI Market Industry Evolution
The US AMI market has witnessed significant growth over the historical period (2019-2024), driven by increasing demand for improved energy efficiency, reduced operational costs, and enhanced grid management capabilities. The market is projected to experience a Compound Annual Growth Rate (CAGR) of XX% during the forecast period (2025-2033). This growth is fueled by technological advancements in communication technologies, data analytics capabilities, and the integration of AMI systems with other smart grid technologies. Consumer demand is shifting towards sophisticated solutions providing real-time energy consumption data and personalized energy management tools. The adoption rate of AMI systems has steadily increased, reaching XX% in the residential sector and XX% in the commercial sector in 2024. Further growth is anticipated with the increasing focus on renewable energy integration and grid modernization.
Leading Regions, Countries, or Segments in US AMI Market
The residential segment constitutes the largest share of the US AMI market, driven by a high number of households and increased consumer awareness of energy efficiency. The electricity segment dominates within the smart metering devices category, followed by gas and water. Meter Data Management (MDM) software is the leading software segment, as utilities require efficient tools to manage vast amounts of data from smart meters. California and Texas stand out as leading states due to strong regulatory support, substantial investments in grid modernization, and a high concentration of utilities.
- Key Drivers for Residential Segment Dominance: High number of households, increasing energy awareness, and government incentives.
- Key Drivers for Electricity Segment Dominance: Strong regulatory push for smart grid modernization and increased demand for efficient electricity grid management.
- Key Drivers for MDM Software Dominance: Need for efficient data handling and analysis to optimize grid operations.
- Key Drivers for California and Texas: Strong regulatory support, significant investments in grid modernization projects, and a high concentration of utilities.
US AMI Market Product Innovations
Recent innovations in the US Advanced Metering Infrastructure (AMI) market are revolutionizing how utilities manage energy distribution and consumption. Leading advancements include the deployment of next-generation metering technologies featuring robust communication protocols such as LTE-M and NB-IoT, enabling seamless and reliable data transmission. Complementing these hardware upgrades are sophisticated data analytics platforms that provide utilities with granular, real-time insights into energy consumption patterns, enabling proactive grid management and personalized customer offerings. Furthermore, the seamless integration of AMI systems with other critical smart grid technologies, particularly Distributed Energy Resources (DER) management systems, is unlocking new levels of grid flexibility and resilience. These combined advancements are driving enhanced reliability, significantly improving metering accuracy, realizing substantial reductions in operational costs, and empowering utilities with superior grid management capabilities.
Propelling Factors for US AMI Market Growth
The accelerated growth trajectory of the US AMI market is being propelled by a confluence of potent factors. Foremost among these are increasingly stringent government regulations mandating the widespread deployment of smart meters, driven by national energy security and efficiency goals. The persistent rise in energy costs, coupled with a growing societal emphasis on energy efficiency and conservation, is creating a strong demand for the intelligent monitoring and control capabilities that AMI provides. Rapid advancements in communication technologies are making cost-effective, high-bandwidth data transmission more accessible than ever before. Moreover, the escalating adoption of advanced data analytics is proving instrumental in optimizing grid management, reducing energy losses, and fostering deeper, more responsive customer engagement through personalized energy insights and services.
Obstacles in the US AMI Market Market
Challenges facing the US AMI market include the high initial investment costs associated with deploying AMI systems, concerns over data security and privacy, potential supply chain disruptions affecting the availability of critical components, and the competitive landscape leading to price pressure.
Future Opportunities in US AMI Market
The horizon for the US AMI market is brimming with promising opportunities. A significant area for expansion lies in extending AMI deployments into underserved rural areas, bridging the digital divide and bringing smart grid benefits to a wider population. The burgeoning integration of AMI with an array of other smart city technologies, from traffic management to environmental monitoring, presents a pathway to creating truly connected urban ecosystems. The demand for increasingly sophisticated data analytics solutions, capable of extracting actionable intelligence from vast datasets, will continue to grow, fostering innovation in predictive maintenance and demand-response programs. Beyond the electricity sector, the growing adoption of AMI in water and gas utilities signifies a broadening market scope, promising integrated utility management and enhanced resource optimization across multiple essential services.
Major Players in the US AMI Market Ecosystem
- Itron Inc
- Aclara Technologies LLC
- Honeywell International Inc
- General Electric
- IBM Corporation
- Oncor Electric Delivery Company LLC
- NuriFlex Inc
- Cisco Systems Inc
- Mueller Systems LLC
- Eaton Corporation
Key Developments in US AMI Market Industry
- April 2022: Otter Tail Power Company has selected TRC Companies to lead the comprehensive integration of their AMI system, an ambitious project designed to encompass a vast geographical area spanning three states, aiming to modernize their infrastructure and improve service delivery.
- April 2021: Austin Utilities has successfully implemented Aclara Technologies' end-to-end AMI solution, a significant deployment covering 32,500 electric, gas, and water meters, enhancing operational efficiency and data accuracy across its diverse utility services.
- March 2021: Calaveras County Water District has partnered with Mueller Systems to deploy a robust AMI network designed to cover 13,000 endpoints, marking a crucial step towards intelligent water management and leak detection for the district.
Strategic US AMI Market Market Forecast
The US AMI market is poised for continued growth, driven by ongoing investments in grid modernization, expanding adoption across various utilities, and the emergence of advanced technologies that enhance data analytics and grid management capabilities. This presents significant opportunities for both established players and new entrants, creating a dynamic and evolving market landscape with substantial potential for expansion in the coming years.
US AMI Market Segmentation
-
1. Type
- 1.1. Smart Me
-
1.2. Solution
- 1.2.1. Meter Communication Infrastructure (Solution)
-
1.2.2. Software
- 1.2.2.1. Meter Data Management
- 1.2.2.2. Meter Data Analytics
- 1.2.2.3. Other Software Types
- 1.3. Services
-
2. End-user
- 2.1. Residential
- 2.2. Commercial
- 2.3. Industrial
US AMI Market Segmentation By Geography
-
1. North America
- 1.1. United States
- 1.2. Canada
- 1.3. Mexico
-
2. South America
- 2.1. Brazil
- 2.2. Argentina
- 2.3. Rest of South America
-
3. Europe
- 3.1. United Kingdom
- 3.2. Germany
- 3.3. France
- 3.4. Italy
- 3.5. Spain
- 3.6. Russia
- 3.7. Benelux
- 3.8. Nordics
- 3.9. Rest of Europe
-
4. Middle East & Africa
- 4.1. Turkey
- 4.2. Israel
- 4.3. GCC
- 4.4. North Africa
- 4.5. South Africa
- 4.6. Rest of Middle East & Africa
-
5. Asia Pacific
- 5.1. China
- 5.2. India
- 5.3. Japan
- 5.4. South Korea
- 5.5. ASEAN
- 5.6. Oceania
- 5.7. Rest of Asia Pacific
US AMI Market Regional Market Share
Geographic Coverage of US AMI Market
US AMI Market REPORT HIGHLIGHTS
| Aspects | Details |
|---|---|
| Study Period | 2020-2034 |
| Base Year | 2025 |
| Estimated Year | 2026 |
| Forecast Period | 2026-2034 |
| Historical Period | 2020-2025 |
| Growth Rate | CAGR of 14.6% from 2020-2034 |
| Segmentation |
|
Table of Contents
- 1. Introduction
- 1.1. Research Scope
- 1.2. Market Segmentation
- 1.3. Research Objective
- 1.4. Definitions and Assumptions
- 2. Executive Summary
- 2.1. Market Snapshot
- 3. Market Dynamics
- 3.1. Market Drivers
- 3.2. Market Restrains
- 3.3. Market Trends
- 3.4. Market Opportunities
- 4. Market Factor Analysis
- 4.1. Porters Five Forces
- 4.1.1. Bargaining Power of Suppliers
- 4.1.2. Bargaining Power of Buyers
- 4.1.3. Threat of New Entrants
- 4.1.4. Threat of Substitutes
- 4.1.5. Competitive Rivalry
- 4.2. PESTEL analysis
- 4.3. BCG Analysis
- 4.3.1. Stars (High Growth, High Market Share)
- 4.3.2. Cash Cows (Low Growth, High Market Share)
- 4.3.3. Question Mark (High Growth, Low Market Share)
- 4.3.4. Dogs (Low Growth, Low Market Share)
- 4.4. Ansoff Matrix Analysis
- 4.5. Supply Chain Analysis
- 4.6. Regulatory Landscape
- 4.7. Current Market Potential and Opportunity Assessment (TAM–SAM–SOM Framework)
- 4.8. DMV Analyst Note
- 4.1. Porters Five Forces
- 5. Market Analysis, Insights and Forecast 2021-2033
- 5.1. Market Analysis, Insights and Forecast - by Type
- 5.1.1. Smart Me
- 5.1.2. Solution
- 5.1.2.1. Meter Communication Infrastructure (Solution)
- 5.1.2.2. Software
- 5.1.2.2.1. Meter Data Management
- 5.1.2.2.2. Meter Data Analytics
- 5.1.2.2.3. Other Software Types
- 5.1.3. Services
- 5.2. Market Analysis, Insights and Forecast - by End-user
- 5.2.1. Residential
- 5.2.2. Commercial
- 5.2.3. Industrial
- 5.3. Market Analysis, Insights and Forecast - by Region
- 5.3.1. North America
- 5.3.2. South America
- 5.3.3. Europe
- 5.3.4. Middle East & Africa
- 5.3.5. Asia Pacific
- 5.1. Market Analysis, Insights and Forecast - by Type
- 6. Global US AMI Market Analysis, Insights and Forecast, 2021-2033
- 6.1. Market Analysis, Insights and Forecast - by Type
- 6.1.1. Smart Me
- 6.1.2. Solution
- 6.1.2.1. Meter Communication Infrastructure (Solution)
- 6.1.2.2. Software
- 6.1.2.2.1. Meter Data Management
- 6.1.2.2.2. Meter Data Analytics
- 6.1.2.2.3. Other Software Types
- 6.1.3. Services
- 6.2. Market Analysis, Insights and Forecast - by End-user
- 6.2.1. Residential
- 6.2.2. Commercial
- 6.2.3. Industrial
- 6.1. Market Analysis, Insights and Forecast - by Type
- 7. North America US AMI Market Analysis, Insights and Forecast, 2020-2032
- 7.1. Market Analysis, Insights and Forecast - by Type
- 7.1.1. Smart Me
- 7.1.2. Solution
- 7.1.2.1. Meter Communication Infrastructure (Solution)
- 7.1.2.2. Software
- 7.1.2.2.1. Meter Data Management
- 7.1.2.2.2. Meter Data Analytics
- 7.1.2.2.3. Other Software Types
- 7.1.3. Services
- 7.2. Market Analysis, Insights and Forecast - by End-user
- 7.2.1. Residential
- 7.2.2. Commercial
- 7.2.3. Industrial
- 7.1. Market Analysis, Insights and Forecast - by Type
- 8. South America US AMI Market Analysis, Insights and Forecast, 2020-2032
- 8.1. Market Analysis, Insights and Forecast - by Type
- 8.1.1. Smart Me
- 8.1.2. Solution
- 8.1.2.1. Meter Communication Infrastructure (Solution)
- 8.1.2.2. Software
- 8.1.2.2.1. Meter Data Management
- 8.1.2.2.2. Meter Data Analytics
- 8.1.2.2.3. Other Software Types
- 8.1.3. Services
- 8.2. Market Analysis, Insights and Forecast - by End-user
- 8.2.1. Residential
- 8.2.2. Commercial
- 8.2.3. Industrial
- 8.1. Market Analysis, Insights and Forecast - by Type
- 9. Europe US AMI Market Analysis, Insights and Forecast, 2020-2032
- 9.1. Market Analysis, Insights and Forecast - by Type
- 9.1.1. Smart Me
- 9.1.2. Solution
- 9.1.2.1. Meter Communication Infrastructure (Solution)
- 9.1.2.2. Software
- 9.1.2.2.1. Meter Data Management
- 9.1.2.2.2. Meter Data Analytics
- 9.1.2.2.3. Other Software Types
- 9.1.3. Services
- 9.2. Market Analysis, Insights and Forecast - by End-user
- 9.2.1. Residential
- 9.2.2. Commercial
- 9.2.3. Industrial
- 9.1. Market Analysis, Insights and Forecast - by Type
- 10. Middle East & Africa US AMI Market Analysis, Insights and Forecast, 2020-2032
- 10.1. Market Analysis, Insights and Forecast - by Type
- 10.1.1. Smart Me
- 10.1.2. Solution
- 10.1.2.1. Meter Communication Infrastructure (Solution)
- 10.1.2.2. Software
- 10.1.2.2.1. Meter Data Management
- 10.1.2.2.2. Meter Data Analytics
- 10.1.2.2.3. Other Software Types
- 10.1.3. Services
- 10.2. Market Analysis, Insights and Forecast - by End-user
- 10.2.1. Residential
- 10.2.2. Commercial
- 10.2.3. Industrial
- 10.1. Market Analysis, Insights and Forecast - by Type
- 11. Asia Pacific US AMI Market Analysis, Insights and Forecast, 2020-2032
- 11.1. Market Analysis, Insights and Forecast - by Type
- 11.1.1. Smart Me
- 11.1.2. Solution
- 11.1.2.1. Meter Communication Infrastructure (Solution)
- 11.1.2.2. Software
- 11.1.2.2.1. Meter Data Management
- 11.1.2.2.2. Meter Data Analytics
- 11.1.2.2.3. Other Software Types
- 11.1.3. Services
- 11.2. Market Analysis, Insights and Forecast - by End-user
- 11.2.1. Residential
- 11.2.2. Commercial
- 11.2.3. Industrial
- 11.1. Market Analysis, Insights and Forecast - by Type
- 12. Competitive Analysis
- 12.1. Company Profiles
- 12.1.1 Itron Inc
- 12.1.1.1. Company Overview
- 12.1.1.2. Products
- 12.1.1.3. Company Financials
- 12.1.1.4. SWOT Analysis
- 12.1.2 Aclara Technologies LLC*List Not Exhaustive
- 12.1.2.1. Company Overview
- 12.1.2.2. Products
- 12.1.2.3. Company Financials
- 12.1.2.4. SWOT Analysis
- 12.1.3 Honeywell International Inc
- 12.1.3.1. Company Overview
- 12.1.3.2. Products
- 12.1.3.3. Company Financials
- 12.1.3.4. SWOT Analysis
- 12.1.4 General Electric
- 12.1.4.1. Company Overview
- 12.1.4.2. Products
- 12.1.4.3. Company Financials
- 12.1.4.4. SWOT Analysis
- 12.1.5 IBM Corporation
- 12.1.5.1. Company Overview
- 12.1.5.2. Products
- 12.1.5.3. Company Financials
- 12.1.5.4. SWOT Analysis
- 12.1.6 Oncor Electric Delivery Company LLC
- 12.1.6.1. Company Overview
- 12.1.6.2. Products
- 12.1.6.3. Company Financials
- 12.1.6.4. SWOT Analysis
- 12.1.7 NuriFlex Inc
- 12.1.7.1. Company Overview
- 12.1.7.2. Products
- 12.1.7.3. Company Financials
- 12.1.7.4. SWOT Analysis
- 12.1.8 Cisco Systems Inc
- 12.1.8.1. Company Overview
- 12.1.8.2. Products
- 12.1.8.3. Company Financials
- 12.1.8.4. SWOT Analysis
- 12.1.9 Mueller Systems LLC
- 12.1.9.1. Company Overview
- 12.1.9.2. Products
- 12.1.9.3. Company Financials
- 12.1.9.4. SWOT Analysis
- 12.1.10 Eaton Corporation
- 12.1.10.1. Company Overview
- 12.1.10.2. Products
- 12.1.10.3. Company Financials
- 12.1.10.4. SWOT Analysis
- 12.1.1 Itron Inc
- 12.2. Market Entropy
- 12.2.1 Company's Key Areas Served
- 12.2.2 Recent Developments
- 12.3. Company Market Share Analysis 2025
- 12.3.1 Top 5 Companies Market Share Analysis
- 12.3.2 Top 3 Companies Market Share Analysis
- 12.4. List of Potential Customers
- 13. Research Methodology
List of Figures
- Figure 1: Global US AMI Market Revenue Breakdown (billion, %) by Region 2025 & 2033
- Figure 2: North America US AMI Market Revenue (billion), by Type 2025 & 2033
- Figure 3: North America US AMI Market Revenue Share (%), by Type 2025 & 2033
- Figure 4: North America US AMI Market Revenue (billion), by End-user 2025 & 2033
- Figure 5: North America US AMI Market Revenue Share (%), by End-user 2025 & 2033
- Figure 6: North America US AMI Market Revenue (billion), by Country 2025 & 2033
- Figure 7: North America US AMI Market Revenue Share (%), by Country 2025 & 2033
- Figure 8: South America US AMI Market Revenue (billion), by Type 2025 & 2033
- Figure 9: South America US AMI Market Revenue Share (%), by Type 2025 & 2033
- Figure 10: South America US AMI Market Revenue (billion), by End-user 2025 & 2033
- Figure 11: South America US AMI Market Revenue Share (%), by End-user 2025 & 2033
- Figure 12: South America US AMI Market Revenue (billion), by Country 2025 & 2033
- Figure 13: South America US AMI Market Revenue Share (%), by Country 2025 & 2033
- Figure 14: Europe US AMI Market Revenue (billion), by Type 2025 & 2033
- Figure 15: Europe US AMI Market Revenue Share (%), by Type 2025 & 2033
- Figure 16: Europe US AMI Market Revenue (billion), by End-user 2025 & 2033
- Figure 17: Europe US AMI Market Revenue Share (%), by End-user 2025 & 2033
- Figure 18: Europe US AMI Market Revenue (billion), by Country 2025 & 2033
- Figure 19: Europe US AMI Market Revenue Share (%), by Country 2025 & 2033
- Figure 20: Middle East & Africa US AMI Market Revenue (billion), by Type 2025 & 2033
- Figure 21: Middle East & Africa US AMI Market Revenue Share (%), by Type 2025 & 2033
- Figure 22: Middle East & Africa US AMI Market Revenue (billion), by End-user 2025 & 2033
- Figure 23: Middle East & Africa US AMI Market Revenue Share (%), by End-user 2025 & 2033
- Figure 24: Middle East & Africa US AMI Market Revenue (billion), by Country 2025 & 2033
- Figure 25: Middle East & Africa US AMI Market Revenue Share (%), by Country 2025 & 2033
- Figure 26: Asia Pacific US AMI Market Revenue (billion), by Type 2025 & 2033
- Figure 27: Asia Pacific US AMI Market Revenue Share (%), by Type 2025 & 2033
- Figure 28: Asia Pacific US AMI Market Revenue (billion), by End-user 2025 & 2033
- Figure 29: Asia Pacific US AMI Market Revenue Share (%), by End-user 2025 & 2033
- Figure 30: Asia Pacific US AMI Market Revenue (billion), by Country 2025 & 2033
- Figure 31: Asia Pacific US AMI Market Revenue Share (%), by Country 2025 & 2033
List of Tables
- Table 1: Global US AMI Market Revenue billion Forecast, by Type 2020 & 2033
- Table 2: Global US AMI Market Revenue billion Forecast, by End-user 2020 & 2033
- Table 3: Global US AMI Market Revenue billion Forecast, by Region 2020 & 2033
- Table 4: Global US AMI Market Revenue billion Forecast, by Type 2020 & 2033
- Table 5: Global US AMI Market Revenue billion Forecast, by End-user 2020 & 2033
- Table 6: Global US AMI Market Revenue billion Forecast, by Country 2020 & 2033
- Table 7: United States US AMI Market Revenue (billion) Forecast, by Application 2020 & 2033
- Table 8: Canada US AMI Market Revenue (billion) Forecast, by Application 2020 & 2033
- Table 9: Mexico US AMI Market Revenue (billion) Forecast, by Application 2020 & 2033
- Table 10: Global US AMI Market Revenue billion Forecast, by Type 2020 & 2033
- Table 11: Global US AMI Market Revenue billion Forecast, by End-user 2020 & 2033
- Table 12: Global US AMI Market Revenue billion Forecast, by Country 2020 & 2033
- Table 13: Brazil US AMI Market Revenue (billion) Forecast, by Application 2020 & 2033
- Table 14: Argentina US AMI Market Revenue (billion) Forecast, by Application 2020 & 2033
- Table 15: Rest of South America US AMI Market Revenue (billion) Forecast, by Application 2020 & 2033
- Table 16: Global US AMI Market Revenue billion Forecast, by Type 2020 & 2033
- Table 17: Global US AMI Market Revenue billion Forecast, by End-user 2020 & 2033
- Table 18: Global US AMI Market Revenue billion Forecast, by Country 2020 & 2033
- Table 19: United Kingdom US AMI Market Revenue (billion) Forecast, by Application 2020 & 2033
- Table 20: Germany US AMI Market Revenue (billion) Forecast, by Application 2020 & 2033
- Table 21: France US AMI Market Revenue (billion) Forecast, by Application 2020 & 2033
- Table 22: Italy US AMI Market Revenue (billion) Forecast, by Application 2020 & 2033
- Table 23: Spain US AMI Market Revenue (billion) Forecast, by Application 2020 & 2033
- Table 24: Russia US AMI Market Revenue (billion) Forecast, by Application 2020 & 2033
- Table 25: Benelux US AMI Market Revenue (billion) Forecast, by Application 2020 & 2033
- Table 26: Nordics US AMI Market Revenue (billion) Forecast, by Application 2020 & 2033
- Table 27: Rest of Europe US AMI Market Revenue (billion) Forecast, by Application 2020 & 2033
- Table 28: Global US AMI Market Revenue billion Forecast, by Type 2020 & 2033
- Table 29: Global US AMI Market Revenue billion Forecast, by End-user 2020 & 2033
- Table 30: Global US AMI Market Revenue billion Forecast, by Country 2020 & 2033
- Table 31: Turkey US AMI Market Revenue (billion) Forecast, by Application 2020 & 2033
- Table 32: Israel US AMI Market Revenue (billion) Forecast, by Application 2020 & 2033
- Table 33: GCC US AMI Market Revenue (billion) Forecast, by Application 2020 & 2033
- Table 34: North Africa US AMI Market Revenue (billion) Forecast, by Application 2020 & 2033
- Table 35: South Africa US AMI Market Revenue (billion) Forecast, by Application 2020 & 2033
- Table 36: Rest of Middle East & Africa US AMI Market Revenue (billion) Forecast, by Application 2020 & 2033
- Table 37: Global US AMI Market Revenue billion Forecast, by Type 2020 & 2033
- Table 38: Global US AMI Market Revenue billion Forecast, by End-user 2020 & 2033
- Table 39: Global US AMI Market Revenue billion Forecast, by Country 2020 & 2033
- Table 40: China US AMI Market Revenue (billion) Forecast, by Application 2020 & 2033
- Table 41: India US AMI Market Revenue (billion) Forecast, by Application 2020 & 2033
- Table 42: Japan US AMI Market Revenue (billion) Forecast, by Application 2020 & 2033
- Table 43: South Korea US AMI Market Revenue (billion) Forecast, by Application 2020 & 2033
- Table 44: ASEAN US AMI Market Revenue (billion) Forecast, by Application 2020 & 2033
- Table 45: Oceania US AMI Market Revenue (billion) Forecast, by Application 2020 & 2033
- Table 46: Rest of Asia Pacific US AMI Market Revenue (billion) Forecast, by Application 2020 & 2033
Frequently Asked Questions
1. What is the projected Compound Annual Growth Rate (CAGR) of the US AMI Market?
The projected CAGR is approximately 14.6%.
2. Which companies are prominent players in the US AMI Market?
Key companies in the market include Itron Inc, Aclara Technologies LLC*List Not Exhaustive, Honeywell International Inc, General Electric, IBM Corporation, Oncor Electric Delivery Company LLC, NuriFlex Inc, Cisco Systems Inc, Mueller Systems LLC, Eaton Corporation.
3. What are the main segments of the US AMI Market?
The market segments include Type, End-user.
4. Can you provide details about the market size?
The market size is estimated to be USD 5.1 billion as of 2022.
5. What are some drivers contributing to market growth?
Shift Toward Energy Efficient Alternatives; Favorable Governmental Initiatives Driving Adoption Initiatives.
6. What are the notable trends driving market growth?
Smart Metering Devices will Command a Significant Market Share.
7. Are there any restraints impacting market growth?
Data Pricacy Concerns.
8. Can you provide examples of recent developments in the market?
April 2022 - Otter Tail Power Company chose TRC Companies (TRC) to serve as a systems integrator for their advanced metering infrastructure (AMI) program. The project serves a large area in northwestern Minnesota, eastern North Dakota, and northeastern South Dakota. TRC will assist program management with system integration while collaborating with software and hardware providers across Otter Tail Power's AMI, meter data management (MDM), and customer information systems.
9. What pricing options are available for accessing the report?
Pricing options include single-user, multi-user, and enterprise licenses priced at USD 3800, USD 4500, and USD 5800 respectively.
10. Is the market size provided in terms of value or volume?
The market size is provided in terms of value, measured in billion.
11. Are there any specific market keywords associated with the report?
Yes, the market keyword associated with the report is "US AMI Market," which aids in identifying and referencing the specific market segment covered.
12. How do I determine which pricing option suits my needs best?
The pricing options vary based on user requirements and access needs. Individual users may opt for single-user licenses, while businesses requiring broader access may choose multi-user or enterprise licenses for cost-effective access to the report.
13. Are there any additional resources or data provided in the US AMI Market report?
While the report offers comprehensive insights, it's advisable to review the specific contents or supplementary materials provided to ascertain if additional resources or data are available.
14. How can I stay updated on further developments or reports in the US AMI Market?
To stay informed about further developments, trends, and reports in the US AMI Market, consider subscribing to industry newsletters, following relevant companies and organizations, or regularly checking reputable industry news sources and publications.
Methodology
Step 1 - Identification of Relevant Samples Size from Population Database


Step 2 - Approaches for Defining Global Market Size (Value, Volume* & Price*)

Note*: In applicable scenarios
Step 3 - Data Sources
Primary Research
- Web Analytics
- Survey Reports
- Research Institute
- Latest Research Reports
- Opinion Leaders
Secondary Research
- Annual Reports
- White Paper
- Latest Press Release
- Industry Association
- Paid Database
- Investor Presentations

Step 4 - Data Triangulation
Involves using different sources of information in order to increase the validity of a study
These sources are likely to be stakeholders in a program - participants, other researchers, program staff, other community members, and so on.
Then we put all data in single framework & apply various statistical tools to find out the dynamic on the market.
During the analysis stage, feedback from the stakeholder groups would be compared to determine areas of agreement as well as areas of divergence