

Key Insights
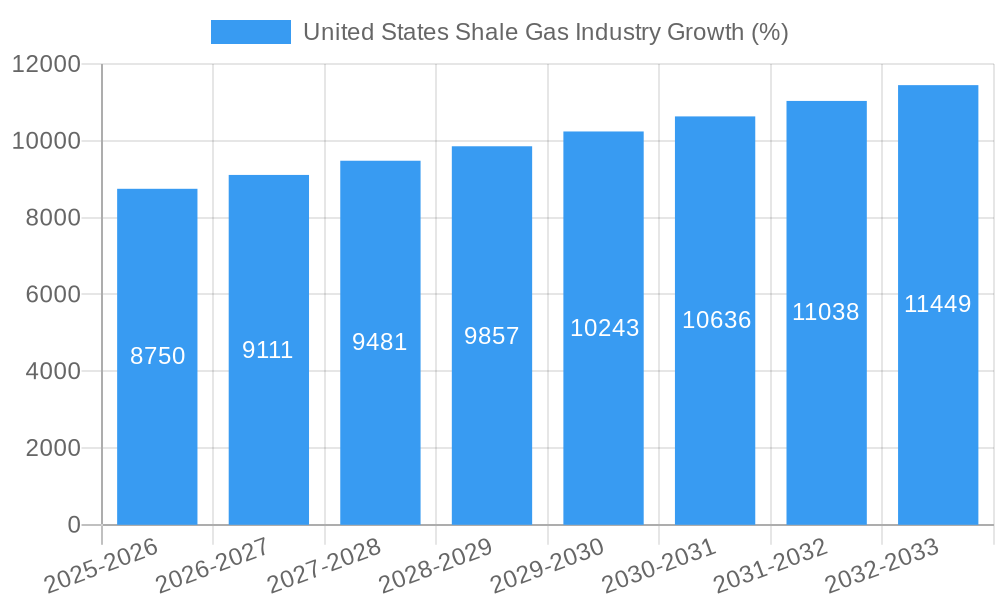
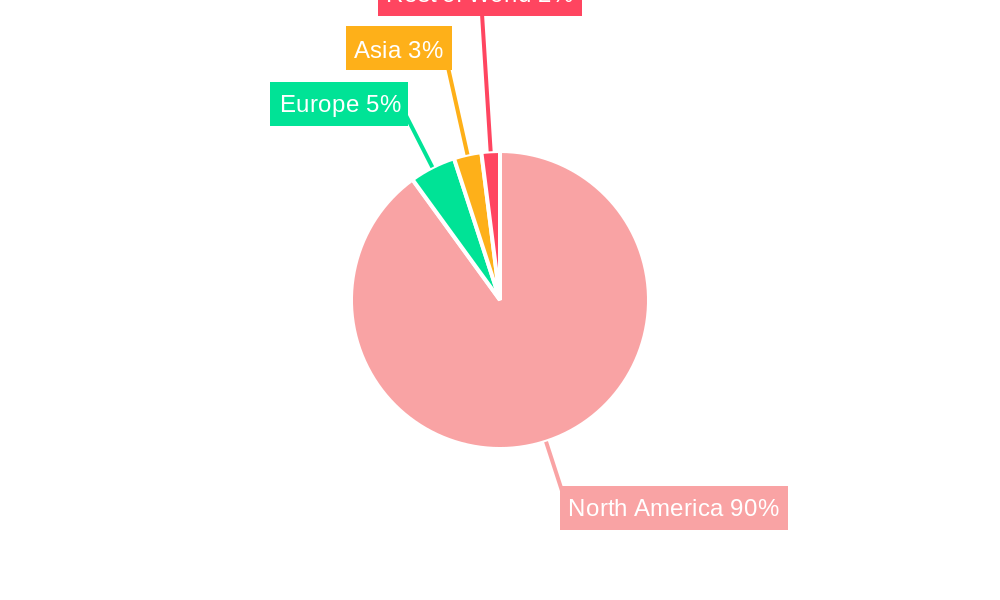
The United States shale gas industry, currently experiencing robust growth, is projected to maintain a Compound Annual Growth Rate (CAGR) exceeding 3.50% from 2025 to 2033. Driven by increasing energy demand, particularly in the power generation and industrial sectors, coupled with technological advancements enhancing extraction efficiency and lowering production costs, the market is poised for significant expansion. The shale gas segment within this industry dominates, contributing the largest portion of the overall market value. Key players like Shell PLC, ExxonMobil, Chevron, and ConocoPhillips are investing heavily in exploration and production, further fueling market growth. However, environmental concerns regarding methane emissions and the impact on water resources pose significant challenges, potentially acting as restraints on future expansion. Government regulations and public opinion regarding environmental impact will play a crucial role in shaping the industry's trajectory. Furthermore, fluctuations in global energy prices and geopolitical instability can influence investment decisions and overall market performance. The North American region, particularly the United States, is the epicenter of this industry, leveraging its extensive shale gas reserves and established infrastructure. While Canada and Mexico also contribute, the United States remains the dominant force, capturing the lion's share of the market.
This robust growth is expected to continue, fueled by ongoing technological improvements in horizontal drilling and hydraulic fracturing. Increased efficiency in these techniques translates to lower extraction costs, making shale gas a more competitive energy source. The expanding natural gas infrastructure within the United States, including pipelines and processing facilities, also contributes positively to market expansion. However, the industry faces challenges related to land access and permitting procedures. Furthermore, the price volatility of natural gas on the global market represents a risk factor, potentially impacting investment decisions and overall industry profitability. Ongoing research and development focusing on reducing environmental impact and improving operational safety are vital for the long-term sustainability and growth of the U.S. shale gas industry.
United States Shale Gas Industry: A Comprehensive Market Report (2019-2033)
This insightful report provides a detailed analysis of the United States shale gas industry, offering a comprehensive overview of market trends, competitive landscape, and future growth prospects. Covering the historical period (2019-2024), base year (2025), and forecast period (2025-2033), this study is essential for stakeholders seeking to understand and capitalize on opportunities within this dynamic sector. The report utilizes a robust methodology to analyze the market's evolution and provides critical data points, including market share distribution and M&A deal values, enabling informed decision-making.
United States Shale Gas Industry Market Composition & Trends
This section delves into the intricate composition of the US shale gas market, examining market concentration, innovation drivers, regulatory frameworks, substitute products, end-user profiles, and significant M&A activities. The analysis covers the period from 2019 to 2033, highlighting key trends influencing market dynamics.
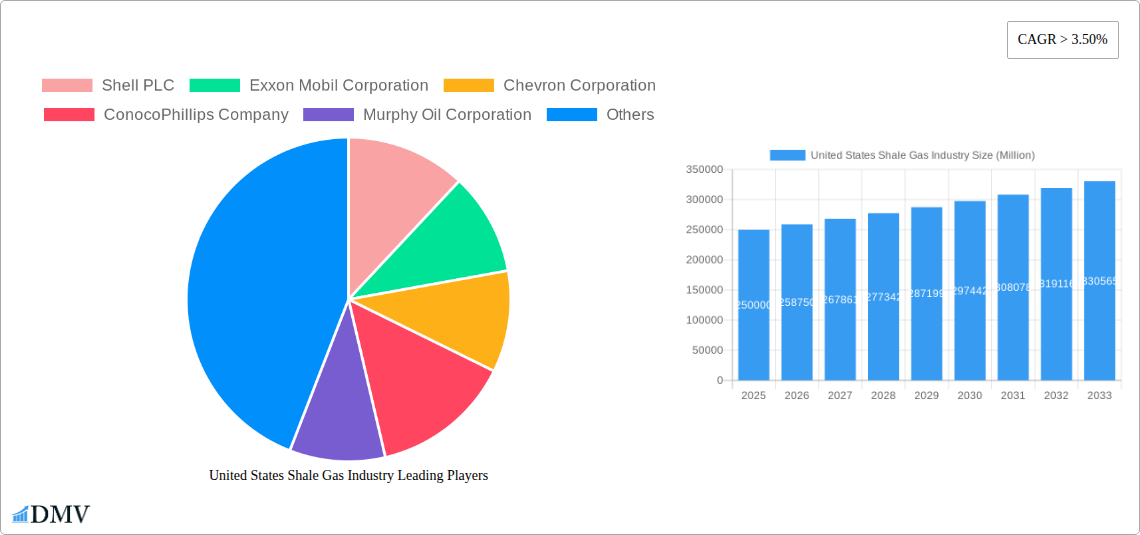
Market Concentration: The US shale gas market exhibits a moderately concentrated structure, with major players like Shell PLC, Exxon Mobil Corporation, Chevron Corporation, and ConocoPhillips Company holding significant market share. Precise market share distribution for 2025 is estimated at: Shell PLC (15%), ExxonMobil (18%), Chevron (12%), ConocoPhillips (10%), others (45%). However, this is subject to change due to ongoing M&A activities.
Innovation Catalysts: Technological advancements in horizontal drilling and hydraulic fracturing have been pivotal in unlocking shale gas reserves, driving industry growth. Further innovation focuses on improving efficiency, reducing environmental impact, and enhancing resource recovery.
Regulatory Landscape: Federal and state-level regulations play a critical role in shaping industry practices, focusing on environmental protection, safety standards, and resource management. Changes in these regulations significantly impact operational costs and investment decisions.
Substitute Products: Natural gas from conventional sources and renewable energy sources such as wind and solar power pose competitive pressure. The relative pricing and environmental considerations influence the choice of energy sources.
End-User Profiles: The primary end-users of shale gas include power generation, industrial applications (e.g., petrochemicals, manufacturing), and residential heating.
M&A Activities: The period witnessed significant M&A activity, exemplified by Shell PLC's USD 9.5 Billion sale of Permian Basin assets to ConocoPhillips in September 2021. This highlights the strategic realignment within the industry and the consolidation among major players. The total value of M&A deals within the period 2019-2024 is estimated at USD xx Billion.
United States Shale Gas Industry Industry Evolution
This section provides a detailed analysis of the evolution of the US shale gas industry from 2019 to 2033, examining market growth trajectories, technological advancements, and evolving consumer demands.
The shale gas industry has experienced significant growth fueled by technological advancements in drilling and extraction techniques. The period 2019-2024 saw an average annual growth rate (AAGR) of approximately 4%. However, the industry faced periods of volatility influenced by global energy prices and regulatory changes. Technological advancements such as improved hydraulic fracturing techniques and data analytics have boosted production efficiency and reduced operational costs. The increasing demand for cleaner energy sources is driving interest in the exploration and utilization of shale gas as a transition fuel. Consumer demand is expected to remain relatively stable, driven primarily by the industrial and power generation sectors. The forecast period (2025-2033) projects a more moderate AAGR of approximately 3%, reflecting a maturing market and increased competition from renewable energy sources. Adoption of advanced technologies is projected at a 7% annual increase in efficiency.
Leading Regions, Countries, or Segments in United States Shale Gas Industry
The Permian Basin in Texas and New Mexico is the dominant region for both shale gas and shale oil production in the United States.
- Key Drivers for Permian Basin Dominance:
- Vast Reserves: The Permian Basin holds enormous reserves of shale gas and oil, driving significant investment.
- Favorable Geology: The geological formations in the Permian Basin are conducive to efficient horizontal drilling and hydraulic fracturing.
- Infrastructure Development: Extensive pipeline and transportation networks support efficient production and distribution.
- Regulatory Environment: While subject to change, the regulatory environment has generally been supportive of shale gas development in the region.
- Investment Trends: Significant capital investments have been made in exploration, development, and production in this region.
The dominance of the Permian Basin is driven by a combination of factors, including vast reserves, favorable geology, and substantial investment. However, other regions continue to contribute to overall shale gas production. The relative importance of shale oil versus shale gas production may shift due to evolving market demand and technological advancements.
United States Shale Gas Industry Product Innovations
Recent innovations have focused on enhancing drilling efficiency, improving hydraulic fracturing techniques, and optimizing gas processing technologies. These advancements contribute to reduced costs, increased production, and minimized environmental impact. Advanced data analytics and artificial intelligence are increasingly utilized for optimizing well placement and production management. Unique selling propositions include improved recovery rates and reduced environmental footprint.
Propelling Factors for United States Shale Gas Industry Growth
Several factors fuel the growth of the US shale gas industry. Technological advancements in horizontal drilling and hydraulic fracturing have significantly lowered extraction costs, making shale gas a more competitive energy source. Strong demand from the power generation and industrial sectors continues to drive production. Favorable government policies in certain regions have facilitated investment and development.
Obstacles in the United States Shale Gas Industry Market
The industry faces significant challenges, including environmental concerns surrounding water usage and greenhouse gas emissions. Fluctuations in global energy prices and regulatory uncertainty impact investment decisions. Supply chain disruptions and competition from renewable energy sources add to the industry's obstacles. The total estimated economic impact of these obstacles from 2019-2024 is around USD xx Million.
Future Opportunities in United States Shale Gas Industry
Opportunities lie in developing innovative extraction technologies that minimize environmental impact. Further exploration and development of previously untapped shale gas reserves present significant potential. The industry can leverage its expertise in shale gas extraction to explore other unconventional energy sources.
Major Players in the United States Shale Gas Industry Ecosystem
- Shell PLC
- Exxon Mobil Corporation
- Chevron Corporation
- ConocoPhillips Company
- Murphy Oil Corporation
- Baker Hughes Company
- TotalEnergies SE
Key Developments in United States Shale Gas Industry Industry
- January 2022: Oil India Ltd exited a US shale oil venture, selling its 20% stake for USD 25 Million.
- September 2021: Shell PLC sold its Permian Basin assets to ConocoPhillips for USD 9.5 Billion, signaling a strategic shift towards clean energy.
Strategic United States Shale Gas Industry Market Forecast
The US shale gas industry is poised for continued growth, albeit at a moderated pace compared to the previous decade. Technological advancements, coupled with sustained demand from key sectors, will drive future expansion. However, the industry must address environmental concerns and navigate regulatory complexities to achieve sustainable growth. The forecast period (2025-2033) suggests a positive, albeit moderated, growth trajectory with potential for significant gains in specific regional markets.
United States Shale Gas Industry Segmentation
-
1. Type
- 1.1. Shale Gas
- 1.2. Shale Oil
United States Shale Gas Industry Segmentation By Geography
- 1. United States
United States Shale Gas Industry REPORT HIGHLIGHTS
| Aspects | Details |
|---|---|
| Study Period | 2019-2033 |
| Base Year | 2024 |
| Estimated Year | 2025 |
| Forecast Period | 2025-2033 |
| Historical Period | 2019-2024 |
| Growth Rate | CAGR of > 3.50% from 2019-2033 |
| Segmentation |
|
Table of Contents
- 1. Introduction
- 1.1. Research Scope
- 1.2. Market Segmentation
- 1.3. Research Methodology
- 1.4. Definitions and Assumptions
- 2. Executive Summary
- 2.1. Introduction
- 3. Market Dynamics
- 3.1. Introduction
- 3.2. Market Drivers
- 3.2.1. 4.; Modernization and Upgrades of Existing Military Aircraft Fleets4.; Increasing Defense Budgets
- 3.3. Market Restrains
- 3.3.1. 4.; Shift Toward Unmanned Aircraft
- 3.4. Market Trends
- 3.4.1. Shale Gas to Dominate the Market
- 4. Market Factor Analysis
- 4.1. Porters Five Forces
- 4.2. Supply/Value Chain
- 4.3. PESTEL analysis
- 4.4. Market Entropy
- 4.5. Patent/Trademark Analysis
- 5. United States Shale Gas Industry Analysis, Insights and Forecast, 2019-2031
- 5.1. Market Analysis, Insights and Forecast - by Type
- 5.1.1. Shale Gas
- 5.1.2. Shale Oil
- 5.2. Market Analysis, Insights and Forecast - by Region
- 5.2.1. United States
- 5.1. Market Analysis, Insights and Forecast - by Type
- 6. United States United States Shale Gas Industry Analysis, Insights and Forecast, 2019-2031
- 7. Canada United States Shale Gas Industry Analysis, Insights and Forecast, 2019-2031
- 8. Mexico United States Shale Gas Industry Analysis, Insights and Forecast, 2019-2031
- 9. Rest of North America United States Shale Gas Industry Analysis, Insights and Forecast, 2019-2031
- 10. Competitive Analysis
- 10.1. Market Share Analysis 2024
- 10.2. Company Profiles
- 10.2.1 Shell PLC
- 10.2.1.1. Overview
- 10.2.1.2. Products
- 10.2.1.3. SWOT Analysis
- 10.2.1.4. Recent Developments
- 10.2.1.5. Financials (Based on Availability)
- 10.2.2 Exxon Mobil Corporation
- 10.2.2.1. Overview
- 10.2.2.2. Products
- 10.2.2.3. SWOT Analysis
- 10.2.2.4. Recent Developments
- 10.2.2.5. Financials (Based on Availability)
- 10.2.3 Chevron Corporation
- 10.2.3.1. Overview
- 10.2.3.2. Products
- 10.2.3.3. SWOT Analysis
- 10.2.3.4. Recent Developments
- 10.2.3.5. Financials (Based on Availability)
- 10.2.4 ConocoPhillips Company
- 10.2.4.1. Overview
- 10.2.4.2. Products
- 10.2.4.3. SWOT Analysis
- 10.2.4.4. Recent Developments
- 10.2.4.5. Financials (Based on Availability)
- 10.2.5 Murphy Oil Corporation
- 10.2.5.1. Overview
- 10.2.5.2. Products
- 10.2.5.3. SWOT Analysis
- 10.2.5.4. Recent Developments
- 10.2.5.5. Financials (Based on Availability)
- 10.2.6 Baker Hughes Company
- 10.2.6.1. Overview
- 10.2.6.2. Products
- 10.2.6.3. SWOT Analysis
- 10.2.6.4. Recent Developments
- 10.2.6.5. Financials (Based on Availability)
- 10.2.7 TotalEnergies SE
- 10.2.7.1. Overview
- 10.2.7.2. Products
- 10.2.7.3. SWOT Analysis
- 10.2.7.4. Recent Developments
- 10.2.7.5. Financials (Based on Availability)
- 10.2.1 Shell PLC
List of Figures
- Figure 1: United States Shale Gas Industry Revenue Breakdown (Million, %) by Product 2024 & 2032
- Figure 2: United States Shale Gas Industry Share (%) by Company 2024
List of Tables
- Table 1: United States Shale Gas Industry Revenue Million Forecast, by Region 2019 & 2032
- Table 2: United States Shale Gas Industry Volume Trillion Forecast, by Region 2019 & 2032
- Table 3: United States Shale Gas Industry Revenue Million Forecast, by Type 2019 & 2032
- Table 4: United States Shale Gas Industry Volume Trillion Forecast, by Type 2019 & 2032
- Table 5: United States Shale Gas Industry Revenue Million Forecast, by Region 2019 & 2032
- Table 6: United States Shale Gas Industry Volume Trillion Forecast, by Region 2019 & 2032
- Table 7: United States Shale Gas Industry Revenue Million Forecast, by Country 2019 & 2032
- Table 8: United States Shale Gas Industry Volume Trillion Forecast, by Country 2019 & 2032
- Table 9: United States United States Shale Gas Industry Revenue (Million) Forecast, by Application 2019 & 2032
- Table 10: United States United States Shale Gas Industry Volume (Trillion) Forecast, by Application 2019 & 2032
- Table 11: Canada United States Shale Gas Industry Revenue (Million) Forecast, by Application 2019 & 2032
- Table 12: Canada United States Shale Gas Industry Volume (Trillion) Forecast, by Application 2019 & 2032
- Table 13: Mexico United States Shale Gas Industry Revenue (Million) Forecast, by Application 2019 & 2032
- Table 14: Mexico United States Shale Gas Industry Volume (Trillion) Forecast, by Application 2019 & 2032
- Table 15: Rest of North America United States Shale Gas Industry Revenue (Million) Forecast, by Application 2019 & 2032
- Table 16: Rest of North America United States Shale Gas Industry Volume (Trillion) Forecast, by Application 2019 & 2032
- Table 17: United States Shale Gas Industry Revenue Million Forecast, by Type 2019 & 2032
- Table 18: United States Shale Gas Industry Volume Trillion Forecast, by Type 2019 & 2032
- Table 19: United States Shale Gas Industry Revenue Million Forecast, by Country 2019 & 2032
- Table 20: United States Shale Gas Industry Volume Trillion Forecast, by Country 2019 & 2032
Frequently Asked Questions
1. What is the projected Compound Annual Growth Rate (CAGR) of the United States Shale Gas Industry?
The projected CAGR is approximately > 3.50%.
2. Which companies are prominent players in the United States Shale Gas Industry?
Key companies in the market include Shell PLC, Exxon Mobil Corporation, Chevron Corporation, ConocoPhillips Company, Murphy Oil Corporation, Baker Hughes Company, TotalEnergies SE.
3. What are the main segments of the United States Shale Gas Industry?
The market segments include Type.
4. Can you provide details about the market size?
The market size is estimated to be USD XX Million as of 2022.
5. What are some drivers contributing to market growth?
4.; Modernization and Upgrades of Existing Military Aircraft Fleets4.; Increasing Defense Budgets.
6. What are the notable trends driving market growth?
Shale Gas to Dominate the Market.
7. Are there any restraints impacting market growth?
4.; Shift Toward Unmanned Aircraft.
8. Can you provide examples of recent developments in the market?
In January 2022, Oil India Ltd (OIL) exited from a US shale oil venture, selling its 20% stake to its venture partner for USD 25 million. The company had divested its entire stake in Niobrara shale asset, US.
9. What pricing options are available for accessing the report?
Pricing options include single-user, multi-user, and enterprise licenses priced at USD 3800, USD 4500, and USD 5800 respectively.
10. Is the market size provided in terms of value or volume?
The market size is provided in terms of value, measured in Million and volume, measured in Trillion.
11. Are there any specific market keywords associated with the report?
Yes, the market keyword associated with the report is "United States Shale Gas Industry," which aids in identifying and referencing the specific market segment covered.
12. How do I determine which pricing option suits my needs best?
The pricing options vary based on user requirements and access needs. Individual users may opt for single-user licenses, while businesses requiring broader access may choose multi-user or enterprise licenses for cost-effective access to the report.
13. Are there any additional resources or data provided in the United States Shale Gas Industry report?
While the report offers comprehensive insights, it's advisable to review the specific contents or supplementary materials provided to ascertain if additional resources or data are available.
14. How can I stay updated on further developments or reports in the United States Shale Gas Industry?
To stay informed about further developments, trends, and reports in the United States Shale Gas Industry, consider subscribing to industry newsletters, following relevant companies and organizations, or regularly checking reputable industry news sources and publications.
Methodology
Step 1 - Identification of Relevant Samples Size from Population Database


Step 2 - Approaches for Defining Global Market Size (Value, Volume* & Price*)

Note*: In applicable scenarios
Step 3 - Data Sources
Primary Research
- Web Analytics
- Survey Reports
- Research Institute
- Latest Research Reports
- Opinion Leaders
Secondary Research
- Annual Reports
- White Paper
- Latest Press Release
- Industry Association
- Paid Database
- Investor Presentations

Step 4 - Data Triangulation
Involves using different sources of information in order to increase the validity of a study
These sources are likely to be stakeholders in a program - participants, other researchers, program staff, other community members, and so on.
Then we put all data in single framework & apply various statistical tools to find out the dynamic on the market.
During the analysis stage, feedback from the stakeholder groups would be compared to determine areas of agreement as well as areas of divergence
