

Key Insights
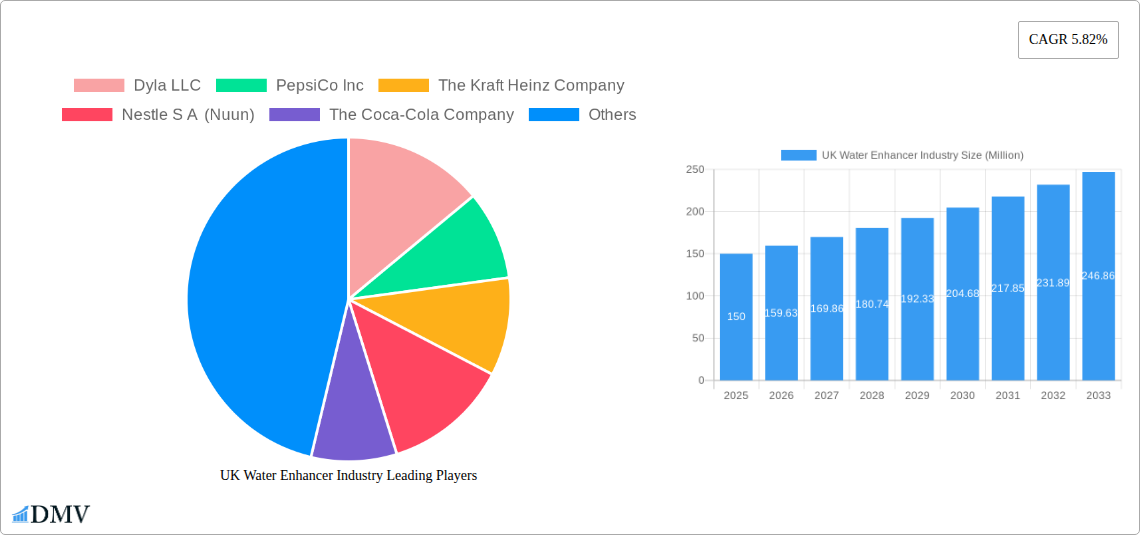
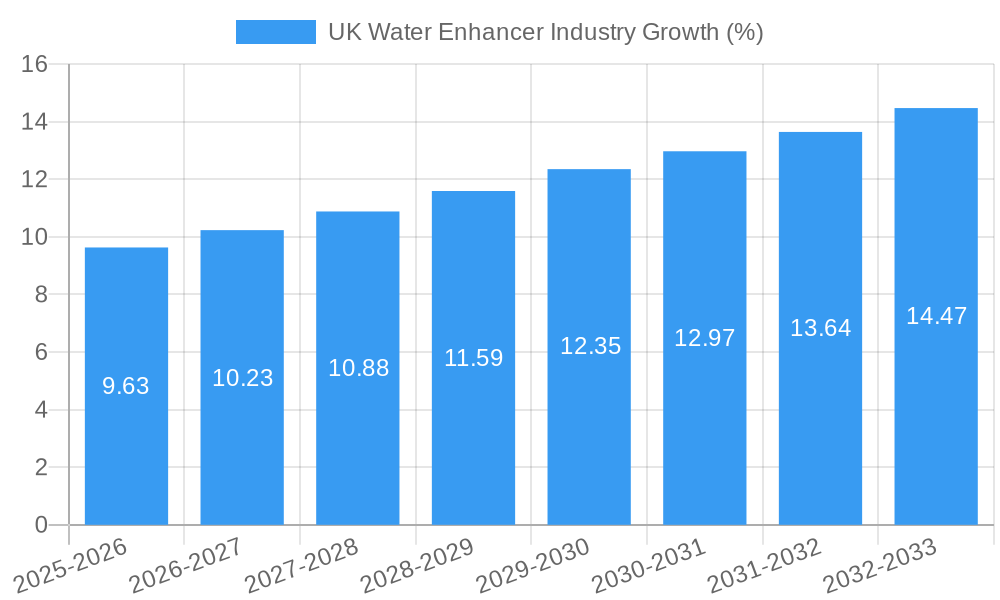
The UK water enhancer market, valued at approximately £150 million in 2025, is poised for robust growth, exhibiting a Compound Annual Growth Rate (CAGR) of 5.82% from 2025 to 2033. This expansion is driven by several key factors. Firstly, the increasing consumer awareness of health and wellness is fueling demand for healthier beverage options. Water enhancers offer a low-calorie, sugar-free alternative to sugary drinks, aligning perfectly with this trend. Secondly, the rising popularity of functional beverages, those offering additional health benefits beyond hydration, is significantly impacting market growth. Water enhancers are often infused with vitamins, minerals, or antioxidants, adding to their appeal. Finally, the convenience factor plays a crucial role; water enhancers provide a quick and easy way to customize the taste of water, making them attractive to busy consumers. The market is segmented by distribution channels, with hypermarkets/supermarkets holding a significant share, followed by convenience stores and online retailers. Leading players like PepsiCo, Nestle, and Coca-Cola are strategically investing in innovation and marketing to capture market share, while smaller brands focus on niche segments and specialized flavors.
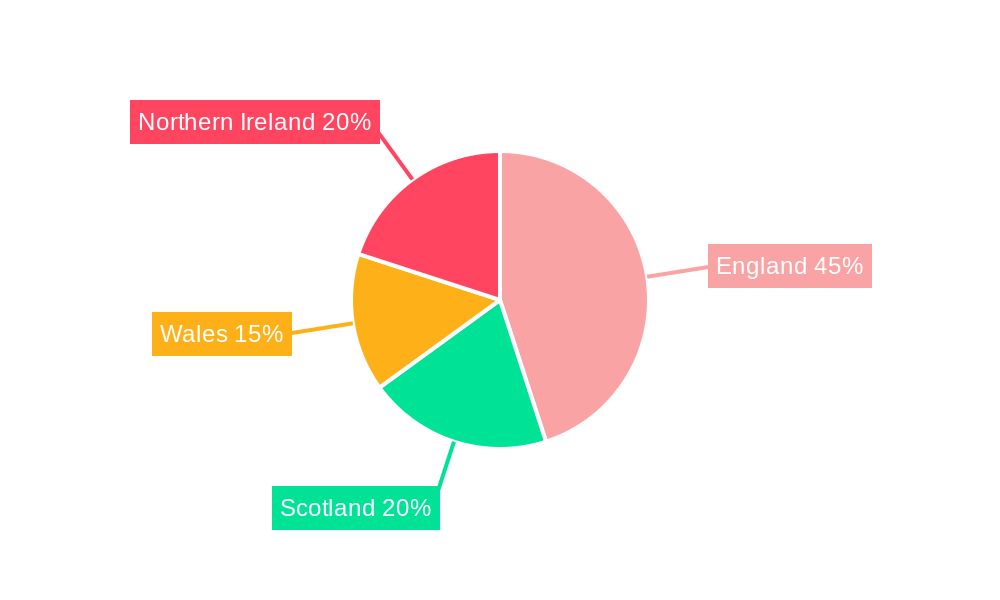
The market's growth, however, is not without challenges. Price sensitivity among consumers, the potential for substitution with other healthier beverages, and intense competition from established beverage giants pose significant restraints. Nevertheless, ongoing product innovation, such as the introduction of new flavors and functional ingredients, along with targeted marketing campaigns emphasizing health benefits, are expected to mitigate these challenges and sustain market growth throughout the forecast period. Regional variations exist within the UK, with regions like England and Scotland showing potentially higher demand due to factors like population density and consumer preferences. The continued focus on sustainable packaging and environmentally conscious production methods will also play a key role in shaping the market's future trajectory.
UK Water Enhancer Industry Market Report: 2019-2033
This comprehensive report provides a detailed analysis of the UK water enhancer industry, offering invaluable insights for stakeholders seeking to understand market dynamics, competitive landscapes, and future growth potential. The report covers the period 2019-2033, with a focus on the estimated year 2025. The market is projected to reach £xx Million by 2033, exhibiting a CAGR of xx% during the forecast period (2025-2033). This in-depth study analyzes market composition, leading players, innovative products, and key growth drivers, offering a complete picture of this dynamic sector.
UK Water Enhancer Industry Market Composition & Trends
This section evaluates the UK water enhancer market's structure, focusing on market concentration, innovation, regulatory aspects, substitute products, consumer profiles, and mergers & acquisitions (M&A) activity. The market is moderately concentrated, with key players like PepsiCo Inc, Nestle S A (Nuun), and Britvic plc holding significant market share. However, smaller players and new entrants constantly challenge the status quo.
- Market Share Distribution (2024): PepsiCo Inc (xx%), Nestle S A (Nuun) (xx%), Britvic plc (xx%), Others (xx%).
- Innovation Catalysts: Health and wellness trends, increasing demand for convenient hydration solutions, and the rise of natural and sugar-free options fuel innovation.
- Regulatory Landscape: EU regulations regarding food additives and labeling significantly influence product development and marketing strategies.
- Substitute Products: Ready-to-drink beverages, fruit juices, and sports drinks pose competitive challenges.
- End-User Profiles: Health-conscious consumers, athletes, and individuals seeking convenient hydration options are the primary target market.
- M&A Activities: The past five years have witnessed xx M&A deals, with a total value of approximately £xx Million, reflecting the industry's consolidation and expansion efforts.
UK Water Enhancer Industry Industry Evolution
The UK water enhancer market has experienced substantial growth from 2019 to 2024, driven by several factors including increased health awareness, the growing popularity of functional beverages, and the introduction of innovative products. Technological advancements, such as improved flavoring techniques and convenient packaging formats, have further propelled market expansion. Changing consumer preferences, shifting towards healthier alternatives and personalized hydration solutions, are shaping the industry's trajectory. The market exhibited a CAGR of xx% during the historical period (2019-2024), and is expected to continue its growth trajectory.
Leading Regions, Countries, or Segments in UK Water Enhancer Industry
The Hypermarket/Supermarket distribution channel currently dominates the UK water enhancer market, accounting for approximately xx% of total sales in 2024. This dominance is attributed to several key factors:
- Key Drivers:
- High consumer footfall and brand visibility within large retail outlets.
- Established distribution networks and strong relationships with major retailers.
- Competitive pricing strategies and promotional offers.
- In-depth Analysis: Hypermarkets and supermarkets offer extensive shelf space, enabling manufacturers to showcase their products effectively. They also often collaborate with brands on promotions and shelf placement, contributing to strong sales. The convenience store segment holds the second largest share, boosted by its convenient locations and rapid purchasing decisions. Online retail is emerging as a significant channel, driven by increased online shopping and convenience.
UK Water Enhancer Industry Product Innovations
Recent innovations focus on enhanced functionality, including added vitamins, minerals, and electrolytes; natural and organic ingredients; and convenient packaging formats, such as single-serve sachets and portable bottles. These improvements cater to consumer preferences for healthier and more convenient hydration options. The introduction of sugar-free and low-calorie varieties also reflects evolving consumer health priorities. Taste variety and creative flavor profiles continue to be key product differentiation strategies.
Propelling Factors for UK Water Enhancer Industry Growth
Several factors are driving the UK water enhancer industry's growth: growing health consciousness among consumers, increasing demand for convenient hydration solutions, and the introduction of innovative products with added benefits like vitamins and electrolytes. Government initiatives promoting healthy lifestyles and the increasing prevalence of online shopping platforms also contribute to the market's expansion. Furthermore, technological advancements in flavouring and packaging enhance the appeal of water enhancers.
Obstacles in the UK Water Enhancer Industry Market
Challenges include intense competition from established beverage companies and emerging brands, fluctuations in raw material prices, and evolving consumer preferences. Stringent regulatory requirements for food and beverage products also present hurdles. Supply chain disruptions, particularly those experienced post-pandemic, also created temporary setbacks for some manufacturers.
Future Opportunities in UK Water Enhancer Industry
Future opportunities include expanding into niche markets (e.g., sports nutrition), developing innovative flavors and functional benefits, and exploring sustainable packaging solutions. The growing demand for personalized wellness products presents significant opportunities, encouraging the development of customized water enhancers tailored to specific health needs. Further expansion into the online retail channel and exploring international market entry also presents significant potential.
Major Players in the UK Water Enhancer Industry Ecosystem
- Dyla LLC
- PepsiCo Inc
- The Kraft Heinz Company
- Nestle S A (Nuun)
- The Coca-Cola Company
- Jelsert (Starburst)
- Refresco
- Wisdom Natural Brands
- Exante Diet Ltd
- Britvic plc
Key Developments in UK Water Enhancer Industry Industry
- July 2021: Crème de la Cream launches Chupa Chups-flavored Lolly Drops water enhancers in the UK and several European markets.
- November 2021: Waterdrop introduces NERO, a natural energy water enhancer.
- April 2022: Britvic plc launches Robinsons Benefit Drops, vitamin-enhanced water enhancers.
Strategic UK Water Enhancer Industry Market Forecast
The UK water enhancer market is poised for continued growth, driven by ongoing health and wellness trends, product innovation, and expanding distribution channels. The market's future potential is significant, particularly with the increasing adoption of online retail and the growing interest in functional beverages. The forecast period (2025-2033) is expected to witness substantial market expansion, underpinned by consumer demand for healthier, more convenient hydration solutions.
UK Water Enhancer Industry Segmentation
-
1. Distribution Channel
- 1.1. Hypermarket/Supermarket
- 1.2. Convenience Store
- 1.3. Online Retails Stores
- 1.4. Other Distribution Channels
UK Water Enhancer Industry Segmentation By Geography
-
1. North America
- 1.1. United States
- 1.2. Canada
- 1.3. Mexico
-
2. South America
- 2.1. Brazil
- 2.2. Argentina
- 2.3. Rest of South America
-
3. Europe
- 3.1. United Kingdom
- 3.2. Germany
- 3.3. France
- 3.4. Italy
- 3.5. Spain
- 3.6. Russia
- 3.7. Benelux
- 3.8. Nordics
- 3.9. Rest of Europe
-
4. Middle East & Africa
- 4.1. Turkey
- 4.2. Israel
- 4.3. GCC
- 4.4. North Africa
- 4.5. South Africa
- 4.6. Rest of Middle East & Africa
-
5. Asia Pacific
- 5.1. China
- 5.2. India
- 5.3. Japan
- 5.4. South Korea
- 5.5. ASEAN
- 5.6. Oceania
- 5.7. Rest of Asia Pacific
UK Water Enhancer Industry REPORT HIGHLIGHTS
| Aspects | Details |
|---|---|
| Study Period | 2019-2033 |
| Base Year | 2024 |
| Estimated Year | 2025 |
| Forecast Period | 2025-2033 |
| Historical Period | 2019-2024 |
| Growth Rate | CAGR of 5.82% from 2019-2033 |
| Segmentation |
|
Table of Contents
- 1. Introduction
- 1.1. Research Scope
- 1.2. Market Segmentation
- 1.3. Research Methodology
- 1.4. Definitions and Assumptions
- 2. Executive Summary
- 2.1. Introduction
- 3. Market Dynamics
- 3.1. Introduction
- 3.2. Market Drivers
- 3.2.1. Rise of e-commerce has made it easier for consumers to access a wide variety of water enhancers
- 3.3. Market Restrains
- 3.3.1. Economic downturns or fluctuations in disposable income can impact consumer spending on non-essential products
- 3.4. Market Trends
- 3.4.1. Growing trend towards personalized nutrition and functional beverages supports the market for water enhancers
- 4. Market Factor Analysis
- 4.1. Porters Five Forces
- 4.2. Supply/Value Chain
- 4.3. PESTEL analysis
- 4.4. Market Entropy
- 4.5. Patent/Trademark Analysis
- 5. Global UK Water Enhancer Industry Analysis, Insights and Forecast, 2019-2031
- 5.1. Market Analysis, Insights and Forecast - by Distribution Channel
- 5.1.1. Hypermarket/Supermarket
- 5.1.2. Convenience Store
- 5.1.3. Online Retails Stores
- 5.1.4. Other Distribution Channels
- 5.2. Market Analysis, Insights and Forecast - by Region
- 5.2.1. North America
- 5.2.2. South America
- 5.2.3. Europe
- 5.2.4. Middle East & Africa
- 5.2.5. Asia Pacific
- 5.1. Market Analysis, Insights and Forecast - by Distribution Channel
- 6. North America UK Water Enhancer Industry Analysis, Insights and Forecast, 2019-2031
- 6.1. Market Analysis, Insights and Forecast - by Distribution Channel
- 6.1.1. Hypermarket/Supermarket
- 6.1.2. Convenience Store
- 6.1.3. Online Retails Stores
- 6.1.4. Other Distribution Channels
- 6.1. Market Analysis, Insights and Forecast - by Distribution Channel
- 7. South America UK Water Enhancer Industry Analysis, Insights and Forecast, 2019-2031
- 7.1. Market Analysis, Insights and Forecast - by Distribution Channel
- 7.1.1. Hypermarket/Supermarket
- 7.1.2. Convenience Store
- 7.1.3. Online Retails Stores
- 7.1.4. Other Distribution Channels
- 7.1. Market Analysis, Insights and Forecast - by Distribution Channel
- 8. Europe UK Water Enhancer Industry Analysis, Insights and Forecast, 2019-2031
- 8.1. Market Analysis, Insights and Forecast - by Distribution Channel
- 8.1.1. Hypermarket/Supermarket
- 8.1.2. Convenience Store
- 8.1.3. Online Retails Stores
- 8.1.4. Other Distribution Channels
- 8.1. Market Analysis, Insights and Forecast - by Distribution Channel
- 9. Middle East & Africa UK Water Enhancer Industry Analysis, Insights and Forecast, 2019-2031
- 9.1. Market Analysis, Insights and Forecast - by Distribution Channel
- 9.1.1. Hypermarket/Supermarket
- 9.1.2. Convenience Store
- 9.1.3. Online Retails Stores
- 9.1.4. Other Distribution Channels
- 9.1. Market Analysis, Insights and Forecast - by Distribution Channel
- 10. Asia Pacific UK Water Enhancer Industry Analysis, Insights and Forecast, 2019-2031
- 10.1. Market Analysis, Insights and Forecast - by Distribution Channel
- 10.1.1. Hypermarket/Supermarket
- 10.1.2. Convenience Store
- 10.1.3. Online Retails Stores
- 10.1.4. Other Distribution Channels
- 10.1. Market Analysis, Insights and Forecast - by Distribution Channel
- 11. England UK Water Enhancer Industry Analysis, Insights and Forecast, 2019-2031
- 12. Wales UK Water Enhancer Industry Analysis, Insights and Forecast, 2019-2031
- 13. Scotland UK Water Enhancer Industry Analysis, Insights and Forecast, 2019-2031
- 14. Northern UK Water Enhancer Industry Analysis, Insights and Forecast, 2019-2031
- 15. Ireland UK Water Enhancer Industry Analysis, Insights and Forecast, 2019-2031
- 16. Competitive Analysis
- 16.1. Global Market Share Analysis 2024
- 16.2. Company Profiles
- 16.2.1 Dyla LLC
- 16.2.1.1. Overview
- 16.2.1.2. Products
- 16.2.1.3. SWOT Analysis
- 16.2.1.4. Recent Developments
- 16.2.1.5. Financials (Based on Availability)
- 16.2.2 PepsiCo Inc
- 16.2.2.1. Overview
- 16.2.2.2. Products
- 16.2.2.3. SWOT Analysis
- 16.2.2.4. Recent Developments
- 16.2.2.5. Financials (Based on Availability)
- 16.2.3 The Kraft Heinz Company
- 16.2.3.1. Overview
- 16.2.3.2. Products
- 16.2.3.3. SWOT Analysis
- 16.2.3.4. Recent Developments
- 16.2.3.5. Financials (Based on Availability)
- 16.2.4 Nestle S A (Nuun)
- 16.2.4.1. Overview
- 16.2.4.2. Products
- 16.2.4.3. SWOT Analysis
- 16.2.4.4. Recent Developments
- 16.2.4.5. Financials (Based on Availability)
- 16.2.5 The Coca-Cola Company
- 16.2.5.1. Overview
- 16.2.5.2. Products
- 16.2.5.3. SWOT Analysis
- 16.2.5.4. Recent Developments
- 16.2.5.5. Financials (Based on Availability)
- 16.2.6 Jelsert (Starburst)
- 16.2.6.1. Overview
- 16.2.6.2. Products
- 16.2.6.3. SWOT Analysis
- 16.2.6.4. Recent Developments
- 16.2.6.5. Financials (Based on Availability)
- 16.2.7 Refresco
- 16.2.7.1. Overview
- 16.2.7.2. Products
- 16.2.7.3. SWOT Analysis
- 16.2.7.4. Recent Developments
- 16.2.7.5. Financials (Based on Availability)
- 16.2.8 Wisdom Natural Brands
- 16.2.8.1. Overview
- 16.2.8.2. Products
- 16.2.8.3. SWOT Analysis
- 16.2.8.4. Recent Developments
- 16.2.8.5. Financials (Based on Availability)
- 16.2.9 Exante Diet Ltd
- 16.2.9.1. Overview
- 16.2.9.2. Products
- 16.2.9.3. SWOT Analysis
- 16.2.9.4. Recent Developments
- 16.2.9.5. Financials (Based on Availability)
- 16.2.10 Britvic plc
- 16.2.10.1. Overview
- 16.2.10.2. Products
- 16.2.10.3. SWOT Analysis
- 16.2.10.4. Recent Developments
- 16.2.10.5. Financials (Based on Availability)
- 16.2.1 Dyla LLC
List of Figures
- Figure 1: Global UK Water Enhancer Industry Revenue Breakdown (Million, %) by Region 2024 & 2032
- Figure 2: United kingdom Region UK Water Enhancer Industry Revenue (Million), by Country 2024 & 2032
- Figure 3: United kingdom Region UK Water Enhancer Industry Revenue Share (%), by Country 2024 & 2032
- Figure 4: North America UK Water Enhancer Industry Revenue (Million), by Distribution Channel 2024 & 2032
- Figure 5: North America UK Water Enhancer Industry Revenue Share (%), by Distribution Channel 2024 & 2032
- Figure 6: North America UK Water Enhancer Industry Revenue (Million), by Country 2024 & 2032
- Figure 7: North America UK Water Enhancer Industry Revenue Share (%), by Country 2024 & 2032
- Figure 8: South America UK Water Enhancer Industry Revenue (Million), by Distribution Channel 2024 & 2032
- Figure 9: South America UK Water Enhancer Industry Revenue Share (%), by Distribution Channel 2024 & 2032
- Figure 10: South America UK Water Enhancer Industry Revenue (Million), by Country 2024 & 2032
- Figure 11: South America UK Water Enhancer Industry Revenue Share (%), by Country 2024 & 2032
- Figure 12: Europe UK Water Enhancer Industry Revenue (Million), by Distribution Channel 2024 & 2032
- Figure 13: Europe UK Water Enhancer Industry Revenue Share (%), by Distribution Channel 2024 & 2032
- Figure 14: Europe UK Water Enhancer Industry Revenue (Million), by Country 2024 & 2032
- Figure 15: Europe UK Water Enhancer Industry Revenue Share (%), by Country 2024 & 2032
- Figure 16: Middle East & Africa UK Water Enhancer Industry Revenue (Million), by Distribution Channel 2024 & 2032
- Figure 17: Middle East & Africa UK Water Enhancer Industry Revenue Share (%), by Distribution Channel 2024 & 2032
- Figure 18: Middle East & Africa UK Water Enhancer Industry Revenue (Million), by Country 2024 & 2032
- Figure 19: Middle East & Africa UK Water Enhancer Industry Revenue Share (%), by Country 2024 & 2032
- Figure 20: Asia Pacific UK Water Enhancer Industry Revenue (Million), by Distribution Channel 2024 & 2032
- Figure 21: Asia Pacific UK Water Enhancer Industry Revenue Share (%), by Distribution Channel 2024 & 2032
- Figure 22: Asia Pacific UK Water Enhancer Industry Revenue (Million), by Country 2024 & 2032
- Figure 23: Asia Pacific UK Water Enhancer Industry Revenue Share (%), by Country 2024 & 2032
List of Tables
- Table 1: Global UK Water Enhancer Industry Revenue Million Forecast, by Region 2019 & 2032
- Table 2: Global UK Water Enhancer Industry Revenue Million Forecast, by Distribution Channel 2019 & 2032
- Table 3: Global UK Water Enhancer Industry Revenue Million Forecast, by Region 2019 & 2032
- Table 4: Global UK Water Enhancer Industry Revenue Million Forecast, by Country 2019 & 2032
- Table 5: England UK Water Enhancer Industry Revenue (Million) Forecast, by Application 2019 & 2032
- Table 6: Wales UK Water Enhancer Industry Revenue (Million) Forecast, by Application 2019 & 2032
- Table 7: Scotland UK Water Enhancer Industry Revenue (Million) Forecast, by Application 2019 & 2032
- Table 8: Northern UK Water Enhancer Industry Revenue (Million) Forecast, by Application 2019 & 2032
- Table 9: Ireland UK Water Enhancer Industry Revenue (Million) Forecast, by Application 2019 & 2032
- Table 10: Global UK Water Enhancer Industry Revenue Million Forecast, by Distribution Channel 2019 & 2032
- Table 11: Global UK Water Enhancer Industry Revenue Million Forecast, by Country 2019 & 2032
- Table 12: United States UK Water Enhancer Industry Revenue (Million) Forecast, by Application 2019 & 2032
- Table 13: Canada UK Water Enhancer Industry Revenue (Million) Forecast, by Application 2019 & 2032
- Table 14: Mexico UK Water Enhancer Industry Revenue (Million) Forecast, by Application 2019 & 2032
- Table 15: Global UK Water Enhancer Industry Revenue Million Forecast, by Distribution Channel 2019 & 2032
- Table 16: Global UK Water Enhancer Industry Revenue Million Forecast, by Country 2019 & 2032
- Table 17: Brazil UK Water Enhancer Industry Revenue (Million) Forecast, by Application 2019 & 2032
- Table 18: Argentina UK Water Enhancer Industry Revenue (Million) Forecast, by Application 2019 & 2032
- Table 19: Rest of South America UK Water Enhancer Industry Revenue (Million) Forecast, by Application 2019 & 2032
- Table 20: Global UK Water Enhancer Industry Revenue Million Forecast, by Distribution Channel 2019 & 2032
- Table 21: Global UK Water Enhancer Industry Revenue Million Forecast, by Country 2019 & 2032
- Table 22: United Kingdom UK Water Enhancer Industry Revenue (Million) Forecast, by Application 2019 & 2032
- Table 23: Germany UK Water Enhancer Industry Revenue (Million) Forecast, by Application 2019 & 2032
- Table 24: France UK Water Enhancer Industry Revenue (Million) Forecast, by Application 2019 & 2032
- Table 25: Italy UK Water Enhancer Industry Revenue (Million) Forecast, by Application 2019 & 2032
- Table 26: Spain UK Water Enhancer Industry Revenue (Million) Forecast, by Application 2019 & 2032
- Table 27: Russia UK Water Enhancer Industry Revenue (Million) Forecast, by Application 2019 & 2032
- Table 28: Benelux UK Water Enhancer Industry Revenue (Million) Forecast, by Application 2019 & 2032
- Table 29: Nordics UK Water Enhancer Industry Revenue (Million) Forecast, by Application 2019 & 2032
- Table 30: Rest of Europe UK Water Enhancer Industry Revenue (Million) Forecast, by Application 2019 & 2032
- Table 31: Global UK Water Enhancer Industry Revenue Million Forecast, by Distribution Channel 2019 & 2032
- Table 32: Global UK Water Enhancer Industry Revenue Million Forecast, by Country 2019 & 2032
- Table 33: Turkey UK Water Enhancer Industry Revenue (Million) Forecast, by Application 2019 & 2032
- Table 34: Israel UK Water Enhancer Industry Revenue (Million) Forecast, by Application 2019 & 2032
- Table 35: GCC UK Water Enhancer Industry Revenue (Million) Forecast, by Application 2019 & 2032
- Table 36: North Africa UK Water Enhancer Industry Revenue (Million) Forecast, by Application 2019 & 2032
- Table 37: South Africa UK Water Enhancer Industry Revenue (Million) Forecast, by Application 2019 & 2032
- Table 38: Rest of Middle East & Africa UK Water Enhancer Industry Revenue (Million) Forecast, by Application 2019 & 2032
- Table 39: Global UK Water Enhancer Industry Revenue Million Forecast, by Distribution Channel 2019 & 2032
- Table 40: Global UK Water Enhancer Industry Revenue Million Forecast, by Country 2019 & 2032
- Table 41: China UK Water Enhancer Industry Revenue (Million) Forecast, by Application 2019 & 2032
- Table 42: India UK Water Enhancer Industry Revenue (Million) Forecast, by Application 2019 & 2032
- Table 43: Japan UK Water Enhancer Industry Revenue (Million) Forecast, by Application 2019 & 2032
- Table 44: South Korea UK Water Enhancer Industry Revenue (Million) Forecast, by Application 2019 & 2032
- Table 45: ASEAN UK Water Enhancer Industry Revenue (Million) Forecast, by Application 2019 & 2032
- Table 46: Oceania UK Water Enhancer Industry Revenue (Million) Forecast, by Application 2019 & 2032
- Table 47: Rest of Asia Pacific UK Water Enhancer Industry Revenue (Million) Forecast, by Application 2019 & 2032
Frequently Asked Questions
1. What is the projected Compound Annual Growth Rate (CAGR) of the UK Water Enhancer Industry?
The projected CAGR is approximately 5.82%.
2. Which companies are prominent players in the UK Water Enhancer Industry?
Key companies in the market include Dyla LLC, PepsiCo Inc, The Kraft Heinz Company, Nestle S A (Nuun), The Coca-Cola Company, Jelsert (Starburst), Refresco, Wisdom Natural Brands, Exante Diet Ltd, Britvic plc.
3. What are the main segments of the UK Water Enhancer Industry?
The market segments include Distribution Channel.
4. Can you provide details about the market size?
The market size is estimated to be USD XX Million as of 2022.
5. What are some drivers contributing to market growth?
Rise of e-commerce has made it easier for consumers to access a wide variety of water enhancers.
6. What are the notable trends driving market growth?
Growing trend towards personalized nutrition and functional beverages supports the market for water enhancers.
7. Are there any restraints impacting market growth?
Economic downturns or fluctuations in disposable income can impact consumer spending on non-essential products.
8. Can you provide examples of recent developments in the market?
In April 2022, Robinsons, a brand of Britvic plc launched water enhancer new Benefit Drops with added vitamins in four different flavors. Benefit drops are the perfect portable format for consumers on the go as they deliver great taste and additional vitamins in their water consumption.
9. What pricing options are available for accessing the report?
Pricing options include single-user, multi-user, and enterprise licenses priced at USD 3800, USD 4500, and USD 5800 respectively.
10. Is the market size provided in terms of value or volume?
The market size is provided in terms of value, measured in Million.
11. Are there any specific market keywords associated with the report?
Yes, the market keyword associated with the report is "UK Water Enhancer Industry," which aids in identifying and referencing the specific market segment covered.
12. How do I determine which pricing option suits my needs best?
The pricing options vary based on user requirements and access needs. Individual users may opt for single-user licenses, while businesses requiring broader access may choose multi-user or enterprise licenses for cost-effective access to the report.
13. Are there any additional resources or data provided in the UK Water Enhancer Industry report?
While the report offers comprehensive insights, it's advisable to review the specific contents or supplementary materials provided to ascertain if additional resources or data are available.
14. How can I stay updated on further developments or reports in the UK Water Enhancer Industry?
To stay informed about further developments, trends, and reports in the UK Water Enhancer Industry, consider subscribing to industry newsletters, following relevant companies and organizations, or regularly checking reputable industry news sources and publications.
Methodology
Step 1 - Identification of Relevant Samples Size from Population Database


Step 2 - Approaches for Defining Global Market Size (Value, Volume* & Price*)

Note*: In applicable scenarios
Step 3 - Data Sources
Primary Research
- Web Analytics
- Survey Reports
- Research Institute
- Latest Research Reports
- Opinion Leaders
Secondary Research
- Annual Reports
- White Paper
- Latest Press Release
- Industry Association
- Paid Database
- Investor Presentations

Step 4 - Data Triangulation
Involves using different sources of information in order to increase the validity of a study
These sources are likely to be stakeholders in a program - participants, other researchers, program staff, other community members, and so on.
Then we put all data in single framework & apply various statistical tools to find out the dynamic on the market.
During the analysis stage, feedback from the stakeholder groups would be compared to determine areas of agreement as well as areas of divergence
