

Key Insights
The transdermal drug delivery systems market is experiencing robust growth, projected to reach a substantial size driven by several key factors. The market's Compound Annual Growth Rate (CAGR) of 8.50% from 2019-2033 indicates a significant expansion, fueled by increasing demand for non-invasive drug administration methods. Patient preference for painless and convenient drug delivery, coupled with the growing prevalence of chronic diseases requiring long-term medication, significantly boosts market expansion. Technological advancements in patch design and formulation are leading to improved drug efficacy and patient compliance, further stimulating market growth. The diverse range of applications, including pain management, hormone replacement therapy, and nicotine cessation, contributes to market diversification. Specific segments, such as dermal patches and semi-solid formulations (creams and ointments), are expected to maintain a dominant market share due to established usage and ease of application. However, challenges remain, such as skin permeability limitations and potential skin irritation. Despite these challenges, ongoing research and development efforts focused on overcoming these hurdles promise continued market expansion.
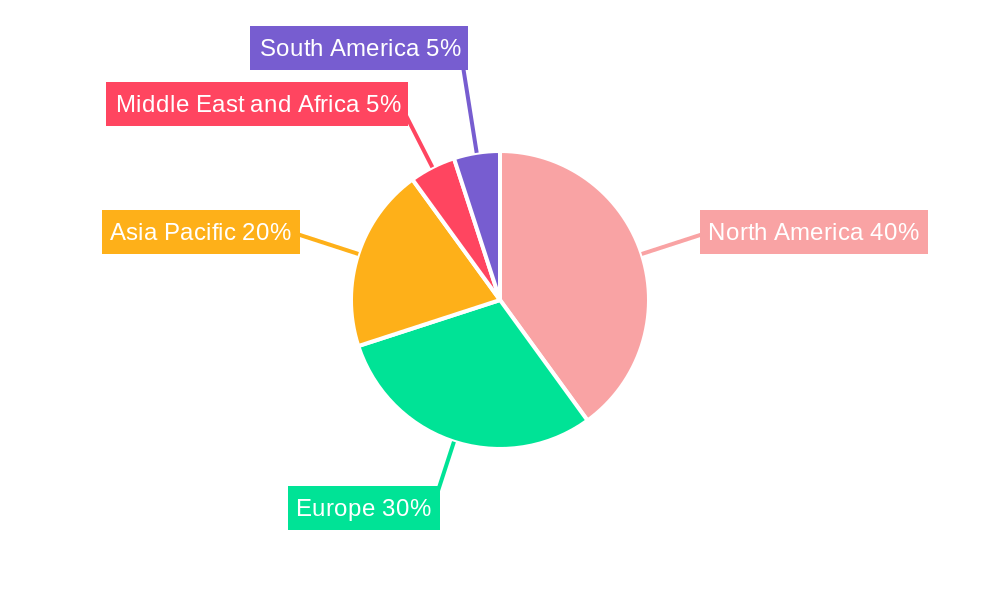
Leading pharmaceutical companies like Johnson & Johnson, Pfizer, and Novartis are actively investing in research and development, driving innovation and introducing advanced transdermal drug delivery systems. Geographic expansion is also a notable market driver, with North America and Europe currently holding significant market share due to high healthcare expenditure and advanced medical infrastructure. However, the Asia-Pacific region is anticipated to witness the fastest growth, driven by rising healthcare awareness, increasing disposable incomes, and a growing geriatric population. This signifies a substantial opportunity for market players to penetrate emerging markets and leverage the increasing demand for improved drug delivery solutions. The continued focus on improving patient experience, alongside technological advancements in materials science and formulation, points to a sustained period of growth and innovation within the transdermal drug delivery systems market.
Transdermal Drug Delivery Systems Industry: A Comprehensive Market Report (2019-2033)
This insightful report provides a detailed analysis of the Transdermal Drug Delivery Systems market, offering a comprehensive overview of its current state, future trends, and key players. With a study period spanning 2019-2033, a base year of 2025, and a forecast period of 2025-2033, this report is an indispensable resource for stakeholders seeking to understand and capitalize on the growth opportunities within this dynamic sector. The global market size is estimated at xx Million in 2025 and is projected to reach xx Million by 2033.
Transdermal Drug Delivery Systems Industry Market Composition & Trends
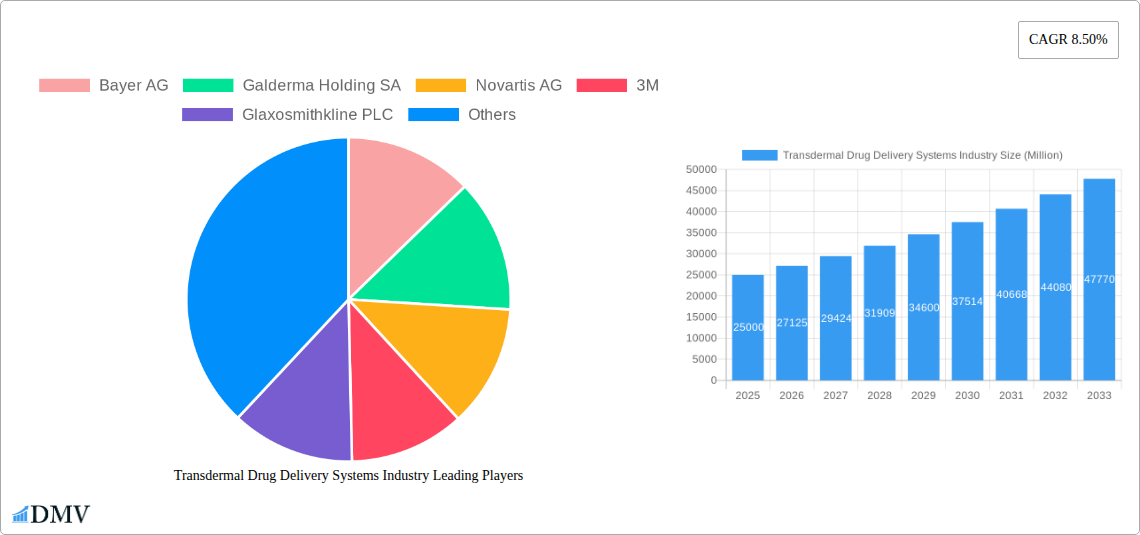
This section delves into the competitive landscape of the transdermal drug delivery systems market, examining market concentration, innovation drivers, regulatory frameworks, substitute products, end-user profiles, and mergers & acquisitions (M&A) activity. The market is characterized by a moderate level of concentration, with key players such as Bayer AG, Galderma Holding SA, Novartis AG, and Johnson & Johnson (Janssen Pharmaceutical) holding significant market share. However, the presence of numerous smaller companies and emerging players signifies a dynamic and competitive environment.
- Market Share Distribution: The top five players collectively hold approximately xx% of the global market share in 2025, with Bayer AG estimated to lead at xx%. The remaining share is distributed among numerous other companies.
- Innovation Catalysts: Advancements in materials science, nanotechnology, and micro-needle technology are driving innovation in drug formulation and delivery, leading to improved efficacy and patient compliance.
- Regulatory Landscape: Stringent regulatory approvals and compliance requirements, particularly in developed markets, present both challenges and opportunities for market players. Navigating these regulatory hurdles can be a significant factor in market success.
- Substitute Products: Oral and injectable drug delivery systems remain primary competitors, although transdermal systems are gaining traction due to improved patient convenience and reduced side effects.
- End-User Profiles: The primary end-users are pharmaceutical companies, hospitals, clinics, and individual patients. Increasing prevalence of chronic diseases is driving demand for convenient and effective transdermal drug delivery systems.
- M&A Activity: The industry has witnessed significant M&A activity in recent years, driven by a desire for expansion, technological acquisition, and portfolio diversification. The total value of M&A deals in the period 2019-2024 was estimated at xx Million.
Transdermal Drug Delivery Systems Industry Industry Evolution
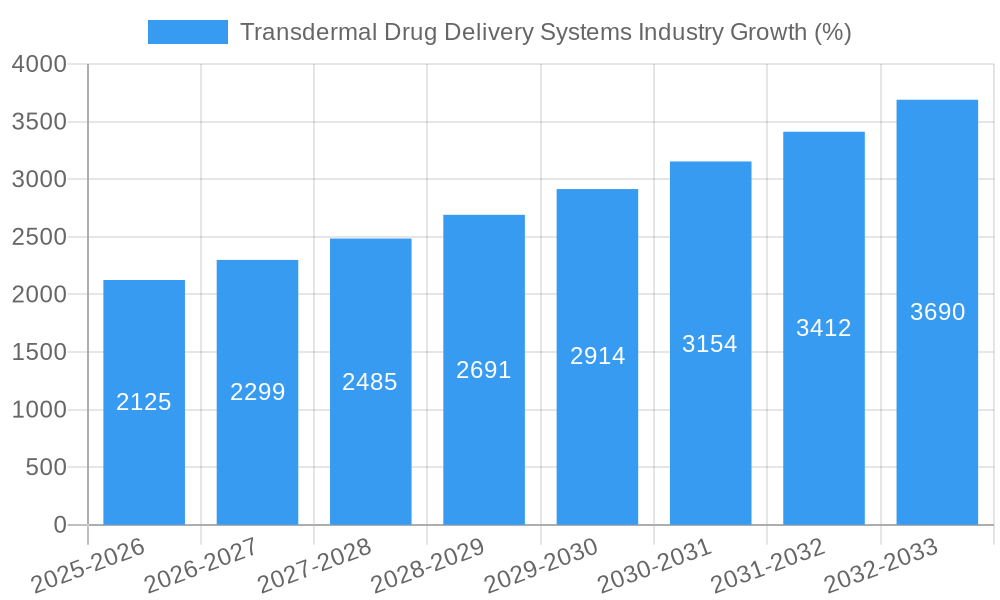
This section analyzes the historical and projected growth trajectories of the transdermal drug delivery systems market. From 2019 to 2024, the market experienced a Compound Annual Growth Rate (CAGR) of approximately xx%. Technological advancements, such as the development of microneedle patches and improved adhesive technologies, have significantly contributed to this growth. Furthermore, shifting consumer preferences towards non-invasive and convenient drug delivery methods fuel the expansion of the market. The forecast period (2025-2033) projects a CAGR of xx%, driven by the growing prevalence of chronic diseases, an aging global population, and continuous technological improvements. Adoption of advanced transdermal patches is expected to increase by xx% during the forecast period.
Leading Regions, Countries, or Segments in Transdermal Drug Delivery Systems Industry
North America currently holds the largest market share, primarily driven by high healthcare expenditure, strong regulatory support, and a large patient base with chronic diseases. However, the Asia-Pacific region is expected to witness the highest growth rate during the forecast period, fueled by increasing healthcare spending, rising prevalence of chronic diseases, and growing awareness of transdermal drug delivery systems.
Key Drivers:
By Route of Administration:
- Dermal: High market share driven by ease of application and widespread acceptance.
- Ophthalmic: Growing adoption due to targeted drug delivery to the eye.
- Nasal: Increasing applications in treating respiratory ailments.
By Product:
- Semi-Solid (Creams, Ointments): High market share due to established usage and relatively simple formulation.
- Liquid (Devices): Rapid growth expected due to advancements in microneedle and other innovative delivery technologies.
Dominance Factors:
North America's dominance is attributed to advanced healthcare infrastructure, high disposable incomes, and strong regulatory approvals. The Asia-Pacific region's rapid growth is fueled by population demographics, increasing healthcare investments, and the growing prevalence of chronic diseases requiring convenient drug delivery solutions.
Transdermal Drug Delivery Systems Industry Product Innovations
Recent innovations include the development of microneedle patches, which offer painless drug delivery and improved bioavailability. Other advancements focus on enhanced adhesive technologies, controlled drug release mechanisms, and improved formulations for enhanced patient comfort and efficacy. These innovations address limitations of traditional transdermal patches, leading to improved patient compliance and therapeutic outcomes. Unique selling propositions include reduced pain, increased efficacy, and improved convenience.
Propelling Factors for Transdermal Drug Delivery Systems Industry Growth
Several factors contribute to the growth of the transdermal drug delivery systems market. Technological advancements in drug formulation, materials science, and device engineering are leading to more effective and user-friendly products. The rising prevalence of chronic diseases, coupled with an aging global population, fuels demand for convenient and non-invasive drug delivery methods. Furthermore, supportive government regulations and increasing healthcare expenditure in several regions drive market expansion.
Obstacles in the Transdermal Drug Delivery Systems Industry Market
Challenges include stringent regulatory approvals, potential skin irritation, and inconsistent drug absorption rates. Supply chain disruptions can impact the availability of raw materials, impacting production and market supply. Competitive pressures from other drug delivery systems also pose a challenge to market growth. These factors can collectively restrict market expansion.
Future Opportunities in Transdermal Drug Delivery Systems Industry
Emerging opportunities exist in the development of personalized drug delivery systems tailored to individual patient needs. Advancements in microneedle technology and smart patches with integrated sensors and drug release control offer significant potential for improvement. Expansion into new therapeutic areas and untapped markets, particularly in developing countries, presents significant growth prospects.
Major Players in the Transdermal Drug Delivery Systems Industry Ecosystem
- Bayer AG
- Galderma Holding SA
- Novartis AG
- 3M
- Glaxosmithkline PLC
- Johnson & Johnson (Janssen Pharmaceutical)
- Pfizer Inc
- Viatris
- Cipla Limited
- Medpharm
- Hisamitsu Pharmaceuticals
- Bausch Health Companies Inc
Key Developments in Transdermal Drug Delivery Systems Industry Industry
- July 2022: The United States Food and Drug Administration (FDA) approved Aleor Dermaceuticals' Abbreviated New Drug Application (ANDA) for Diclofenac Sodium Topical Gel, 3%, for treating actinic keratoses. This expands treatment options for this skin condition.
- July 2022: The FDA approved Arcutis Biotherapeutics' New Drug Application (NDA) for ZORYVE (roflumilast) cream 0.3% for treating plaque psoriasis in patients 12 years or older. This represents a significant advancement in psoriasis treatment.
Strategic Transdermal Drug Delivery Systems Industry Market Forecast
The transdermal drug delivery systems market is poised for significant growth driven by technological advancements, increasing prevalence of chronic diseases, and supportive regulatory frameworks. The market's future potential is substantial, with continued innovation in drug delivery mechanisms and expansion into new therapeutic areas promising robust growth over the forecast period. The integration of smart technologies and personalized medicine approaches further enhances the market's long-term prospects.
Transdermal Drug Delivery Systems Industry Segmentation
-
1. Route of Administration
- 1.1. Dermal
- 1.2. Ophthalmic
- 1.3. Nasal
- 1.4. Oral
- 1.5. Others
-
2. Product
-
2.1. Formulation
- 2.1.1. Solid
-
2.1.2. Semi-Solid
- 2.1.2.1. Creams
- 2.1.2.2. Ointment
- 2.1.2.3. Others
- 2.1.3. Liquid
-
2.2. Device
- 2.2.1. Inhaler
- 2.2.2. Patch
-
2.1. Formulation
Transdermal Drug Delivery Systems Industry Segmentation By Geography
-
1. North America
- 1.1. United States
- 1.2. Canada
- 1.3. Mexico
-
2. Europe
- 2.1. Germany
- 2.2. United Kingdom
- 2.3. France
- 2.4. Italy
- 2.5. Spain
- 2.6. Rest of Europe
-
3. Asia Pacific
- 3.1. China
- 3.2. Japan
- 3.3. India
- 3.4. Australia
- 3.5. South Korea
- 3.6. Rest of Asia Pacific
-
4. Middle East and Africa
- 4.1. GCC
- 4.2. South Africa
- 4.3. Rest of Middle East and Africa
-
5. South America
- 5.1. Brazil
- 5.2. Argentina
- 5.3. Rest of South America
Transdermal Drug Delivery Systems Industry REPORT HIGHLIGHTS
| Aspects | Details |
|---|---|
| Study Period | 2019-2033 |
| Base Year | 2024 |
| Estimated Year | 2025 |
| Forecast Period | 2025-2033 |
| Historical Period | 2019-2024 |
| Growth Rate | CAGR of 8.50% from 2019-2033 |
| Segmentation |
|
Table of Contents
- 1. Introduction
- 1.1. Research Scope
- 1.2. Market Segmentation
- 1.3. Research Methodology
- 1.4. Definitions and Assumptions
- 2. Executive Summary
- 2.1. Introduction
- 3. Market Dynamics
- 3.1. Introduction
- 3.2. Market Drivers
- 3.2.1. High Prevalence of Skin Diseases; Technological Advancements and Innovations
- 3.3. Market Restrains
- 3.3.1. Regulatory Scenario and Pricing Pressure; High Frequency of Product Recalls
- 3.4. Market Trends
- 3.4.1. Patch Segment is Expected to Hold Major Share in the Topical Drug Delivery Market Over the Forecast Period
- 4. Market Factor Analysis
- 4.1. Porters Five Forces
- 4.2. Supply/Value Chain
- 4.3. PESTEL analysis
- 4.4. Market Entropy
- 4.5. Patent/Trademark Analysis
- 5. Global Transdermal Drug Delivery Systems Industry Analysis, Insights and Forecast, 2019-2031
- 5.1. Market Analysis, Insights and Forecast - by Route of Administration
- 5.1.1. Dermal
- 5.1.2. Ophthalmic
- 5.1.3. Nasal
- 5.1.4. Oral
- 5.1.5. Others
- 5.2. Market Analysis, Insights and Forecast - by Product
- 5.2.1. Formulation
- 5.2.1.1. Solid
- 5.2.1.2. Semi-Solid
- 5.2.1.2.1. Creams
- 5.2.1.2.2. Ointment
- 5.2.1.2.3. Others
- 5.2.1.3. Liquid
- 5.2.2. Device
- 5.2.2.1. Inhaler
- 5.2.2.2. Patch
- 5.2.1. Formulation
- 5.3. Market Analysis, Insights and Forecast - by Region
- 5.3.1. North America
- 5.3.2. Europe
- 5.3.3. Asia Pacific
- 5.3.4. Middle East and Africa
- 5.3.5. South America
- 5.1. Market Analysis, Insights and Forecast - by Route of Administration
- 6. North America Transdermal Drug Delivery Systems Industry Analysis, Insights and Forecast, 2019-2031
- 6.1. Market Analysis, Insights and Forecast - by Route of Administration
- 6.1.1. Dermal
- 6.1.2. Ophthalmic
- 6.1.3. Nasal
- 6.1.4. Oral
- 6.1.5. Others
- 6.2. Market Analysis, Insights and Forecast - by Product
- 6.2.1. Formulation
- 6.2.1.1. Solid
- 6.2.1.2. Semi-Solid
- 6.2.1.2.1. Creams
- 6.2.1.2.2. Ointment
- 6.2.1.2.3. Others
- 6.2.1.3. Liquid
- 6.2.2. Device
- 6.2.2.1. Inhaler
- 6.2.2.2. Patch
- 6.2.1. Formulation
- 6.1. Market Analysis, Insights and Forecast - by Route of Administration
- 7. Europe Transdermal Drug Delivery Systems Industry Analysis, Insights and Forecast, 2019-2031
- 7.1. Market Analysis, Insights and Forecast - by Route of Administration
- 7.1.1. Dermal
- 7.1.2. Ophthalmic
- 7.1.3. Nasal
- 7.1.4. Oral
- 7.1.5. Others
- 7.2. Market Analysis, Insights and Forecast - by Product
- 7.2.1. Formulation
- 7.2.1.1. Solid
- 7.2.1.2. Semi-Solid
- 7.2.1.2.1. Creams
- 7.2.1.2.2. Ointment
- 7.2.1.2.3. Others
- 7.2.1.3. Liquid
- 7.2.2. Device
- 7.2.2.1. Inhaler
- 7.2.2.2. Patch
- 7.2.1. Formulation
- 7.1. Market Analysis, Insights and Forecast - by Route of Administration
- 8. Asia Pacific Transdermal Drug Delivery Systems Industry Analysis, Insights and Forecast, 2019-2031
- 8.1. Market Analysis, Insights and Forecast - by Route of Administration
- 8.1.1. Dermal
- 8.1.2. Ophthalmic
- 8.1.3. Nasal
- 8.1.4. Oral
- 8.1.5. Others
- 8.2. Market Analysis, Insights and Forecast - by Product
- 8.2.1. Formulation
- 8.2.1.1. Solid
- 8.2.1.2. Semi-Solid
- 8.2.1.2.1. Creams
- 8.2.1.2.2. Ointment
- 8.2.1.2.3. Others
- 8.2.1.3. Liquid
- 8.2.2. Device
- 8.2.2.1. Inhaler
- 8.2.2.2. Patch
- 8.2.1. Formulation
- 8.1. Market Analysis, Insights and Forecast - by Route of Administration
- 9. Middle East and Africa Transdermal Drug Delivery Systems Industry Analysis, Insights and Forecast, 2019-2031
- 9.1. Market Analysis, Insights and Forecast - by Route of Administration
- 9.1.1. Dermal
- 9.1.2. Ophthalmic
- 9.1.3. Nasal
- 9.1.4. Oral
- 9.1.5. Others
- 9.2. Market Analysis, Insights and Forecast - by Product
- 9.2.1. Formulation
- 9.2.1.1. Solid
- 9.2.1.2. Semi-Solid
- 9.2.1.2.1. Creams
- 9.2.1.2.2. Ointment
- 9.2.1.2.3. Others
- 9.2.1.3. Liquid
- 9.2.2. Device
- 9.2.2.1. Inhaler
- 9.2.2.2. Patch
- 9.2.1. Formulation
- 9.1. Market Analysis, Insights and Forecast - by Route of Administration
- 10. South America Transdermal Drug Delivery Systems Industry Analysis, Insights and Forecast, 2019-2031
- 10.1. Market Analysis, Insights and Forecast - by Route of Administration
- 10.1.1. Dermal
- 10.1.2. Ophthalmic
- 10.1.3. Nasal
- 10.1.4. Oral
- 10.1.5. Others
- 10.2. Market Analysis, Insights and Forecast - by Product
- 10.2.1. Formulation
- 10.2.1.1. Solid
- 10.2.1.2. Semi-Solid
- 10.2.1.2.1. Creams
- 10.2.1.2.2. Ointment
- 10.2.1.2.3. Others
- 10.2.1.3. Liquid
- 10.2.2. Device
- 10.2.2.1. Inhaler
- 10.2.2.2. Patch
- 10.2.1. Formulation
- 10.1. Market Analysis, Insights and Forecast - by Route of Administration
- 11. North America Transdermal Drug Delivery Systems Industry Analysis, Insights and Forecast, 2019-2031
- 11.1. Market Analysis, Insights and Forecast - By Country/Sub-region
- 11.1.1 United States
- 11.1.2 Canada
- 11.1.3 Mexico
- 12. Europe Transdermal Drug Delivery Systems Industry Analysis, Insights and Forecast, 2019-2031
- 12.1. Market Analysis, Insights and Forecast - By Country/Sub-region
- 12.1.1 Germany
- 12.1.2 United Kingdom
- 12.1.3 France
- 12.1.4 Italy
- 12.1.5 Spain
- 12.1.6 Rest of Europe
- 13. Asia Pacific Transdermal Drug Delivery Systems Industry Analysis, Insights and Forecast, 2019-2031
- 13.1. Market Analysis, Insights and Forecast - By Country/Sub-region
- 13.1.1 China
- 13.1.2 Japan
- 13.1.3 India
- 13.1.4 Australia
- 13.1.5 South Korea
- 13.1.6 Rest of Asia Pacific
- 14. Middle East and Africa Transdermal Drug Delivery Systems Industry Analysis, Insights and Forecast, 2019-2031
- 14.1. Market Analysis, Insights and Forecast - By Country/Sub-region
- 14.1.1 GCC
- 14.1.2 South Africa
- 14.1.3 Rest of Middle East and Africa
- 15. South America Transdermal Drug Delivery Systems Industry Analysis, Insights and Forecast, 2019-2031
- 15.1. Market Analysis, Insights and Forecast - By Country/Sub-region
- 15.1.1 Brazil
- 15.1.2 Argentina
- 15.1.3 Rest of South America
- 16. Competitive Analysis
- 16.1. Global Market Share Analysis 2024
- 16.2. Company Profiles
- 16.2.1 Bayer AG
- 16.2.1.1. Overview
- 16.2.1.2. Products
- 16.2.1.3. SWOT Analysis
- 16.2.1.4. Recent Developments
- 16.2.1.5. Financials (Based on Availability)
- 16.2.2 Galderma Holding SA
- 16.2.2.1. Overview
- 16.2.2.2. Products
- 16.2.2.3. SWOT Analysis
- 16.2.2.4. Recent Developments
- 16.2.2.5. Financials (Based on Availability)
- 16.2.3 Novartis AG
- 16.2.3.1. Overview
- 16.2.3.2. Products
- 16.2.3.3. SWOT Analysis
- 16.2.3.4. Recent Developments
- 16.2.3.5. Financials (Based on Availability)
- 16.2.4 3M
- 16.2.4.1. Overview
- 16.2.4.2. Products
- 16.2.4.3. SWOT Analysis
- 16.2.4.4. Recent Developments
- 16.2.4.5. Financials (Based on Availability)
- 16.2.5 Glaxosmithkline PLC
- 16.2.5.1. Overview
- 16.2.5.2. Products
- 16.2.5.3. SWOT Analysis
- 16.2.5.4. Recent Developments
- 16.2.5.5. Financials (Based on Availability)
- 16.2.6 Johnson & Johnson (Janssen Pharmaceutical)
- 16.2.6.1. Overview
- 16.2.6.2. Products
- 16.2.6.3. SWOT Analysis
- 16.2.6.4. Recent Developments
- 16.2.6.5. Financials (Based on Availability)
- 16.2.7 Pfizer Inc *List Not Exhaustive
- 16.2.7.1. Overview
- 16.2.7.2. Products
- 16.2.7.3. SWOT Analysis
- 16.2.7.4. Recent Developments
- 16.2.7.5. Financials (Based on Availability)
- 16.2.8 Viatris
- 16.2.8.1. Overview
- 16.2.8.2. Products
- 16.2.8.3. SWOT Analysis
- 16.2.8.4. Recent Developments
- 16.2.8.5. Financials (Based on Availability)
- 16.2.9 Cipla Limited
- 16.2.9.1. Overview
- 16.2.9.2. Products
- 16.2.9.3. SWOT Analysis
- 16.2.9.4. Recent Developments
- 16.2.9.5. Financials (Based on Availability)
- 16.2.10 Medpharm
- 16.2.10.1. Overview
- 16.2.10.2. Products
- 16.2.10.3. SWOT Analysis
- 16.2.10.4. Recent Developments
- 16.2.10.5. Financials (Based on Availability)
- 16.2.11 Hisamitsu Pharmaceuticals
- 16.2.11.1. Overview
- 16.2.11.2. Products
- 16.2.11.3. SWOT Analysis
- 16.2.11.4. Recent Developments
- 16.2.11.5. Financials (Based on Availability)
- 16.2.12 Bausch Health Companies Inc
- 16.2.12.1. Overview
- 16.2.12.2. Products
- 16.2.12.3. SWOT Analysis
- 16.2.12.4. Recent Developments
- 16.2.12.5. Financials (Based on Availability)
- 16.2.1 Bayer AG
List of Figures
- Figure 1: Global Transdermal Drug Delivery Systems Industry Revenue Breakdown (Million, %) by Region 2024 & 2032
- Figure 2: North America Transdermal Drug Delivery Systems Industry Revenue (Million), by Country 2024 & 2032
- Figure 3: North America Transdermal Drug Delivery Systems Industry Revenue Share (%), by Country 2024 & 2032
- Figure 4: Europe Transdermal Drug Delivery Systems Industry Revenue (Million), by Country 2024 & 2032
- Figure 5: Europe Transdermal Drug Delivery Systems Industry Revenue Share (%), by Country 2024 & 2032
- Figure 6: Asia Pacific Transdermal Drug Delivery Systems Industry Revenue (Million), by Country 2024 & 2032
- Figure 7: Asia Pacific Transdermal Drug Delivery Systems Industry Revenue Share (%), by Country 2024 & 2032
- Figure 8: Middle East and Africa Transdermal Drug Delivery Systems Industry Revenue (Million), by Country 2024 & 2032
- Figure 9: Middle East and Africa Transdermal Drug Delivery Systems Industry Revenue Share (%), by Country 2024 & 2032
- Figure 10: South America Transdermal Drug Delivery Systems Industry Revenue (Million), by Country 2024 & 2032
- Figure 11: South America Transdermal Drug Delivery Systems Industry Revenue Share (%), by Country 2024 & 2032
- Figure 12: North America Transdermal Drug Delivery Systems Industry Revenue (Million), by Route of Administration 2024 & 2032
- Figure 13: North America Transdermal Drug Delivery Systems Industry Revenue Share (%), by Route of Administration 2024 & 2032
- Figure 14: North America Transdermal Drug Delivery Systems Industry Revenue (Million), by Product 2024 & 2032
- Figure 15: North America Transdermal Drug Delivery Systems Industry Revenue Share (%), by Product 2024 & 2032
- Figure 16: North America Transdermal Drug Delivery Systems Industry Revenue (Million), by Country 2024 & 2032
- Figure 17: North America Transdermal Drug Delivery Systems Industry Revenue Share (%), by Country 2024 & 2032
- Figure 18: Europe Transdermal Drug Delivery Systems Industry Revenue (Million), by Route of Administration 2024 & 2032
- Figure 19: Europe Transdermal Drug Delivery Systems Industry Revenue Share (%), by Route of Administration 2024 & 2032
- Figure 20: Europe Transdermal Drug Delivery Systems Industry Revenue (Million), by Product 2024 & 2032
- Figure 21: Europe Transdermal Drug Delivery Systems Industry Revenue Share (%), by Product 2024 & 2032
- Figure 22: Europe Transdermal Drug Delivery Systems Industry Revenue (Million), by Country 2024 & 2032
- Figure 23: Europe Transdermal Drug Delivery Systems Industry Revenue Share (%), by Country 2024 & 2032
- Figure 24: Asia Pacific Transdermal Drug Delivery Systems Industry Revenue (Million), by Route of Administration 2024 & 2032
- Figure 25: Asia Pacific Transdermal Drug Delivery Systems Industry Revenue Share (%), by Route of Administration 2024 & 2032
- Figure 26: Asia Pacific Transdermal Drug Delivery Systems Industry Revenue (Million), by Product 2024 & 2032
- Figure 27: Asia Pacific Transdermal Drug Delivery Systems Industry Revenue Share (%), by Product 2024 & 2032
- Figure 28: Asia Pacific Transdermal Drug Delivery Systems Industry Revenue (Million), by Country 2024 & 2032
- Figure 29: Asia Pacific Transdermal Drug Delivery Systems Industry Revenue Share (%), by Country 2024 & 2032
- Figure 30: Middle East and Africa Transdermal Drug Delivery Systems Industry Revenue (Million), by Route of Administration 2024 & 2032
- Figure 31: Middle East and Africa Transdermal Drug Delivery Systems Industry Revenue Share (%), by Route of Administration 2024 & 2032
- Figure 32: Middle East and Africa Transdermal Drug Delivery Systems Industry Revenue (Million), by Product 2024 & 2032
- Figure 33: Middle East and Africa Transdermal Drug Delivery Systems Industry Revenue Share (%), by Product 2024 & 2032
- Figure 34: Middle East and Africa Transdermal Drug Delivery Systems Industry Revenue (Million), by Country 2024 & 2032
- Figure 35: Middle East and Africa Transdermal Drug Delivery Systems Industry Revenue Share (%), by Country 2024 & 2032
- Figure 36: South America Transdermal Drug Delivery Systems Industry Revenue (Million), by Route of Administration 2024 & 2032
- Figure 37: South America Transdermal Drug Delivery Systems Industry Revenue Share (%), by Route of Administration 2024 & 2032
- Figure 38: South America Transdermal Drug Delivery Systems Industry Revenue (Million), by Product 2024 & 2032
- Figure 39: South America Transdermal Drug Delivery Systems Industry Revenue Share (%), by Product 2024 & 2032
- Figure 40: South America Transdermal Drug Delivery Systems Industry Revenue (Million), by Country 2024 & 2032
- Figure 41: South America Transdermal Drug Delivery Systems Industry Revenue Share (%), by Country 2024 & 2032
List of Tables
- Table 1: Global Transdermal Drug Delivery Systems Industry Revenue Million Forecast, by Region 2019 & 2032
- Table 2: Global Transdermal Drug Delivery Systems Industry Revenue Million Forecast, by Route of Administration 2019 & 2032
- Table 3: Global Transdermal Drug Delivery Systems Industry Revenue Million Forecast, by Product 2019 & 2032
- Table 4: Global Transdermal Drug Delivery Systems Industry Revenue Million Forecast, by Region 2019 & 2032
- Table 5: Global Transdermal Drug Delivery Systems Industry Revenue Million Forecast, by Country 2019 & 2032
- Table 6: United States Transdermal Drug Delivery Systems Industry Revenue (Million) Forecast, by Application 2019 & 2032
- Table 7: Canada Transdermal Drug Delivery Systems Industry Revenue (Million) Forecast, by Application 2019 & 2032
- Table 8: Mexico Transdermal Drug Delivery Systems Industry Revenue (Million) Forecast, by Application 2019 & 2032
- Table 9: Global Transdermal Drug Delivery Systems Industry Revenue Million Forecast, by Country 2019 & 2032
- Table 10: Germany Transdermal Drug Delivery Systems Industry Revenue (Million) Forecast, by Application 2019 & 2032
- Table 11: United Kingdom Transdermal Drug Delivery Systems Industry Revenue (Million) Forecast, by Application 2019 & 2032
- Table 12: France Transdermal Drug Delivery Systems Industry Revenue (Million) Forecast, by Application 2019 & 2032
- Table 13: Italy Transdermal Drug Delivery Systems Industry Revenue (Million) Forecast, by Application 2019 & 2032
- Table 14: Spain Transdermal Drug Delivery Systems Industry Revenue (Million) Forecast, by Application 2019 & 2032
- Table 15: Rest of Europe Transdermal Drug Delivery Systems Industry Revenue (Million) Forecast, by Application 2019 & 2032
- Table 16: Global Transdermal Drug Delivery Systems Industry Revenue Million Forecast, by Country 2019 & 2032
- Table 17: China Transdermal Drug Delivery Systems Industry Revenue (Million) Forecast, by Application 2019 & 2032
- Table 18: Japan Transdermal Drug Delivery Systems Industry Revenue (Million) Forecast, by Application 2019 & 2032
- Table 19: India Transdermal Drug Delivery Systems Industry Revenue (Million) Forecast, by Application 2019 & 2032
- Table 20: Australia Transdermal Drug Delivery Systems Industry Revenue (Million) Forecast, by Application 2019 & 2032
- Table 21: South Korea Transdermal Drug Delivery Systems Industry Revenue (Million) Forecast, by Application 2019 & 2032
- Table 22: Rest of Asia Pacific Transdermal Drug Delivery Systems Industry Revenue (Million) Forecast, by Application 2019 & 2032
- Table 23: Global Transdermal Drug Delivery Systems Industry Revenue Million Forecast, by Country 2019 & 2032
- Table 24: GCC Transdermal Drug Delivery Systems Industry Revenue (Million) Forecast, by Application 2019 & 2032
- Table 25: South Africa Transdermal Drug Delivery Systems Industry Revenue (Million) Forecast, by Application 2019 & 2032
- Table 26: Rest of Middle East and Africa Transdermal Drug Delivery Systems Industry Revenue (Million) Forecast, by Application 2019 & 2032
- Table 27: Global Transdermal Drug Delivery Systems Industry Revenue Million Forecast, by Country 2019 & 2032
- Table 28: Brazil Transdermal Drug Delivery Systems Industry Revenue (Million) Forecast, by Application 2019 & 2032
- Table 29: Argentina Transdermal Drug Delivery Systems Industry Revenue (Million) Forecast, by Application 2019 & 2032
- Table 30: Rest of South America Transdermal Drug Delivery Systems Industry Revenue (Million) Forecast, by Application 2019 & 2032
- Table 31: Global Transdermal Drug Delivery Systems Industry Revenue Million Forecast, by Route of Administration 2019 & 2032
- Table 32: Global Transdermal Drug Delivery Systems Industry Revenue Million Forecast, by Product 2019 & 2032
- Table 33: Global Transdermal Drug Delivery Systems Industry Revenue Million Forecast, by Country 2019 & 2032
- Table 34: United States Transdermal Drug Delivery Systems Industry Revenue (Million) Forecast, by Application 2019 & 2032
- Table 35: Canada Transdermal Drug Delivery Systems Industry Revenue (Million) Forecast, by Application 2019 & 2032
- Table 36: Mexico Transdermal Drug Delivery Systems Industry Revenue (Million) Forecast, by Application 2019 & 2032
- Table 37: Global Transdermal Drug Delivery Systems Industry Revenue Million Forecast, by Route of Administration 2019 & 2032
- Table 38: Global Transdermal Drug Delivery Systems Industry Revenue Million Forecast, by Product 2019 & 2032
- Table 39: Global Transdermal Drug Delivery Systems Industry Revenue Million Forecast, by Country 2019 & 2032
- Table 40: Germany Transdermal Drug Delivery Systems Industry Revenue (Million) Forecast, by Application 2019 & 2032
- Table 41: United Kingdom Transdermal Drug Delivery Systems Industry Revenue (Million) Forecast, by Application 2019 & 2032
- Table 42: France Transdermal Drug Delivery Systems Industry Revenue (Million) Forecast, by Application 2019 & 2032
- Table 43: Italy Transdermal Drug Delivery Systems Industry Revenue (Million) Forecast, by Application 2019 & 2032
- Table 44: Spain Transdermal Drug Delivery Systems Industry Revenue (Million) Forecast, by Application 2019 & 2032
- Table 45: Rest of Europe Transdermal Drug Delivery Systems Industry Revenue (Million) Forecast, by Application 2019 & 2032
- Table 46: Global Transdermal Drug Delivery Systems Industry Revenue Million Forecast, by Route of Administration 2019 & 2032
- Table 47: Global Transdermal Drug Delivery Systems Industry Revenue Million Forecast, by Product 2019 & 2032
- Table 48: Global Transdermal Drug Delivery Systems Industry Revenue Million Forecast, by Country 2019 & 2032
- Table 49: China Transdermal Drug Delivery Systems Industry Revenue (Million) Forecast, by Application 2019 & 2032
- Table 50: Japan Transdermal Drug Delivery Systems Industry Revenue (Million) Forecast, by Application 2019 & 2032
- Table 51: India Transdermal Drug Delivery Systems Industry Revenue (Million) Forecast, by Application 2019 & 2032
- Table 52: Australia Transdermal Drug Delivery Systems Industry Revenue (Million) Forecast, by Application 2019 & 2032
- Table 53: South Korea Transdermal Drug Delivery Systems Industry Revenue (Million) Forecast, by Application 2019 & 2032
- Table 54: Rest of Asia Pacific Transdermal Drug Delivery Systems Industry Revenue (Million) Forecast, by Application 2019 & 2032
- Table 55: Global Transdermal Drug Delivery Systems Industry Revenue Million Forecast, by Route of Administration 2019 & 2032
- Table 56: Global Transdermal Drug Delivery Systems Industry Revenue Million Forecast, by Product 2019 & 2032
- Table 57: Global Transdermal Drug Delivery Systems Industry Revenue Million Forecast, by Country 2019 & 2032
- Table 58: GCC Transdermal Drug Delivery Systems Industry Revenue (Million) Forecast, by Application 2019 & 2032
- Table 59: South Africa Transdermal Drug Delivery Systems Industry Revenue (Million) Forecast, by Application 2019 & 2032
- Table 60: Rest of Middle East and Africa Transdermal Drug Delivery Systems Industry Revenue (Million) Forecast, by Application 2019 & 2032
- Table 61: Global Transdermal Drug Delivery Systems Industry Revenue Million Forecast, by Route of Administration 2019 & 2032
- Table 62: Global Transdermal Drug Delivery Systems Industry Revenue Million Forecast, by Product 2019 & 2032
- Table 63: Global Transdermal Drug Delivery Systems Industry Revenue Million Forecast, by Country 2019 & 2032
- Table 64: Brazil Transdermal Drug Delivery Systems Industry Revenue (Million) Forecast, by Application 2019 & 2032
- Table 65: Argentina Transdermal Drug Delivery Systems Industry Revenue (Million) Forecast, by Application 2019 & 2032
- Table 66: Rest of South America Transdermal Drug Delivery Systems Industry Revenue (Million) Forecast, by Application 2019 & 2032
Frequently Asked Questions
1. What is the projected Compound Annual Growth Rate (CAGR) of the Transdermal Drug Delivery Systems Industry?
The projected CAGR is approximately 8.50%.
2. Which companies are prominent players in the Transdermal Drug Delivery Systems Industry?
Key companies in the market include Bayer AG, Galderma Holding SA, Novartis AG, 3M, Glaxosmithkline PLC, Johnson & Johnson (Janssen Pharmaceutical), Pfizer Inc *List Not Exhaustive, Viatris, Cipla Limited, Medpharm, Hisamitsu Pharmaceuticals, Bausch Health Companies Inc.
3. What are the main segments of the Transdermal Drug Delivery Systems Industry?
The market segments include Route of Administration, Product.
4. Can you provide details about the market size?
The market size is estimated to be USD XX Million as of 2022.
5. What are some drivers contributing to market growth?
High Prevalence of Skin Diseases; Technological Advancements and Innovations.
6. What are the notable trends driving market growth?
Patch Segment is Expected to Hold Major Share in the Topical Drug Delivery Market Over the Forecast Period.
7. Are there any restraints impacting market growth?
Regulatory Scenario and Pricing Pressure; High Frequency of Product Recalls.
8. Can you provide examples of recent developments in the market?
In July 2022, the United States Food and Drug Administration approved Aleor Dermaceuticals, a subsidiary of Alembic Pharmaceuticals, Abbreviated New Drug Application (ANDA) for Diclofenac Sodium Topical Gel, 3%, for the topical treatment of actinic keratoses.
9. What pricing options are available for accessing the report?
Pricing options include single-user, multi-user, and enterprise licenses priced at USD 4750, USD 5250, and USD 8750 respectively.
10. Is the market size provided in terms of value or volume?
The market size is provided in terms of value, measured in Million.
11. Are there any specific market keywords associated with the report?
Yes, the market keyword associated with the report is "Transdermal Drug Delivery Systems Industry," which aids in identifying and referencing the specific market segment covered.
12. How do I determine which pricing option suits my needs best?
The pricing options vary based on user requirements and access needs. Individual users may opt for single-user licenses, while businesses requiring broader access may choose multi-user or enterprise licenses for cost-effective access to the report.
13. Are there any additional resources or data provided in the Transdermal Drug Delivery Systems Industry report?
While the report offers comprehensive insights, it's advisable to review the specific contents or supplementary materials provided to ascertain if additional resources or data are available.
14. How can I stay updated on further developments or reports in the Transdermal Drug Delivery Systems Industry?
To stay informed about further developments, trends, and reports in the Transdermal Drug Delivery Systems Industry, consider subscribing to industry newsletters, following relevant companies and organizations, or regularly checking reputable industry news sources and publications.
Methodology
Step 1 - Identification of Relevant Samples Size from Population Database


Step 2 - Approaches for Defining Global Market Size (Value, Volume* & Price*)

Note*: In applicable scenarios
Step 3 - Data Sources
Primary Research
- Web Analytics
- Survey Reports
- Research Institute
- Latest Research Reports
- Opinion Leaders
Secondary Research
- Annual Reports
- White Paper
- Latest Press Release
- Industry Association
- Paid Database
- Investor Presentations

Step 4 - Data Triangulation
Involves using different sources of information in order to increase the validity of a study
These sources are likely to be stakeholders in a program - participants, other researchers, program staff, other community members, and so on.
Then we put all data in single framework & apply various statistical tools to find out the dynamic on the market.
During the analysis stage, feedback from the stakeholder groups would be compared to determine areas of agreement as well as areas of divergence
