

Key Insights
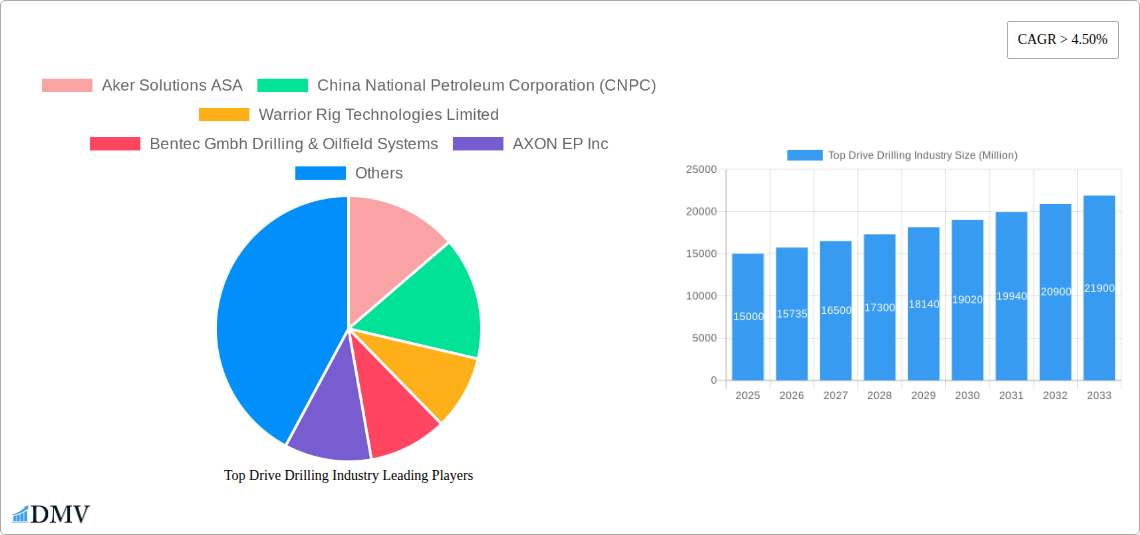
The global top drive drilling market is experiencing robust growth, driven by increasing oil and gas exploration and production activities worldwide. The market's Compound Annual Growth Rate (CAGR) exceeding 4.50% signifies a consistently expanding demand for efficient and technologically advanced drilling solutions. This growth is fueled by several key factors, including the rising adoption of electric top drives due to their enhanced precision, control, and energy efficiency compared to hydraulic counterparts. Furthermore, the shift towards offshore drilling projects, particularly in deepwater environments, presents lucrative opportunities for top drive manufacturers. Technological advancements such as automated drilling systems and improved data analytics further contribute to market expansion. The market is segmented by drive type (electric and hydraulic) and deployment location (onshore and offshore), with the electric top drive segment projected to witness faster growth due to its superior performance capabilities. Key players like Aker Solutions, CNPC, and Nabors Industries are investing significantly in research and development to stay ahead of the competition, offering innovative solutions that cater to the evolving needs of the oil and gas industry. Geographic expansion is also a significant driver, with regions like Asia Pacific and the Middle East and Africa experiencing substantial growth potential owing to rising energy demands and increasing investments in exploration and production activities. While challenges such as volatile oil prices and stringent environmental regulations exist, the overall market outlook remains positive, promising sustained growth in the coming years.
Despite the positive trajectory, the top drive drilling market faces certain constraints. Fluctuations in crude oil prices directly impact investment decisions in exploration and production, thus affecting the demand for top drives. Stringent environmental regulations and safety standards impose higher operational costs and require manufacturers to adopt eco-friendly technologies. Competition among established players and the entry of new companies also contribute to the price sensitivity in the market. However, the long-term prospects remain promising, driven by technological innovation, exploration in challenging terrains (deepwater and arctic regions), and the continuous need for improved drilling efficiency and reduced operational downtime. The market's segmentation offers diversified growth avenues for players catering to specific needs of various regions and drilling environments. Companies focusing on technological innovation, strategic partnerships, and regional expansion are well-positioned to capitalize on the market's growth opportunities. The market's future growth hinges on balancing technological advancement with sustainable practices to meet the global energy demand while minimizing environmental impact.
Top Drive Drilling Industry Market Report: 2019-2033
This comprehensive report provides an in-depth analysis of the Top Drive Drilling industry, offering crucial insights for stakeholders seeking to navigate this dynamic market. The report covers the period from 2019 to 2033, with a focus on the forecast period of 2025-2033 and a base year of 2025. Expect detailed analysis of market trends, technological advancements, key players, and future growth opportunities. The global Top Drive Drilling market is projected to reach xx Million by 2033, driven by increasing oil and gas exploration activities and technological innovations.
Top Drive Drilling Industry Market Composition & Trends
This section delves into the competitive landscape of the Top Drive Drilling market, analyzing market concentration, innovation drivers, regulatory frameworks, substitute products, end-user profiles, and mergers & acquisitions (M&A) activities. The global market is moderately concentrated, with several major players vying for market share. Innovation in electric top drives and automation technologies is a key driver of market growth. Stringent safety regulations and environmental concerns influence market dynamics. While there are some substitute technologies, the advantages of top drives in terms of efficiency and precision maintain their dominance. Key end users include oil and gas exploration and production companies, operating across onshore and offshore locations. M&A activity has been significant, shaping the competitive landscape.
- Market Share Distribution (2024): Schlumberger Limited holds approximately 20% market share, followed by National-Oilwell Varco Inc. at 15%, and Aker Solutions ASA at 12%. The remaining market share is distributed among numerous other players.
- Significant M&A Deals (2019-2024): A total of xx Million USD in M&A deals were recorded during this period, with an average deal size of xx Million USD. These transactions involved both large-scale acquisitions and strategic partnerships.
Top Drive Drilling Industry Industry Evolution
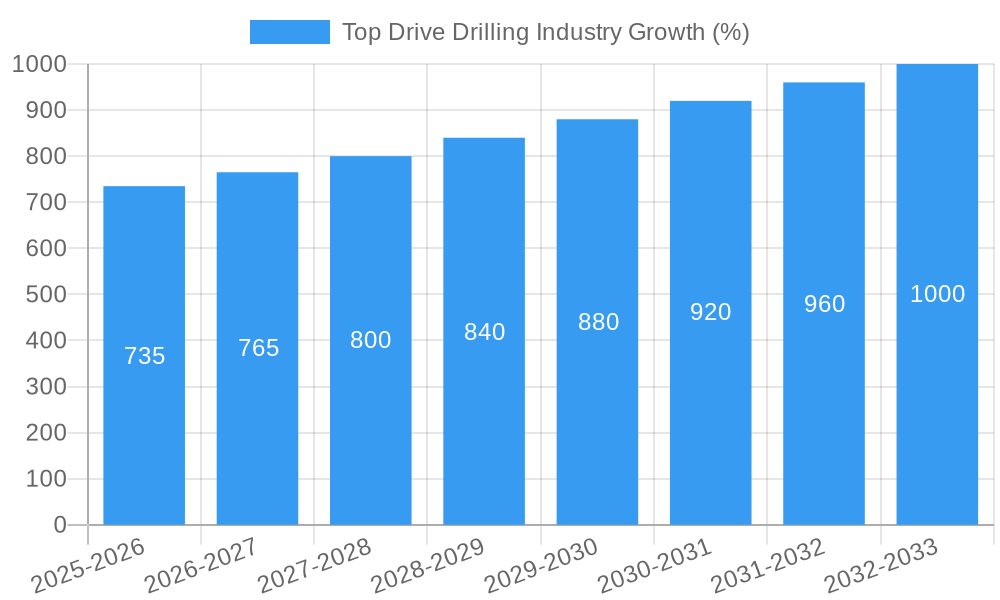
This section provides a detailed analysis of the Top Drive Drilling market's evolution, focusing on growth trajectories, technological advancements, and shifting consumer demands. The market experienced a Compound Annual Growth Rate (CAGR) of xx% during the historical period (2019-2024) and is projected to grow at a CAGR of xx% during the forecast period (2025-2033). This growth is primarily driven by increasing demand for efficient and reliable drilling solutions, coupled with technological innovations that enhance drilling speed and precision. The rising adoption of electric top drives, which offer superior energy efficiency and reduced environmental impact, is a notable trend. Furthermore, the growing need for automation and remote operation capabilities is shaping the industry's future. The shift towards offshore drilling projects also contributes significantly to market expansion. The demand for advanced features such as improved automation, remote monitoring, and real-time data analytics continues to rise, influencing product development and adoption.
Leading Regions, Countries, or Segments in Top Drive Drilling Industry
This section identifies the dominant regions, countries, and segments within the Top Drive Drilling industry, examining Type (Electric Top Drive, Hydraulic Top Drive) and Location of Deployment (Onshore, Offshore).
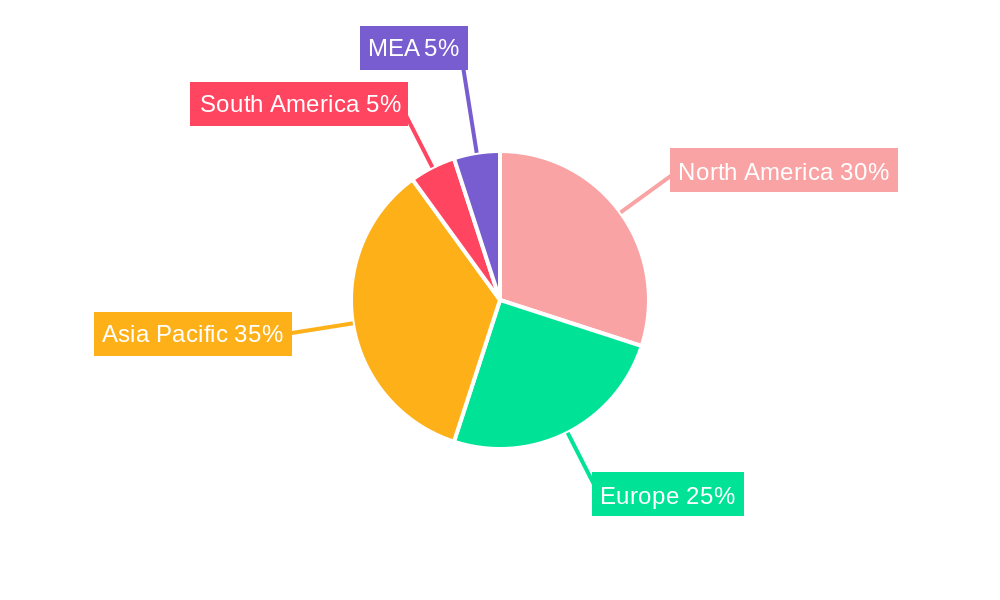
- Dominant Region: North America continues to dominate the Top Drive Drilling market, driven by extensive oil and gas exploration activities, technological advancements, and substantial investments in the sector.
- Dominant Country: The United States, owing to its significant oil and gas reserves and robust infrastructure, holds the largest market share within North America.
- Dominant Segment (Type): The Electric Top Drive segment exhibits faster growth compared to the Hydraulic Top Drive segment due to its superior energy efficiency, reduced environmental impact, and improved precision.
- Dominant Segment (Location of Deployment): The Offshore segment demonstrates substantial growth due to the increasing exploration activities in offshore oil and gas fields.
Key Drivers:
- High Investment in Oil & Gas Exploration: Significant investments in oil and gas exploration and production projects fuel demand for efficient drilling technologies.
- Government Regulations and Incentives: Supportive government policies and financial incentives for offshore projects propel market growth.
- Technological Advancements: Continuous technological innovations improve top drive efficiency, safety, and precision, leading to increased adoption.
Top Drive Drilling Industry Product Innovations
The Top Drive Drilling industry is characterized by ongoing product innovations, focusing on enhancing performance, efficiency, and safety. Recent innovations include the development of more efficient electric top drives with enhanced automation capabilities, incorporating advanced sensors and data analytics for real-time monitoring and control. These advancements improve drilling speed, reduce downtime, and minimize environmental impact. Unique selling propositions include features such as improved torque capacity, advanced control systems, and enhanced safety mechanisms.
Propelling Factors for Top Drive Drilling Industry Growth
Several factors drive the growth of the Top Drive Drilling industry. These include increasing global energy demand, rising investments in oil and gas exploration, advancements in drilling technologies leading to higher efficiency and precision, and supportive government regulations promoting exploration in both onshore and offshore locations. The continuous improvement in automation, the rise of electric top drives, and the growing demand for enhanced safety features further stimulate market expansion.
Obstacles in the Top Drive Drilling Industry Market
The Top Drive Drilling industry faces challenges such as fluctuating oil and gas prices, which impact investment decisions, and potential supply chain disruptions affecting the availability of components and raw materials. Stringent environmental regulations and safety standards necessitate significant investments in compliance measures. Furthermore, intense competition among established and emerging players creates pressure on pricing and margins.
Future Opportunities in Top Drive Drilling Industry
Future opportunities exist in emerging markets, particularly in regions with significant oil and gas reserves and developing infrastructure. The increasing adoption of digital technologies offers scope for enhanced data analytics and predictive maintenance, optimizing drilling operations and reducing costs. Furthermore, the development of sustainable and environmentally friendly drilling technologies aligns with global sustainability efforts.
Major Players in the Top Drive Drilling Industry Ecosystem
- Aker Solutions ASA
- China National Petroleum Corporation (CNPC)
- Warrior Rig Technologies Limited
- Bentec Gmbh Drilling & Oilfield Systems
- AXON EP Inc
- Herrenknecht Vertical Gmbh
- Nabors Industries Ltd
- Drillmec Inc
- National-Oilwell Varco Inc
- Schlumberger Limited
- Atlas Copco Ltd
Key Developments in Top Drive Drilling Industry Industry
- January 2022: Abu Dhabi National Oil Company (ADNOC) awarded framework agreements worth USD 1.94 billion to four top-tier companies (Adnoc Drilling, Schlumberger, Haliburton, and Weatherford) to boost drilling activities. This multi-year deal significantly impacts market dynamics by increasing demand for top drive systems.
Strategic Top Drive Drilling Industry Market Forecast
The Top Drive Drilling market is poised for robust growth, driven by increasing oil and gas exploration, technological advancements, and rising demand for efficient and sustainable drilling solutions. The market is expected to experience significant expansion in the coming years, with substantial growth anticipated in key regions and segments. The continued adoption of electric top drives and automation technologies will further fuel market expansion, shaping the future of the industry.
Top Drive Drilling Industry Segmentation
-
1. Type
- 1.1. Electric Top Drive
- 1.2. Hydraulic Top Drive
-
2. Location of Deployment
- 2.1. Onshore
- 2.2. Offshore
Top Drive Drilling Industry Segmentation By Geography
- 1. North America
- 2. Europe
- 3. Asia Pacific
- 4. South America
- 5. Middle East and Africa
Top Drive Drilling Industry REPORT HIGHLIGHTS
| Aspects | Details |
|---|---|
| Study Period | 2019-2033 |
| Base Year | 2024 |
| Estimated Year | 2025 |
| Forecast Period | 2025-2033 |
| Historical Period | 2019-2024 |
| Growth Rate | CAGR of > 4.50% from 2019-2033 |
| Segmentation |
|
Table of Contents
- 1. Introduction
- 1.1. Research Scope
- 1.2. Market Segmentation
- 1.3. Research Methodology
- 1.4. Definitions and Assumptions
- 2. Executive Summary
- 2.1. Introduction
- 3. Market Dynamics
- 3.1. Introduction
- 3.2. Market Drivers
- 3.2.1. 4.; Improved Viability Of Offshore Oil And Gas Projects
- 3.3. Market Restrains
- 3.3.1. 4.; Ban On Offshore Exploration And Production Activities In Multiple Regions
- 3.4. Market Trends
- 3.4.1. Onshore Sector to Dominate the Market
- 4. Market Factor Analysis
- 4.1. Porters Five Forces
- 4.2. Supply/Value Chain
- 4.3. PESTEL analysis
- 4.4. Market Entropy
- 4.5. Patent/Trademark Analysis
- 5. Global Top Drive Drilling Industry Analysis, Insights and Forecast, 2019-2031
- 5.1. Market Analysis, Insights and Forecast - by Type
- 5.1.1. Electric Top Drive
- 5.1.2. Hydraulic Top Drive
- 5.2. Market Analysis, Insights and Forecast - by Location of Deployment
- 5.2.1. Onshore
- 5.2.2. Offshore
- 5.3. Market Analysis, Insights and Forecast - by Region
- 5.3.1. North America
- 5.3.2. Europe
- 5.3.3. Asia Pacific
- 5.3.4. South America
- 5.3.5. Middle East and Africa
- 5.1. Market Analysis, Insights and Forecast - by Type
- 6. North America Top Drive Drilling Industry Analysis, Insights and Forecast, 2019-2031
- 6.1. Market Analysis, Insights and Forecast - by Type
- 6.1.1. Electric Top Drive
- 6.1.2. Hydraulic Top Drive
- 6.2. Market Analysis, Insights and Forecast - by Location of Deployment
- 6.2.1. Onshore
- 6.2.2. Offshore
- 6.1. Market Analysis, Insights and Forecast - by Type
- 7. Europe Top Drive Drilling Industry Analysis, Insights and Forecast, 2019-2031
- 7.1. Market Analysis, Insights and Forecast - by Type
- 7.1.1. Electric Top Drive
- 7.1.2. Hydraulic Top Drive
- 7.2. Market Analysis, Insights and Forecast - by Location of Deployment
- 7.2.1. Onshore
- 7.2.2. Offshore
- 7.1. Market Analysis, Insights and Forecast - by Type
- 8. Asia Pacific Top Drive Drilling Industry Analysis, Insights and Forecast, 2019-2031
- 8.1. Market Analysis, Insights and Forecast - by Type
- 8.1.1. Electric Top Drive
- 8.1.2. Hydraulic Top Drive
- 8.2. Market Analysis, Insights and Forecast - by Location of Deployment
- 8.2.1. Onshore
- 8.2.2. Offshore
- 8.1. Market Analysis, Insights and Forecast - by Type
- 9. South America Top Drive Drilling Industry Analysis, Insights and Forecast, 2019-2031
- 9.1. Market Analysis, Insights and Forecast - by Type
- 9.1.1. Electric Top Drive
- 9.1.2. Hydraulic Top Drive
- 9.2. Market Analysis, Insights and Forecast - by Location of Deployment
- 9.2.1. Onshore
- 9.2.2. Offshore
- 9.1. Market Analysis, Insights and Forecast - by Type
- 10. Middle East and Africa Top Drive Drilling Industry Analysis, Insights and Forecast, 2019-2031
- 10.1. Market Analysis, Insights and Forecast - by Type
- 10.1.1. Electric Top Drive
- 10.1.2. Hydraulic Top Drive
- 10.2. Market Analysis, Insights and Forecast - by Location of Deployment
- 10.2.1. Onshore
- 10.2.2. Offshore
- 10.1. Market Analysis, Insights and Forecast - by Type
- 11. North America Top Drive Drilling Industry Analysis, Insights and Forecast, 2019-2031
- 11.1. Market Analysis, Insights and Forecast - By Country/Sub-region
- 11.1.1 United States
- 11.1.2 Canada
- 11.1.3 Mexico
- 12. Europe Top Drive Drilling Industry Analysis, Insights and Forecast, 2019-2031
- 12.1. Market Analysis, Insights and Forecast - By Country/Sub-region
- 12.1.1 Germany
- 12.1.2 United Kingdom
- 12.1.3 France
- 12.1.4 Spain
- 12.1.5 Italy
- 12.1.6 Spain
- 12.1.7 Belgium
- 12.1.8 Netherland
- 12.1.9 Nordics
- 12.1.10 Rest of Europe
- 13. Asia Pacific Top Drive Drilling Industry Analysis, Insights and Forecast, 2019-2031
- 13.1. Market Analysis, Insights and Forecast - By Country/Sub-region
- 13.1.1 China
- 13.1.2 Japan
- 13.1.3 India
- 13.1.4 South Korea
- 13.1.5 Southeast Asia
- 13.1.6 Australia
- 13.1.7 Indonesia
- 13.1.8 Phillipes
- 13.1.9 Singapore
- 13.1.10 Thailandc
- 13.1.11 Rest of Asia Pacific
- 14. South America Top Drive Drilling Industry Analysis, Insights and Forecast, 2019-2031
- 14.1. Market Analysis, Insights and Forecast - By Country/Sub-region
- 14.1.1 Brazil
- 14.1.2 Argentina
- 14.1.3 Peru
- 14.1.4 Chile
- 14.1.5 Colombia
- 14.1.6 Ecuador
- 14.1.7 Venezuela
- 14.1.8 Rest of South America
- 15. North America Top Drive Drilling Industry Analysis, Insights and Forecast, 2019-2031
- 15.1. Market Analysis, Insights and Forecast - By Country/Sub-region
- 15.1.1 United States
- 15.1.2 Canada
- 15.1.3 Mexico
- 16. MEA Top Drive Drilling Industry Analysis, Insights and Forecast, 2019-2031
- 16.1. Market Analysis, Insights and Forecast - By Country/Sub-region
- 16.1.1 United Arab Emirates
- 16.1.2 Saudi Arabia
- 16.1.3 South Africa
- 16.1.4 Rest of Middle East and Africa
- 17. Competitive Analysis
- 17.1. Global Market Share Analysis 2024
- 17.2. Company Profiles
- 17.2.1 Aker Solutions ASA
- 17.2.1.1. Overview
- 17.2.1.2. Products
- 17.2.1.3. SWOT Analysis
- 17.2.1.4. Recent Developments
- 17.2.1.5. Financials (Based on Availability)
- 17.2.2 China National Petroleum Corporation (CNPC)
- 17.2.2.1. Overview
- 17.2.2.2. Products
- 17.2.2.3. SWOT Analysis
- 17.2.2.4. Recent Developments
- 17.2.2.5. Financials (Based on Availability)
- 17.2.3 Warrior Rig Technologies Limited
- 17.2.3.1. Overview
- 17.2.3.2. Products
- 17.2.3.3. SWOT Analysis
- 17.2.3.4. Recent Developments
- 17.2.3.5. Financials (Based on Availability)
- 17.2.4 Bentec Gmbh Drilling & Oilfield Systems
- 17.2.4.1. Overview
- 17.2.4.2. Products
- 17.2.4.3. SWOT Analysis
- 17.2.4.4. Recent Developments
- 17.2.4.5. Financials (Based on Availability)
- 17.2.5 AXON EP Inc
- 17.2.5.1. Overview
- 17.2.5.2. Products
- 17.2.5.3. SWOT Analysis
- 17.2.5.4. Recent Developments
- 17.2.5.5. Financials (Based on Availability)
- 17.2.6 Herrenknecht Vertical Gmbh
- 17.2.6.1. Overview
- 17.2.6.2. Products
- 17.2.6.3. SWOT Analysis
- 17.2.6.4. Recent Developments
- 17.2.6.5. Financials (Based on Availability)
- 17.2.7 Nabors Industries Ltd*List Not Exhaustive
- 17.2.7.1. Overview
- 17.2.7.2. Products
- 17.2.7.3. SWOT Analysis
- 17.2.7.4. Recent Developments
- 17.2.7.5. Financials (Based on Availability)
- 17.2.8 Drillmec Inc
- 17.2.8.1. Overview
- 17.2.8.2. Products
- 17.2.8.3. SWOT Analysis
- 17.2.8.4. Recent Developments
- 17.2.8.5. Financials (Based on Availability)
- 17.2.9 National-Oilwell Varco Inc
- 17.2.9.1. Overview
- 17.2.9.2. Products
- 17.2.9.3. SWOT Analysis
- 17.2.9.4. Recent Developments
- 17.2.9.5. Financials (Based on Availability)
- 17.2.10 Schlumberger Limited
- 17.2.10.1. Overview
- 17.2.10.2. Products
- 17.2.10.3. SWOT Analysis
- 17.2.10.4. Recent Developments
- 17.2.10.5. Financials (Based on Availability)
- 17.2.11 Atlas Copco Ltd
- 17.2.11.1. Overview
- 17.2.11.2. Products
- 17.2.11.3. SWOT Analysis
- 17.2.11.4. Recent Developments
- 17.2.11.5. Financials (Based on Availability)
- 17.2.1 Aker Solutions ASA
List of Figures
- Figure 1: Global Top Drive Drilling Industry Revenue Breakdown (Million, %) by Region 2024 & 2032
- Figure 2: North America Top Drive Drilling Industry Revenue (Million), by Country 2024 & 2032
- Figure 3: North America Top Drive Drilling Industry Revenue Share (%), by Country 2024 & 2032
- Figure 4: Europe Top Drive Drilling Industry Revenue (Million), by Country 2024 & 2032
- Figure 5: Europe Top Drive Drilling Industry Revenue Share (%), by Country 2024 & 2032
- Figure 6: Asia Pacific Top Drive Drilling Industry Revenue (Million), by Country 2024 & 2032
- Figure 7: Asia Pacific Top Drive Drilling Industry Revenue Share (%), by Country 2024 & 2032
- Figure 8: South America Top Drive Drilling Industry Revenue (Million), by Country 2024 & 2032
- Figure 9: South America Top Drive Drilling Industry Revenue Share (%), by Country 2024 & 2032
- Figure 10: North America Top Drive Drilling Industry Revenue (Million), by Country 2024 & 2032
- Figure 11: North America Top Drive Drilling Industry Revenue Share (%), by Country 2024 & 2032
- Figure 12: MEA Top Drive Drilling Industry Revenue (Million), by Country 2024 & 2032
- Figure 13: MEA Top Drive Drilling Industry Revenue Share (%), by Country 2024 & 2032
- Figure 14: North America Top Drive Drilling Industry Revenue (Million), by Type 2024 & 2032
- Figure 15: North America Top Drive Drilling Industry Revenue Share (%), by Type 2024 & 2032
- Figure 16: North America Top Drive Drilling Industry Revenue (Million), by Location of Deployment 2024 & 2032
- Figure 17: North America Top Drive Drilling Industry Revenue Share (%), by Location of Deployment 2024 & 2032
- Figure 18: North America Top Drive Drilling Industry Revenue (Million), by Country 2024 & 2032
- Figure 19: North America Top Drive Drilling Industry Revenue Share (%), by Country 2024 & 2032
- Figure 20: Europe Top Drive Drilling Industry Revenue (Million), by Type 2024 & 2032
- Figure 21: Europe Top Drive Drilling Industry Revenue Share (%), by Type 2024 & 2032
- Figure 22: Europe Top Drive Drilling Industry Revenue (Million), by Location of Deployment 2024 & 2032
- Figure 23: Europe Top Drive Drilling Industry Revenue Share (%), by Location of Deployment 2024 & 2032
- Figure 24: Europe Top Drive Drilling Industry Revenue (Million), by Country 2024 & 2032
- Figure 25: Europe Top Drive Drilling Industry Revenue Share (%), by Country 2024 & 2032
- Figure 26: Asia Pacific Top Drive Drilling Industry Revenue (Million), by Type 2024 & 2032
- Figure 27: Asia Pacific Top Drive Drilling Industry Revenue Share (%), by Type 2024 & 2032
- Figure 28: Asia Pacific Top Drive Drilling Industry Revenue (Million), by Location of Deployment 2024 & 2032
- Figure 29: Asia Pacific Top Drive Drilling Industry Revenue Share (%), by Location of Deployment 2024 & 2032
- Figure 30: Asia Pacific Top Drive Drilling Industry Revenue (Million), by Country 2024 & 2032
- Figure 31: Asia Pacific Top Drive Drilling Industry Revenue Share (%), by Country 2024 & 2032
- Figure 32: South America Top Drive Drilling Industry Revenue (Million), by Type 2024 & 2032
- Figure 33: South America Top Drive Drilling Industry Revenue Share (%), by Type 2024 & 2032
- Figure 34: South America Top Drive Drilling Industry Revenue (Million), by Location of Deployment 2024 & 2032
- Figure 35: South America Top Drive Drilling Industry Revenue Share (%), by Location of Deployment 2024 & 2032
- Figure 36: South America Top Drive Drilling Industry Revenue (Million), by Country 2024 & 2032
- Figure 37: South America Top Drive Drilling Industry Revenue Share (%), by Country 2024 & 2032
- Figure 38: Middle East and Africa Top Drive Drilling Industry Revenue (Million), by Type 2024 & 2032
- Figure 39: Middle East and Africa Top Drive Drilling Industry Revenue Share (%), by Type 2024 & 2032
- Figure 40: Middle East and Africa Top Drive Drilling Industry Revenue (Million), by Location of Deployment 2024 & 2032
- Figure 41: Middle East and Africa Top Drive Drilling Industry Revenue Share (%), by Location of Deployment 2024 & 2032
- Figure 42: Middle East and Africa Top Drive Drilling Industry Revenue (Million), by Country 2024 & 2032
- Figure 43: Middle East and Africa Top Drive Drilling Industry Revenue Share (%), by Country 2024 & 2032
List of Tables
- Table 1: Global Top Drive Drilling Industry Revenue Million Forecast, by Region 2019 & 2032
- Table 2: Global Top Drive Drilling Industry Revenue Million Forecast, by Type 2019 & 2032
- Table 3: Global Top Drive Drilling Industry Revenue Million Forecast, by Location of Deployment 2019 & 2032
- Table 4: Global Top Drive Drilling Industry Revenue Million Forecast, by Region 2019 & 2032
- Table 5: Global Top Drive Drilling Industry Revenue Million Forecast, by Country 2019 & 2032
- Table 6: United States Top Drive Drilling Industry Revenue (Million) Forecast, by Application 2019 & 2032
- Table 7: Canada Top Drive Drilling Industry Revenue (Million) Forecast, by Application 2019 & 2032
- Table 8: Mexico Top Drive Drilling Industry Revenue (Million) Forecast, by Application 2019 & 2032
- Table 9: Global Top Drive Drilling Industry Revenue Million Forecast, by Country 2019 & 2032
- Table 10: Germany Top Drive Drilling Industry Revenue (Million) Forecast, by Application 2019 & 2032
- Table 11: United Kingdom Top Drive Drilling Industry Revenue (Million) Forecast, by Application 2019 & 2032
- Table 12: France Top Drive Drilling Industry Revenue (Million) Forecast, by Application 2019 & 2032
- Table 13: Spain Top Drive Drilling Industry Revenue (Million) Forecast, by Application 2019 & 2032
- Table 14: Italy Top Drive Drilling Industry Revenue (Million) Forecast, by Application 2019 & 2032
- Table 15: Spain Top Drive Drilling Industry Revenue (Million) Forecast, by Application 2019 & 2032
- Table 16: Belgium Top Drive Drilling Industry Revenue (Million) Forecast, by Application 2019 & 2032
- Table 17: Netherland Top Drive Drilling Industry Revenue (Million) Forecast, by Application 2019 & 2032
- Table 18: Nordics Top Drive Drilling Industry Revenue (Million) Forecast, by Application 2019 & 2032
- Table 19: Rest of Europe Top Drive Drilling Industry Revenue (Million) Forecast, by Application 2019 & 2032
- Table 20: Global Top Drive Drilling Industry Revenue Million Forecast, by Country 2019 & 2032
- Table 21: China Top Drive Drilling Industry Revenue (Million) Forecast, by Application 2019 & 2032
- Table 22: Japan Top Drive Drilling Industry Revenue (Million) Forecast, by Application 2019 & 2032
- Table 23: India Top Drive Drilling Industry Revenue (Million) Forecast, by Application 2019 & 2032
- Table 24: South Korea Top Drive Drilling Industry Revenue (Million) Forecast, by Application 2019 & 2032
- Table 25: Southeast Asia Top Drive Drilling Industry Revenue (Million) Forecast, by Application 2019 & 2032
- Table 26: Australia Top Drive Drilling Industry Revenue (Million) Forecast, by Application 2019 & 2032
- Table 27: Indonesia Top Drive Drilling Industry Revenue (Million) Forecast, by Application 2019 & 2032
- Table 28: Phillipes Top Drive Drilling Industry Revenue (Million) Forecast, by Application 2019 & 2032
- Table 29: Singapore Top Drive Drilling Industry Revenue (Million) Forecast, by Application 2019 & 2032
- Table 30: Thailandc Top Drive Drilling Industry Revenue (Million) Forecast, by Application 2019 & 2032
- Table 31: Rest of Asia Pacific Top Drive Drilling Industry Revenue (Million) Forecast, by Application 2019 & 2032
- Table 32: Global Top Drive Drilling Industry Revenue Million Forecast, by Country 2019 & 2032
- Table 33: Brazil Top Drive Drilling Industry Revenue (Million) Forecast, by Application 2019 & 2032
- Table 34: Argentina Top Drive Drilling Industry Revenue (Million) Forecast, by Application 2019 & 2032
- Table 35: Peru Top Drive Drilling Industry Revenue (Million) Forecast, by Application 2019 & 2032
- Table 36: Chile Top Drive Drilling Industry Revenue (Million) Forecast, by Application 2019 & 2032
- Table 37: Colombia Top Drive Drilling Industry Revenue (Million) Forecast, by Application 2019 & 2032
- Table 38: Ecuador Top Drive Drilling Industry Revenue (Million) Forecast, by Application 2019 & 2032
- Table 39: Venezuela Top Drive Drilling Industry Revenue (Million) Forecast, by Application 2019 & 2032
- Table 40: Rest of South America Top Drive Drilling Industry Revenue (Million) Forecast, by Application 2019 & 2032
- Table 41: Global Top Drive Drilling Industry Revenue Million Forecast, by Country 2019 & 2032
- Table 42: United States Top Drive Drilling Industry Revenue (Million) Forecast, by Application 2019 & 2032
- Table 43: Canada Top Drive Drilling Industry Revenue (Million) Forecast, by Application 2019 & 2032
- Table 44: Mexico Top Drive Drilling Industry Revenue (Million) Forecast, by Application 2019 & 2032
- Table 45: Global Top Drive Drilling Industry Revenue Million Forecast, by Country 2019 & 2032
- Table 46: United Arab Emirates Top Drive Drilling Industry Revenue (Million) Forecast, by Application 2019 & 2032
- Table 47: Saudi Arabia Top Drive Drilling Industry Revenue (Million) Forecast, by Application 2019 & 2032
- Table 48: South Africa Top Drive Drilling Industry Revenue (Million) Forecast, by Application 2019 & 2032
- Table 49: Rest of Middle East and Africa Top Drive Drilling Industry Revenue (Million) Forecast, by Application 2019 & 2032
- Table 50: Global Top Drive Drilling Industry Revenue Million Forecast, by Type 2019 & 2032
- Table 51: Global Top Drive Drilling Industry Revenue Million Forecast, by Location of Deployment 2019 & 2032
- Table 52: Global Top Drive Drilling Industry Revenue Million Forecast, by Country 2019 & 2032
- Table 53: Global Top Drive Drilling Industry Revenue Million Forecast, by Type 2019 & 2032
- Table 54: Global Top Drive Drilling Industry Revenue Million Forecast, by Location of Deployment 2019 & 2032
- Table 55: Global Top Drive Drilling Industry Revenue Million Forecast, by Country 2019 & 2032
- Table 56: Global Top Drive Drilling Industry Revenue Million Forecast, by Type 2019 & 2032
- Table 57: Global Top Drive Drilling Industry Revenue Million Forecast, by Location of Deployment 2019 & 2032
- Table 58: Global Top Drive Drilling Industry Revenue Million Forecast, by Country 2019 & 2032
- Table 59: Global Top Drive Drilling Industry Revenue Million Forecast, by Type 2019 & 2032
- Table 60: Global Top Drive Drilling Industry Revenue Million Forecast, by Location of Deployment 2019 & 2032
- Table 61: Global Top Drive Drilling Industry Revenue Million Forecast, by Country 2019 & 2032
- Table 62: Global Top Drive Drilling Industry Revenue Million Forecast, by Type 2019 & 2032
- Table 63: Global Top Drive Drilling Industry Revenue Million Forecast, by Location of Deployment 2019 & 2032
- Table 64: Global Top Drive Drilling Industry Revenue Million Forecast, by Country 2019 & 2032
Frequently Asked Questions
1. What is the projected Compound Annual Growth Rate (CAGR) of the Top Drive Drilling Industry?
The projected CAGR is approximately > 4.50%.
2. Which companies are prominent players in the Top Drive Drilling Industry?
Key companies in the market include Aker Solutions ASA, China National Petroleum Corporation (CNPC), Warrior Rig Technologies Limited, Bentec Gmbh Drilling & Oilfield Systems, AXON EP Inc, Herrenknecht Vertical Gmbh, Nabors Industries Ltd*List Not Exhaustive, Drillmec Inc, National-Oilwell Varco Inc, Schlumberger Limited, Atlas Copco Ltd.
3. What are the main segments of the Top Drive Drilling Industry?
The market segments include Type, Location of Deployment.
4. Can you provide details about the market size?
The market size is estimated to be USD XX Million as of 2022.
5. What are some drivers contributing to market growth?
4.; Improved Viability Of Offshore Oil And Gas Projects.
6. What are the notable trends driving market growth?
Onshore Sector to Dominate the Market.
7. Are there any restraints impacting market growth?
4.; Ban On Offshore Exploration And Production Activities In Multiple Regions.
8. Can you provide examples of recent developments in the market?
In January 2022, Abu Dhabi National Oil Company (ADNOC) awarded framework agreements worth USD 1.94 billion to four top-tier companies aiming to boost drilling activities. The contracts were awarded to Adnoc Drilling (a subsidiary of ADNOC), Schlumberger, Haliburton, and Weatherford. The framework agreement awards are likely to cover ADNOC's onshore and offshore fields and run for five years, with an option for a further two years. The deal builds on ADNOC's recent record investments in drilling-related equipment and services. It is also expected to support its strategy to boost crude oil production capacity to 5 mmbpd by 2030 and, thus, help the growth of the top drive systems market.
9. What pricing options are available for accessing the report?
Pricing options include single-user, multi-user, and enterprise licenses priced at USD 4750, USD 5250, and USD 8750 respectively.
10. Is the market size provided in terms of value or volume?
The market size is provided in terms of value, measured in Million.
11. Are there any specific market keywords associated with the report?
Yes, the market keyword associated with the report is "Top Drive Drilling Industry," which aids in identifying and referencing the specific market segment covered.
12. How do I determine which pricing option suits my needs best?
The pricing options vary based on user requirements and access needs. Individual users may opt for single-user licenses, while businesses requiring broader access may choose multi-user or enterprise licenses for cost-effective access to the report.
13. Are there any additional resources or data provided in the Top Drive Drilling Industry report?
While the report offers comprehensive insights, it's advisable to review the specific contents or supplementary materials provided to ascertain if additional resources or data are available.
14. How can I stay updated on further developments or reports in the Top Drive Drilling Industry?
To stay informed about further developments, trends, and reports in the Top Drive Drilling Industry, consider subscribing to industry newsletters, following relevant companies and organizations, or regularly checking reputable industry news sources and publications.
Methodology
Step 1 - Identification of Relevant Samples Size from Population Database


Step 2 - Approaches for Defining Global Market Size (Value, Volume* & Price*)

Note*: In applicable scenarios
Step 3 - Data Sources
Primary Research
- Web Analytics
- Survey Reports
- Research Institute
- Latest Research Reports
- Opinion Leaders
Secondary Research
- Annual Reports
- White Paper
- Latest Press Release
- Industry Association
- Paid Database
- Investor Presentations

Step 4 - Data Triangulation
Involves using different sources of information in order to increase the validity of a study
These sources are likely to be stakeholders in a program - participants, other researchers, program staff, other community members, and so on.
Then we put all data in single framework & apply various statistical tools to find out the dynamic on the market.
During the analysis stage, feedback from the stakeholder groups would be compared to determine areas of agreement as well as areas of divergence
