

Key Insights
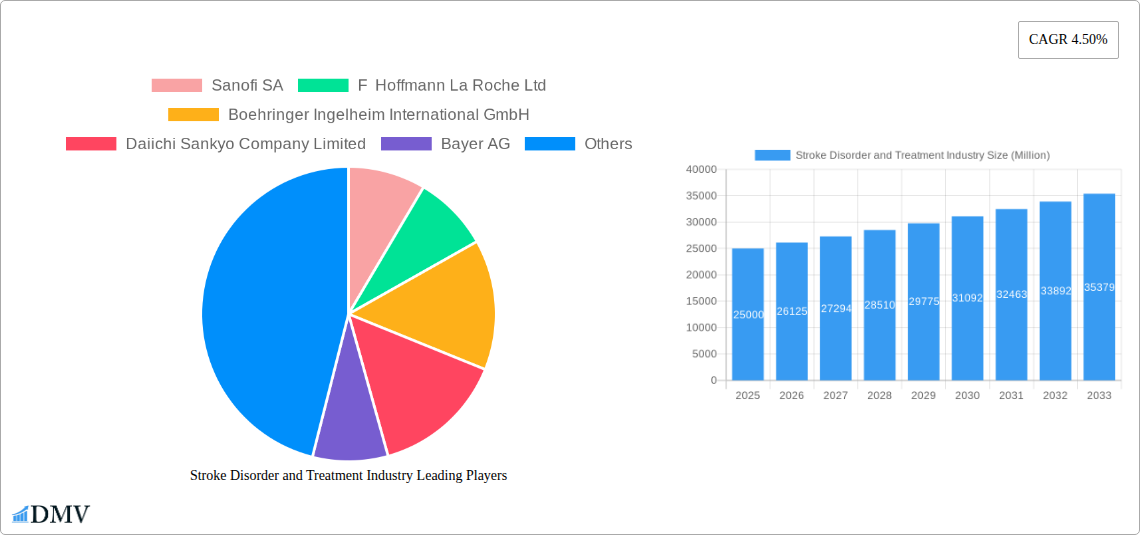
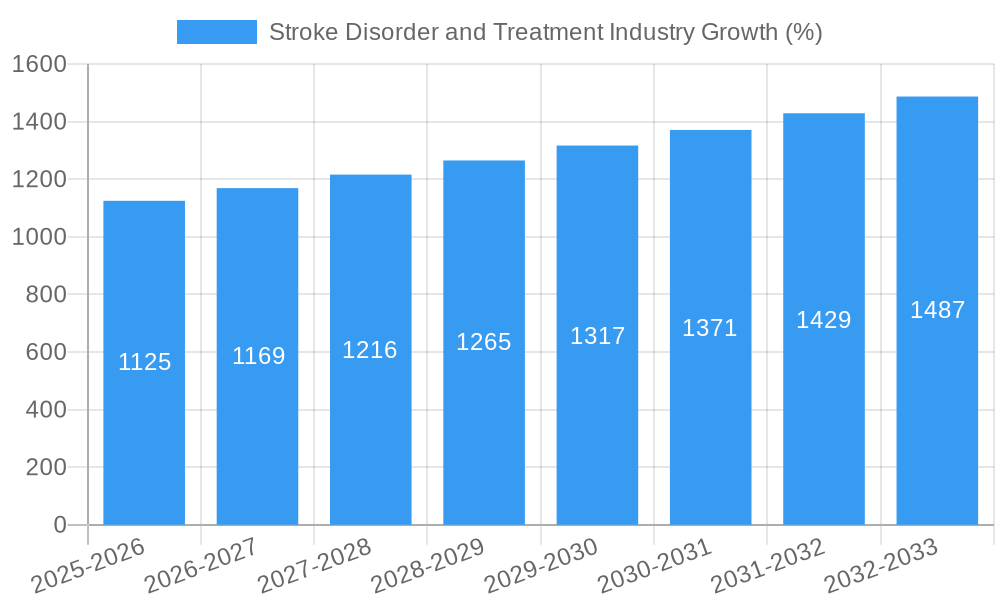
The global stroke disorder and treatment market is a substantial and rapidly evolving sector, exhibiting a Compound Annual Growth Rate (CAGR) of 4.50% from 2019 to 2033. This growth is fueled by several key drivers. The rising prevalence of stroke globally, primarily due to aging populations and increasing risk factors like hypertension, diabetes, and smoking, significantly contributes to market expansion. Advancements in stroke treatment, including the development of more effective thrombolytics like Tissue Plasminogen Activators (tPA) and improved anticoagulants and antiplatelets, are also driving market growth. Furthermore, increased healthcare expenditure and improved healthcare infrastructure in developing economies are creating new opportunities for market expansion. The segment comprising ischemic strokes holds the largest market share, reflecting the higher prevalence of this type of stroke. Hospitals remain the dominant end-user segment, owing to the complex nature of stroke treatment and rehabilitation. Competitive landscape analysis reveals key players such as Sanofi SA, Roche, Boehringer Ingelheim, and others actively engaged in research and development, expanding their product portfolios, and engaging in strategic partnerships to maintain their market position.
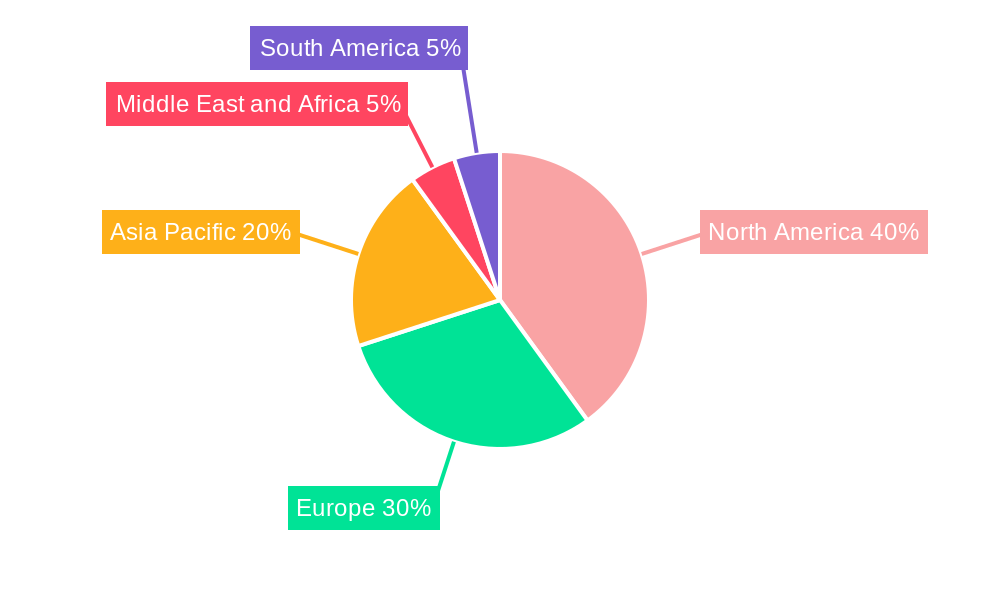
Despite the positive growth trajectory, the market faces certain restraints. High treatment costs, particularly for advanced therapies, can limit access to care, especially in low- and middle-income countries. The potential for adverse effects associated with some treatments, as well as variations in treatment protocols across different regions, present challenges to consistent market growth. Nevertheless, the ongoing research into novel therapeutics and preventive measures, along with increasing awareness campaigns aimed at reducing stroke risk factors, are anticipated to mitigate these challenges and contribute to sustained market growth over the forecast period. The market's regional distribution is expected to see substantial growth in Asia-Pacific, driven by increasing prevalence and expanding healthcare infrastructure, while North America and Europe will maintain significant market shares due to established healthcare systems and high rates of stroke incidence.
Stroke Disorder and Treatment Industry: A Comprehensive Market Report (2019-2033)
This insightful report provides a detailed analysis of the global Stroke Disorder and Treatment industry, offering a comprehensive overview of market dynamics, key players, and future growth projections. Covering the period from 2019 to 2033, with a focus on 2025, this report is essential for stakeholders seeking to understand and capitalize on opportunities within this rapidly evolving sector. The global market size is estimated to reach xx Million by 2025 and is projected to grow at a CAGR of xx% during the forecast period (2025-2033).
Stroke Disorder and Treatment Industry Market Composition & Trends
This section delves into the intricate composition of the stroke disorder and treatment market, examining its competitive landscape, innovation drivers, and regulatory environment. The market is characterized by a moderate level of concentration, with key players like Sanofi SA, F. Hoffmann-La Roche Ltd, and Boehringer Ingelheim International GmbH holding significant market share. However, the presence of numerous smaller, specialized companies indicates a dynamic and competitive environment.
- Market Share Distribution (2025): Sanofi SA (xx%), F. Hoffmann-La Roche Ltd (xx%), Boehringer Ingelheim International GmbH (xx%), Others (xx%). The exact figures are subject to ongoing market analysis.
- Innovation Catalysts: Ongoing research into novel therapeutic targets, advancements in diagnostic imaging, and the development of personalized medicine are key drivers of innovation.
- Regulatory Landscape: Stringent regulatory approvals and post-market surveillance play a crucial role in shaping market access and product lifecycle management. Variations in regulatory pathways across different geographies contribute to market complexities.
- Substitute Products: While limited, alternative treatment strategies and management approaches can influence market dynamics.
- End-User Profile: Hospitals and specialized clinics account for the majority of end-users. However, growth in home-based care may alter this distribution.
- M&A Activities: The last five years have witnessed xx Million in M&A deals, reflecting consolidation trends and strategic partnerships within the industry.
Stroke Disorder and Treatment Industry Industry Evolution
The stroke disorder and treatment industry has witnessed significant evolution over the past decade, driven by advancements in medical technology and a growing understanding of stroke pathophysiology. Market growth trajectories have been positively impacted by increasing prevalence of stroke globally, coupled with rising healthcare expenditure. The adoption of novel therapeutic agents, such as newer anticoagulants and antiplatelets, has led to improved patient outcomes.
Technological advancements, particularly in neuroimaging and minimally invasive therapies, have played a significant role in shaping treatment paradigms. Technological enhancements have contributed to more precise diagnosis and treatment, alongside improved patient monitoring and rehabilitation approaches. Patient preferences and expectations are also shifting, with a growing demand for less invasive procedures and improved quality of life after stroke.
The historical period (2019-2024) experienced a CAGR of xx%, while the forecast period (2025-2033) projects a CAGR of xx%. This growth is attributed to factors such as increasing prevalence of stroke, technological advancements in treatment modalities, and rising healthcare spending. The adoption rate of newer stroke treatments increased from xx% in 2019 to xx% in 2024, and is projected to reach xx% by 2033.
Leading Regions, Countries, or Segments in Stroke Disorder and Treatment Industry
North America currently holds the largest market share due to high healthcare expenditure, advanced healthcare infrastructure, and a higher prevalence of stroke. However, rapidly developing economies in Asia-Pacific are exhibiting significant growth potential.
Dominant Segments:
- Type: Ischemic stroke represents the largest segment due to its higher prevalence.
- Treatment: Tissue Plasminogen Activators (TPA) maintain a significant market share, although anticoagulants and antiplatelets are rapidly gaining traction.
- End User: Hospitals are the primary end-users, accounting for xx% of the market.
Key Drivers:
- North America: High healthcare expenditure, robust research & development activities, and advanced healthcare infrastructure drive market growth.
- Europe: Increasing prevalence of stroke and government initiatives supporting healthcare investments contribute to substantial market growth.
- Asia-Pacific: Rapidly growing population, rising healthcare expenditure, and increasing awareness of stroke are key drivers.
Stroke Disorder and Treatment Industry Product Innovations
Recent years have witnessed significant advancements in stroke treatment, including the development of novel thrombolytic agents, improved antiplatelet therapies, and advanced neuroprotective strategies. These innovations offer enhanced efficacy, reduced side effects, and improved patient outcomes. The integration of AI-powered diagnostic tools and personalized medicine approaches further enhance treatment precision and efficiency. Unique selling propositions often center around improved efficacy, safety profiles, and reduced treatment burden. Technological advancements in drug delivery systems and imaging techniques are constantly expanding treatment options.
Propelling Factors for Stroke Disorder and Treatment Industry Growth
Several factors are driving the growth of the stroke disorder and treatment industry. The increasing prevalence of stroke globally due to aging populations and modifiable risk factors like hypertension and diabetes is a major contributor. Technological advancements, such as improved imaging techniques and minimally invasive procedures, enhance diagnosis and treatment effectiveness. Furthermore, increasing healthcare expenditure and favorable regulatory environments are accelerating market growth.
Obstacles in the Stroke Disorder and Treatment Industry Market
Despite promising advancements, the stroke disorder and treatment industry faces challenges. Stringent regulatory approval processes for new therapies can delay market entry. Supply chain disruptions and fluctuating raw material costs can impact production and profitability. Moreover, intense competition among established players and the entry of new players create considerable competitive pressure, limiting the profitability of individual companies. These factors may result in a xx% reduction in market growth within the next five years, if not effectively managed.
Future Opportunities in Stroke Disorder and Treatment Industry
Emerging opportunities in the stroke disorder and treatment industry include the development of novel neuroprotective agents, the exploration of stem cell therapies, and the advancement of telemedicine for stroke management. The rising prevalence of stroke in developing economies presents significant market expansion potential. Furthermore, the integration of AI and machine learning in diagnosis and treatment offers exciting possibilities for improved patient outcomes.
Major Players in the Stroke Disorder and Treatment Industry Ecosystem
- Sanofi SA
- F. Hoffmann-La Roche Ltd
- Boehringer Ingelheim International GmbH
- Daiichi Sankyo Company Limited
- Bayer AG
- Amgen Inc
- Johnson & Johnson
- Merck and Co Inc
- Biogen Inc
- Bristol-Myers Squibb Company
- Pfizer Inc
Key Developments in Stroke Disorder and Treatment Industry Industry
- 2022-Q4: Launch of a new anticoagulant by Company X.
- 2023-Q2: Acquisition of Company Y by Company Z for xx Million.
- 2024-Q1: FDA approval of a novel neuroprotective agent.
- (Further developments to be added based on updated data)
Strategic Stroke Disorder and Treatment Industry Market Forecast
The stroke disorder and treatment industry is poised for significant growth over the next decade, driven by persistent unmet medical needs, technological advancements, and favorable regulatory environments. Continued innovation in therapeutic agents, diagnostic tools, and rehabilitation strategies will propel market expansion. Focus on personalized medicine and digital health solutions will create opportunities for personalized and efficient stroke care. The market's future trajectory will be influenced by the success of emerging therapies and the continued adoption of existing treatments. The potential for substantial growth in developing markets further enhances long-term market prospects.
Stroke Disorder and Treatment Industry Segmentation
-
1. Type
- 1.1. Ischemic Stroke
- 1.2. Hemorrhagic Stroke
-
2. Treatment
- 2.1. Tissue Plasminogen Activators (TPA)
- 2.2. Anticoagulants
- 2.3. Antiplatelets
- 2.4. Others
-
3. End User
- 3.1. Hospitals
- 3.2. Clinics
- 3.3. Others
Stroke Disorder and Treatment Industry Segmentation By Geography
-
1. North America
- 1.1. United States
- 1.2. Canada
- 1.3. Mexico
-
2. Europe
- 2.1. Germany
- 2.2. United Kingdom
- 2.3. France
- 2.4. Italy
- 2.5. Spain
- 2.6. Rest of Europe
-
3. Asia Pacific
- 3.1. China
- 3.2. Japan
- 3.3. India
- 3.4. Australia
- 3.5. South Korea
- 3.6. Rest of Asia Pacific
-
4. Middle East and Africa
- 4.1. GCC
- 4.2. South Africa
- 4.3. Rest of Middle East and Africa
-
5. South America
- 5.1. Brazil
- 5.2. Argentina
- 5.3. Rest of South America
Stroke Disorder and Treatment Industry REPORT HIGHLIGHTS
| Aspects | Details |
|---|---|
| Study Period | 2019-2033 |
| Base Year | 2024 |
| Estimated Year | 2025 |
| Forecast Period | 2025-2033 |
| Historical Period | 2019-2024 |
| Growth Rate | CAGR of 4.50% from 2019-2033 |
| Segmentation |
|
Table of Contents
- 1. Introduction
- 1.1. Research Scope
- 1.2. Market Segmentation
- 1.3. Research Methodology
- 1.4. Definitions and Assumptions
- 2. Executive Summary
- 2.1. Introduction
- 3. Market Dynamics
- 3.1. Introduction
- 3.2. Market Drivers
- 3.2.1. Investment by Market Players for the Development of New Therapy and Advanced Technology; Increasing Number of Stroke Patients
- 3.3. Market Restrains
- 3.3.1. Entry of Various Generic Drugs
- 3.4. Market Trends
- 3.4.1. Tissue Plasminogen Activators (TPA) Dominated in the Market and is Expected to Hold Dominance during the Forecast Period
- 4. Market Factor Analysis
- 4.1. Porters Five Forces
- 4.2. Supply/Value Chain
- 4.3. PESTEL analysis
- 4.4. Market Entropy
- 4.5. Patent/Trademark Analysis
- 5. Global Stroke Disorder and Treatment Industry Analysis, Insights and Forecast, 2019-2031
- 5.1. Market Analysis, Insights and Forecast - by Type
- 5.1.1. Ischemic Stroke
- 5.1.2. Hemorrhagic Stroke
- 5.2. Market Analysis, Insights and Forecast - by Treatment
- 5.2.1. Tissue Plasminogen Activators (TPA)
- 5.2.2. Anticoagulants
- 5.2.3. Antiplatelets
- 5.2.4. Others
- 5.3. Market Analysis, Insights and Forecast - by End User
- 5.3.1. Hospitals
- 5.3.2. Clinics
- 5.3.3. Others
- 5.4. Market Analysis, Insights and Forecast - by Region
- 5.4.1. North America
- 5.4.2. Europe
- 5.4.3. Asia Pacific
- 5.4.4. Middle East and Africa
- 5.4.5. South America
- 5.1. Market Analysis, Insights and Forecast - by Type
- 6. North America Stroke Disorder and Treatment Industry Analysis, Insights and Forecast, 2019-2031
- 6.1. Market Analysis, Insights and Forecast - by Type
- 6.1.1. Ischemic Stroke
- 6.1.2. Hemorrhagic Stroke
- 6.2. Market Analysis, Insights and Forecast - by Treatment
- 6.2.1. Tissue Plasminogen Activators (TPA)
- 6.2.2. Anticoagulants
- 6.2.3. Antiplatelets
- 6.2.4. Others
- 6.3. Market Analysis, Insights and Forecast - by End User
- 6.3.1. Hospitals
- 6.3.2. Clinics
- 6.3.3. Others
- 6.1. Market Analysis, Insights and Forecast - by Type
- 7. Europe Stroke Disorder and Treatment Industry Analysis, Insights and Forecast, 2019-2031
- 7.1. Market Analysis, Insights and Forecast - by Type
- 7.1.1. Ischemic Stroke
- 7.1.2. Hemorrhagic Stroke
- 7.2. Market Analysis, Insights and Forecast - by Treatment
- 7.2.1. Tissue Plasminogen Activators (TPA)
- 7.2.2. Anticoagulants
- 7.2.3. Antiplatelets
- 7.2.4. Others
- 7.3. Market Analysis, Insights and Forecast - by End User
- 7.3.1. Hospitals
- 7.3.2. Clinics
- 7.3.3. Others
- 7.1. Market Analysis, Insights and Forecast - by Type
- 8. Asia Pacific Stroke Disorder and Treatment Industry Analysis, Insights and Forecast, 2019-2031
- 8.1. Market Analysis, Insights and Forecast - by Type
- 8.1.1. Ischemic Stroke
- 8.1.2. Hemorrhagic Stroke
- 8.2. Market Analysis, Insights and Forecast - by Treatment
- 8.2.1. Tissue Plasminogen Activators (TPA)
- 8.2.2. Anticoagulants
- 8.2.3. Antiplatelets
- 8.2.4. Others
- 8.3. Market Analysis, Insights and Forecast - by End User
- 8.3.1. Hospitals
- 8.3.2. Clinics
- 8.3.3. Others
- 8.1. Market Analysis, Insights and Forecast - by Type
- 9. Middle East and Africa Stroke Disorder and Treatment Industry Analysis, Insights and Forecast, 2019-2031
- 9.1. Market Analysis, Insights and Forecast - by Type
- 9.1.1. Ischemic Stroke
- 9.1.2. Hemorrhagic Stroke
- 9.2. Market Analysis, Insights and Forecast - by Treatment
- 9.2.1. Tissue Plasminogen Activators (TPA)
- 9.2.2. Anticoagulants
- 9.2.3. Antiplatelets
- 9.2.4. Others
- 9.3. Market Analysis, Insights and Forecast - by End User
- 9.3.1. Hospitals
- 9.3.2. Clinics
- 9.3.3. Others
- 9.1. Market Analysis, Insights and Forecast - by Type
- 10. South America Stroke Disorder and Treatment Industry Analysis, Insights and Forecast, 2019-2031
- 10.1. Market Analysis, Insights and Forecast - by Type
- 10.1.1. Ischemic Stroke
- 10.1.2. Hemorrhagic Stroke
- 10.2. Market Analysis, Insights and Forecast - by Treatment
- 10.2.1. Tissue Plasminogen Activators (TPA)
- 10.2.2. Anticoagulants
- 10.2.3. Antiplatelets
- 10.2.4. Others
- 10.3. Market Analysis, Insights and Forecast - by End User
- 10.3.1. Hospitals
- 10.3.2. Clinics
- 10.3.3. Others
- 10.1. Market Analysis, Insights and Forecast - by Type
- 11. North America Stroke Disorder and Treatment Industry Analysis, Insights and Forecast, 2019-2031
- 11.1. Market Analysis, Insights and Forecast - By Country/Sub-region
- 11.1.1 United States
- 11.1.2 Canada
- 11.1.3 Mexico
- 12. Europe Stroke Disorder and Treatment Industry Analysis, Insights and Forecast, 2019-2031
- 12.1. Market Analysis, Insights and Forecast - By Country/Sub-region
- 12.1.1 Germany
- 12.1.2 United Kingdom
- 12.1.3 France
- 12.1.4 Italy
- 12.1.5 Spain
- 12.1.6 Rest of Europe
- 13. Asia Pacific Stroke Disorder and Treatment Industry Analysis, Insights and Forecast, 2019-2031
- 13.1. Market Analysis, Insights and Forecast - By Country/Sub-region
- 13.1.1 China
- 13.1.2 Japan
- 13.1.3 India
- 13.1.4 Australia
- 13.1.5 South Korea
- 13.1.6 Rest of Asia Pacific
- 14. Middle East and Africa Stroke Disorder and Treatment Industry Analysis, Insights and Forecast, 2019-2031
- 14.1. Market Analysis, Insights and Forecast - By Country/Sub-region
- 14.1.1 GCC
- 14.1.2 South Africa
- 14.1.3 Rest of Middle East and Africa
- 15. South America Stroke Disorder and Treatment Industry Analysis, Insights and Forecast, 2019-2031
- 15.1. Market Analysis, Insights and Forecast - By Country/Sub-region
- 15.1.1 Brazil
- 15.1.2 Argentina
- 15.1.3 Rest of South America
- 16. Competitive Analysis
- 16.1. Global Market Share Analysis 2024
- 16.2. Company Profiles
- 16.2.1 Sanofi SA
- 16.2.1.1. Overview
- 16.2.1.2. Products
- 16.2.1.3. SWOT Analysis
- 16.2.1.4. Recent Developments
- 16.2.1.5. Financials (Based on Availability)
- 16.2.2 F Hoffmann La Roche Ltd
- 16.2.2.1. Overview
- 16.2.2.2. Products
- 16.2.2.3. SWOT Analysis
- 16.2.2.4. Recent Developments
- 16.2.2.5. Financials (Based on Availability)
- 16.2.3 Boehringer Ingelheim International GmbH
- 16.2.3.1. Overview
- 16.2.3.2. Products
- 16.2.3.3. SWOT Analysis
- 16.2.3.4. Recent Developments
- 16.2.3.5. Financials (Based on Availability)
- 16.2.4 Daiichi Sankyo Company Limited
- 16.2.4.1. Overview
- 16.2.4.2. Products
- 16.2.4.3. SWOT Analysis
- 16.2.4.4. Recent Developments
- 16.2.4.5. Financials (Based on Availability)
- 16.2.5 Bayer AG
- 16.2.5.1. Overview
- 16.2.5.2. Products
- 16.2.5.3. SWOT Analysis
- 16.2.5.4. Recent Developments
- 16.2.5.5. Financials (Based on Availability)
- 16.2.6 Amgen Inc
- 16.2.6.1. Overview
- 16.2.6.2. Products
- 16.2.6.3. SWOT Analysis
- 16.2.6.4. Recent Developments
- 16.2.6.5. Financials (Based on Availability)
- 16.2.7 Johnson & Johnson
- 16.2.7.1. Overview
- 16.2.7.2. Products
- 16.2.7.3. SWOT Analysis
- 16.2.7.4. Recent Developments
- 16.2.7.5. Financials (Based on Availability)
- 16.2.8 Merck and Co Inc
- 16.2.8.1. Overview
- 16.2.8.2. Products
- 16.2.8.3. SWOT Analysis
- 16.2.8.4. Recent Developments
- 16.2.8.5. Financials (Based on Availability)
- 16.2.9 Biogen Inc
- 16.2.9.1. Overview
- 16.2.9.2. Products
- 16.2.9.3. SWOT Analysis
- 16.2.9.4. Recent Developments
- 16.2.9.5. Financials (Based on Availability)
- 16.2.10 Bristol-Myers Squibb Company
- 16.2.10.1. Overview
- 16.2.10.2. Products
- 16.2.10.3. SWOT Analysis
- 16.2.10.4. Recent Developments
- 16.2.10.5. Financials (Based on Availability)
- 16.2.11 Pfizer Inc
- 16.2.11.1. Overview
- 16.2.11.2. Products
- 16.2.11.3. SWOT Analysis
- 16.2.11.4. Recent Developments
- 16.2.11.5. Financials (Based on Availability)
- 16.2.1 Sanofi SA
List of Figures
- Figure 1: Global Stroke Disorder and Treatment Industry Revenue Breakdown (Million, %) by Region 2024 & 2032
- Figure 2: Global Stroke Disorder and Treatment Industry Volume Breakdown (K Units, %) by Region 2024 & 2032
- Figure 3: North America Stroke Disorder and Treatment Industry Revenue (Million), by Country 2024 & 2032
- Figure 4: North America Stroke Disorder and Treatment Industry Volume (K Units), by Country 2024 & 2032
- Figure 5: North America Stroke Disorder and Treatment Industry Revenue Share (%), by Country 2024 & 2032
- Figure 6: North America Stroke Disorder and Treatment Industry Volume Share (%), by Country 2024 & 2032
- Figure 7: Europe Stroke Disorder and Treatment Industry Revenue (Million), by Country 2024 & 2032
- Figure 8: Europe Stroke Disorder and Treatment Industry Volume (K Units), by Country 2024 & 2032
- Figure 9: Europe Stroke Disorder and Treatment Industry Revenue Share (%), by Country 2024 & 2032
- Figure 10: Europe Stroke Disorder and Treatment Industry Volume Share (%), by Country 2024 & 2032
- Figure 11: Asia Pacific Stroke Disorder and Treatment Industry Revenue (Million), by Country 2024 & 2032
- Figure 12: Asia Pacific Stroke Disorder and Treatment Industry Volume (K Units), by Country 2024 & 2032
- Figure 13: Asia Pacific Stroke Disorder and Treatment Industry Revenue Share (%), by Country 2024 & 2032
- Figure 14: Asia Pacific Stroke Disorder and Treatment Industry Volume Share (%), by Country 2024 & 2032
- Figure 15: Middle East and Africa Stroke Disorder and Treatment Industry Revenue (Million), by Country 2024 & 2032
- Figure 16: Middle East and Africa Stroke Disorder and Treatment Industry Volume (K Units), by Country 2024 & 2032
- Figure 17: Middle East and Africa Stroke Disorder and Treatment Industry Revenue Share (%), by Country 2024 & 2032
- Figure 18: Middle East and Africa Stroke Disorder and Treatment Industry Volume Share (%), by Country 2024 & 2032
- Figure 19: South America Stroke Disorder and Treatment Industry Revenue (Million), by Country 2024 & 2032
- Figure 20: South America Stroke Disorder and Treatment Industry Volume (K Units), by Country 2024 & 2032
- Figure 21: South America Stroke Disorder and Treatment Industry Revenue Share (%), by Country 2024 & 2032
- Figure 22: South America Stroke Disorder and Treatment Industry Volume Share (%), by Country 2024 & 2032
- Figure 23: North America Stroke Disorder and Treatment Industry Revenue (Million), by Type 2024 & 2032
- Figure 24: North America Stroke Disorder and Treatment Industry Volume (K Units), by Type 2024 & 2032
- Figure 25: North America Stroke Disorder and Treatment Industry Revenue Share (%), by Type 2024 & 2032
- Figure 26: North America Stroke Disorder and Treatment Industry Volume Share (%), by Type 2024 & 2032
- Figure 27: North America Stroke Disorder and Treatment Industry Revenue (Million), by Treatment 2024 & 2032
- Figure 28: North America Stroke Disorder and Treatment Industry Volume (K Units), by Treatment 2024 & 2032
- Figure 29: North America Stroke Disorder and Treatment Industry Revenue Share (%), by Treatment 2024 & 2032
- Figure 30: North America Stroke Disorder and Treatment Industry Volume Share (%), by Treatment 2024 & 2032
- Figure 31: North America Stroke Disorder and Treatment Industry Revenue (Million), by End User 2024 & 2032
- Figure 32: North America Stroke Disorder and Treatment Industry Volume (K Units), by End User 2024 & 2032
- Figure 33: North America Stroke Disorder and Treatment Industry Revenue Share (%), by End User 2024 & 2032
- Figure 34: North America Stroke Disorder and Treatment Industry Volume Share (%), by End User 2024 & 2032
- Figure 35: North America Stroke Disorder and Treatment Industry Revenue (Million), by Country 2024 & 2032
- Figure 36: North America Stroke Disorder and Treatment Industry Volume (K Units), by Country 2024 & 2032
- Figure 37: North America Stroke Disorder and Treatment Industry Revenue Share (%), by Country 2024 & 2032
- Figure 38: North America Stroke Disorder and Treatment Industry Volume Share (%), by Country 2024 & 2032
- Figure 39: Europe Stroke Disorder and Treatment Industry Revenue (Million), by Type 2024 & 2032
- Figure 40: Europe Stroke Disorder and Treatment Industry Volume (K Units), by Type 2024 & 2032
- Figure 41: Europe Stroke Disorder and Treatment Industry Revenue Share (%), by Type 2024 & 2032
- Figure 42: Europe Stroke Disorder and Treatment Industry Volume Share (%), by Type 2024 & 2032
- Figure 43: Europe Stroke Disorder and Treatment Industry Revenue (Million), by Treatment 2024 & 2032
- Figure 44: Europe Stroke Disorder and Treatment Industry Volume (K Units), by Treatment 2024 & 2032
- Figure 45: Europe Stroke Disorder and Treatment Industry Revenue Share (%), by Treatment 2024 & 2032
- Figure 46: Europe Stroke Disorder and Treatment Industry Volume Share (%), by Treatment 2024 & 2032
- Figure 47: Europe Stroke Disorder and Treatment Industry Revenue (Million), by End User 2024 & 2032
- Figure 48: Europe Stroke Disorder and Treatment Industry Volume (K Units), by End User 2024 & 2032
- Figure 49: Europe Stroke Disorder and Treatment Industry Revenue Share (%), by End User 2024 & 2032
- Figure 50: Europe Stroke Disorder and Treatment Industry Volume Share (%), by End User 2024 & 2032
- Figure 51: Europe Stroke Disorder and Treatment Industry Revenue (Million), by Country 2024 & 2032
- Figure 52: Europe Stroke Disorder and Treatment Industry Volume (K Units), by Country 2024 & 2032
- Figure 53: Europe Stroke Disorder and Treatment Industry Revenue Share (%), by Country 2024 & 2032
- Figure 54: Europe Stroke Disorder and Treatment Industry Volume Share (%), by Country 2024 & 2032
- Figure 55: Asia Pacific Stroke Disorder and Treatment Industry Revenue (Million), by Type 2024 & 2032
- Figure 56: Asia Pacific Stroke Disorder and Treatment Industry Volume (K Units), by Type 2024 & 2032
- Figure 57: Asia Pacific Stroke Disorder and Treatment Industry Revenue Share (%), by Type 2024 & 2032
- Figure 58: Asia Pacific Stroke Disorder and Treatment Industry Volume Share (%), by Type 2024 & 2032
- Figure 59: Asia Pacific Stroke Disorder and Treatment Industry Revenue (Million), by Treatment 2024 & 2032
- Figure 60: Asia Pacific Stroke Disorder and Treatment Industry Volume (K Units), by Treatment 2024 & 2032
- Figure 61: Asia Pacific Stroke Disorder and Treatment Industry Revenue Share (%), by Treatment 2024 & 2032
- Figure 62: Asia Pacific Stroke Disorder and Treatment Industry Volume Share (%), by Treatment 2024 & 2032
- Figure 63: Asia Pacific Stroke Disorder and Treatment Industry Revenue (Million), by End User 2024 & 2032
- Figure 64: Asia Pacific Stroke Disorder and Treatment Industry Volume (K Units), by End User 2024 & 2032
- Figure 65: Asia Pacific Stroke Disorder and Treatment Industry Revenue Share (%), by End User 2024 & 2032
- Figure 66: Asia Pacific Stroke Disorder and Treatment Industry Volume Share (%), by End User 2024 & 2032
- Figure 67: Asia Pacific Stroke Disorder and Treatment Industry Revenue (Million), by Country 2024 & 2032
- Figure 68: Asia Pacific Stroke Disorder and Treatment Industry Volume (K Units), by Country 2024 & 2032
- Figure 69: Asia Pacific Stroke Disorder and Treatment Industry Revenue Share (%), by Country 2024 & 2032
- Figure 70: Asia Pacific Stroke Disorder and Treatment Industry Volume Share (%), by Country 2024 & 2032
- Figure 71: Middle East and Africa Stroke Disorder and Treatment Industry Revenue (Million), by Type 2024 & 2032
- Figure 72: Middle East and Africa Stroke Disorder and Treatment Industry Volume (K Units), by Type 2024 & 2032
- Figure 73: Middle East and Africa Stroke Disorder and Treatment Industry Revenue Share (%), by Type 2024 & 2032
- Figure 74: Middle East and Africa Stroke Disorder and Treatment Industry Volume Share (%), by Type 2024 & 2032
- Figure 75: Middle East and Africa Stroke Disorder and Treatment Industry Revenue (Million), by Treatment 2024 & 2032
- Figure 76: Middle East and Africa Stroke Disorder and Treatment Industry Volume (K Units), by Treatment 2024 & 2032
- Figure 77: Middle East and Africa Stroke Disorder and Treatment Industry Revenue Share (%), by Treatment 2024 & 2032
- Figure 78: Middle East and Africa Stroke Disorder and Treatment Industry Volume Share (%), by Treatment 2024 & 2032
- Figure 79: Middle East and Africa Stroke Disorder and Treatment Industry Revenue (Million), by End User 2024 & 2032
- Figure 80: Middle East and Africa Stroke Disorder and Treatment Industry Volume (K Units), by End User 2024 & 2032
- Figure 81: Middle East and Africa Stroke Disorder and Treatment Industry Revenue Share (%), by End User 2024 & 2032
- Figure 82: Middle East and Africa Stroke Disorder and Treatment Industry Volume Share (%), by End User 2024 & 2032
- Figure 83: Middle East and Africa Stroke Disorder and Treatment Industry Revenue (Million), by Country 2024 & 2032
- Figure 84: Middle East and Africa Stroke Disorder and Treatment Industry Volume (K Units), by Country 2024 & 2032
- Figure 85: Middle East and Africa Stroke Disorder and Treatment Industry Revenue Share (%), by Country 2024 & 2032
- Figure 86: Middle East and Africa Stroke Disorder and Treatment Industry Volume Share (%), by Country 2024 & 2032
- Figure 87: South America Stroke Disorder and Treatment Industry Revenue (Million), by Type 2024 & 2032
- Figure 88: South America Stroke Disorder and Treatment Industry Volume (K Units), by Type 2024 & 2032
- Figure 89: South America Stroke Disorder and Treatment Industry Revenue Share (%), by Type 2024 & 2032
- Figure 90: South America Stroke Disorder and Treatment Industry Volume Share (%), by Type 2024 & 2032
- Figure 91: South America Stroke Disorder and Treatment Industry Revenue (Million), by Treatment 2024 & 2032
- Figure 92: South America Stroke Disorder and Treatment Industry Volume (K Units), by Treatment 2024 & 2032
- Figure 93: South America Stroke Disorder and Treatment Industry Revenue Share (%), by Treatment 2024 & 2032
- Figure 94: South America Stroke Disorder and Treatment Industry Volume Share (%), by Treatment 2024 & 2032
- Figure 95: South America Stroke Disorder and Treatment Industry Revenue (Million), by End User 2024 & 2032
- Figure 96: South America Stroke Disorder and Treatment Industry Volume (K Units), by End User 2024 & 2032
- Figure 97: South America Stroke Disorder and Treatment Industry Revenue Share (%), by End User 2024 & 2032
- Figure 98: South America Stroke Disorder and Treatment Industry Volume Share (%), by End User 2024 & 2032
- Figure 99: South America Stroke Disorder and Treatment Industry Revenue (Million), by Country 2024 & 2032
- Figure 100: South America Stroke Disorder and Treatment Industry Volume (K Units), by Country 2024 & 2032
- Figure 101: South America Stroke Disorder and Treatment Industry Revenue Share (%), by Country 2024 & 2032
- Figure 102: South America Stroke Disorder and Treatment Industry Volume Share (%), by Country 2024 & 2032
List of Tables
- Table 1: Global Stroke Disorder and Treatment Industry Revenue Million Forecast, by Region 2019 & 2032
- Table 2: Global Stroke Disorder and Treatment Industry Volume K Units Forecast, by Region 2019 & 2032
- Table 3: Global Stroke Disorder and Treatment Industry Revenue Million Forecast, by Type 2019 & 2032
- Table 4: Global Stroke Disorder and Treatment Industry Volume K Units Forecast, by Type 2019 & 2032
- Table 5: Global Stroke Disorder and Treatment Industry Revenue Million Forecast, by Treatment 2019 & 2032
- Table 6: Global Stroke Disorder and Treatment Industry Volume K Units Forecast, by Treatment 2019 & 2032
- Table 7: Global Stroke Disorder and Treatment Industry Revenue Million Forecast, by End User 2019 & 2032
- Table 8: Global Stroke Disorder and Treatment Industry Volume K Units Forecast, by End User 2019 & 2032
- Table 9: Global Stroke Disorder and Treatment Industry Revenue Million Forecast, by Region 2019 & 2032
- Table 10: Global Stroke Disorder and Treatment Industry Volume K Units Forecast, by Region 2019 & 2032
- Table 11: Global Stroke Disorder and Treatment Industry Revenue Million Forecast, by Country 2019 & 2032
- Table 12: Global Stroke Disorder and Treatment Industry Volume K Units Forecast, by Country 2019 & 2032
- Table 13: United States Stroke Disorder and Treatment Industry Revenue (Million) Forecast, by Application 2019 & 2032
- Table 14: United States Stroke Disorder and Treatment Industry Volume (K Units) Forecast, by Application 2019 & 2032
- Table 15: Canada Stroke Disorder and Treatment Industry Revenue (Million) Forecast, by Application 2019 & 2032
- Table 16: Canada Stroke Disorder and Treatment Industry Volume (K Units) Forecast, by Application 2019 & 2032
- Table 17: Mexico Stroke Disorder and Treatment Industry Revenue (Million) Forecast, by Application 2019 & 2032
- Table 18: Mexico Stroke Disorder and Treatment Industry Volume (K Units) Forecast, by Application 2019 & 2032
- Table 19: Global Stroke Disorder and Treatment Industry Revenue Million Forecast, by Country 2019 & 2032
- Table 20: Global Stroke Disorder and Treatment Industry Volume K Units Forecast, by Country 2019 & 2032
- Table 21: Germany Stroke Disorder and Treatment Industry Revenue (Million) Forecast, by Application 2019 & 2032
- Table 22: Germany Stroke Disorder and Treatment Industry Volume (K Units) Forecast, by Application 2019 & 2032
- Table 23: United Kingdom Stroke Disorder and Treatment Industry Revenue (Million) Forecast, by Application 2019 & 2032
- Table 24: United Kingdom Stroke Disorder and Treatment Industry Volume (K Units) Forecast, by Application 2019 & 2032
- Table 25: France Stroke Disorder and Treatment Industry Revenue (Million) Forecast, by Application 2019 & 2032
- Table 26: France Stroke Disorder and Treatment Industry Volume (K Units) Forecast, by Application 2019 & 2032
- Table 27: Italy Stroke Disorder and Treatment Industry Revenue (Million) Forecast, by Application 2019 & 2032
- Table 28: Italy Stroke Disorder and Treatment Industry Volume (K Units) Forecast, by Application 2019 & 2032
- Table 29: Spain Stroke Disorder and Treatment Industry Revenue (Million) Forecast, by Application 2019 & 2032
- Table 30: Spain Stroke Disorder and Treatment Industry Volume (K Units) Forecast, by Application 2019 & 2032
- Table 31: Rest of Europe Stroke Disorder and Treatment Industry Revenue (Million) Forecast, by Application 2019 & 2032
- Table 32: Rest of Europe Stroke Disorder and Treatment Industry Volume (K Units) Forecast, by Application 2019 & 2032
- Table 33: Global Stroke Disorder and Treatment Industry Revenue Million Forecast, by Country 2019 & 2032
- Table 34: Global Stroke Disorder and Treatment Industry Volume K Units Forecast, by Country 2019 & 2032
- Table 35: China Stroke Disorder and Treatment Industry Revenue (Million) Forecast, by Application 2019 & 2032
- Table 36: China Stroke Disorder and Treatment Industry Volume (K Units) Forecast, by Application 2019 & 2032
- Table 37: Japan Stroke Disorder and Treatment Industry Revenue (Million) Forecast, by Application 2019 & 2032
- Table 38: Japan Stroke Disorder and Treatment Industry Volume (K Units) Forecast, by Application 2019 & 2032
- Table 39: India Stroke Disorder and Treatment Industry Revenue (Million) Forecast, by Application 2019 & 2032
- Table 40: India Stroke Disorder and Treatment Industry Volume (K Units) Forecast, by Application 2019 & 2032
- Table 41: Australia Stroke Disorder and Treatment Industry Revenue (Million) Forecast, by Application 2019 & 2032
- Table 42: Australia Stroke Disorder and Treatment Industry Volume (K Units) Forecast, by Application 2019 & 2032
- Table 43: South Korea Stroke Disorder and Treatment Industry Revenue (Million) Forecast, by Application 2019 & 2032
- Table 44: South Korea Stroke Disorder and Treatment Industry Volume (K Units) Forecast, by Application 2019 & 2032
- Table 45: Rest of Asia Pacific Stroke Disorder and Treatment Industry Revenue (Million) Forecast, by Application 2019 & 2032
- Table 46: Rest of Asia Pacific Stroke Disorder and Treatment Industry Volume (K Units) Forecast, by Application 2019 & 2032
- Table 47: Global Stroke Disorder and Treatment Industry Revenue Million Forecast, by Country 2019 & 2032
- Table 48: Global Stroke Disorder and Treatment Industry Volume K Units Forecast, by Country 2019 & 2032
- Table 49: GCC Stroke Disorder and Treatment Industry Revenue (Million) Forecast, by Application 2019 & 2032
- Table 50: GCC Stroke Disorder and Treatment Industry Volume (K Units) Forecast, by Application 2019 & 2032
- Table 51: South Africa Stroke Disorder and Treatment Industry Revenue (Million) Forecast, by Application 2019 & 2032
- Table 52: South Africa Stroke Disorder and Treatment Industry Volume (K Units) Forecast, by Application 2019 & 2032
- Table 53: Rest of Middle East and Africa Stroke Disorder and Treatment Industry Revenue (Million) Forecast, by Application 2019 & 2032
- Table 54: Rest of Middle East and Africa Stroke Disorder and Treatment Industry Volume (K Units) Forecast, by Application 2019 & 2032
- Table 55: Global Stroke Disorder and Treatment Industry Revenue Million Forecast, by Country 2019 & 2032
- Table 56: Global Stroke Disorder and Treatment Industry Volume K Units Forecast, by Country 2019 & 2032
- Table 57: Brazil Stroke Disorder and Treatment Industry Revenue (Million) Forecast, by Application 2019 & 2032
- Table 58: Brazil Stroke Disorder and Treatment Industry Volume (K Units) Forecast, by Application 2019 & 2032
- Table 59: Argentina Stroke Disorder and Treatment Industry Revenue (Million) Forecast, by Application 2019 & 2032
- Table 60: Argentina Stroke Disorder and Treatment Industry Volume (K Units) Forecast, by Application 2019 & 2032
- Table 61: Rest of South America Stroke Disorder and Treatment Industry Revenue (Million) Forecast, by Application 2019 & 2032
- Table 62: Rest of South America Stroke Disorder and Treatment Industry Volume (K Units) Forecast, by Application 2019 & 2032
- Table 63: Global Stroke Disorder and Treatment Industry Revenue Million Forecast, by Type 2019 & 2032
- Table 64: Global Stroke Disorder and Treatment Industry Volume K Units Forecast, by Type 2019 & 2032
- Table 65: Global Stroke Disorder and Treatment Industry Revenue Million Forecast, by Treatment 2019 & 2032
- Table 66: Global Stroke Disorder and Treatment Industry Volume K Units Forecast, by Treatment 2019 & 2032
- Table 67: Global Stroke Disorder and Treatment Industry Revenue Million Forecast, by End User 2019 & 2032
- Table 68: Global Stroke Disorder and Treatment Industry Volume K Units Forecast, by End User 2019 & 2032
- Table 69: Global Stroke Disorder and Treatment Industry Revenue Million Forecast, by Country 2019 & 2032
- Table 70: Global Stroke Disorder and Treatment Industry Volume K Units Forecast, by Country 2019 & 2032
- Table 71: United States Stroke Disorder and Treatment Industry Revenue (Million) Forecast, by Application 2019 & 2032
- Table 72: United States Stroke Disorder and Treatment Industry Volume (K Units) Forecast, by Application 2019 & 2032
- Table 73: Canada Stroke Disorder and Treatment Industry Revenue (Million) Forecast, by Application 2019 & 2032
- Table 74: Canada Stroke Disorder and Treatment Industry Volume (K Units) Forecast, by Application 2019 & 2032
- Table 75: Mexico Stroke Disorder and Treatment Industry Revenue (Million) Forecast, by Application 2019 & 2032
- Table 76: Mexico Stroke Disorder and Treatment Industry Volume (K Units) Forecast, by Application 2019 & 2032
- Table 77: Global Stroke Disorder and Treatment Industry Revenue Million Forecast, by Type 2019 & 2032
- Table 78: Global Stroke Disorder and Treatment Industry Volume K Units Forecast, by Type 2019 & 2032
- Table 79: Global Stroke Disorder and Treatment Industry Revenue Million Forecast, by Treatment 2019 & 2032
- Table 80: Global Stroke Disorder and Treatment Industry Volume K Units Forecast, by Treatment 2019 & 2032
- Table 81: Global Stroke Disorder and Treatment Industry Revenue Million Forecast, by End User 2019 & 2032
- Table 82: Global Stroke Disorder and Treatment Industry Volume K Units Forecast, by End User 2019 & 2032
- Table 83: Global Stroke Disorder and Treatment Industry Revenue Million Forecast, by Country 2019 & 2032
- Table 84: Global Stroke Disorder and Treatment Industry Volume K Units Forecast, by Country 2019 & 2032
- Table 85: Germany Stroke Disorder and Treatment Industry Revenue (Million) Forecast, by Application 2019 & 2032
- Table 86: Germany Stroke Disorder and Treatment Industry Volume (K Units) Forecast, by Application 2019 & 2032
- Table 87: United Kingdom Stroke Disorder and Treatment Industry Revenue (Million) Forecast, by Application 2019 & 2032
- Table 88: United Kingdom Stroke Disorder and Treatment Industry Volume (K Units) Forecast, by Application 2019 & 2032
- Table 89: France Stroke Disorder and Treatment Industry Revenue (Million) Forecast, by Application 2019 & 2032
- Table 90: France Stroke Disorder and Treatment Industry Volume (K Units) Forecast, by Application 2019 & 2032
- Table 91: Italy Stroke Disorder and Treatment Industry Revenue (Million) Forecast, by Application 2019 & 2032
- Table 92: Italy Stroke Disorder and Treatment Industry Volume (K Units) Forecast, by Application 2019 & 2032
- Table 93: Spain Stroke Disorder and Treatment Industry Revenue (Million) Forecast, by Application 2019 & 2032
- Table 94: Spain Stroke Disorder and Treatment Industry Volume (K Units) Forecast, by Application 2019 & 2032
- Table 95: Rest of Europe Stroke Disorder and Treatment Industry Revenue (Million) Forecast, by Application 2019 & 2032
- Table 96: Rest of Europe Stroke Disorder and Treatment Industry Volume (K Units) Forecast, by Application 2019 & 2032
- Table 97: Global Stroke Disorder and Treatment Industry Revenue Million Forecast, by Type 2019 & 2032
- Table 98: Global Stroke Disorder and Treatment Industry Volume K Units Forecast, by Type 2019 & 2032
- Table 99: Global Stroke Disorder and Treatment Industry Revenue Million Forecast, by Treatment 2019 & 2032
- Table 100: Global Stroke Disorder and Treatment Industry Volume K Units Forecast, by Treatment 2019 & 2032
- Table 101: Global Stroke Disorder and Treatment Industry Revenue Million Forecast, by End User 2019 & 2032
- Table 102: Global Stroke Disorder and Treatment Industry Volume K Units Forecast, by End User 2019 & 2032
- Table 103: Global Stroke Disorder and Treatment Industry Revenue Million Forecast, by Country 2019 & 2032
- Table 104: Global Stroke Disorder and Treatment Industry Volume K Units Forecast, by Country 2019 & 2032
- Table 105: China Stroke Disorder and Treatment Industry Revenue (Million) Forecast, by Application 2019 & 2032
- Table 106: China Stroke Disorder and Treatment Industry Volume (K Units) Forecast, by Application 2019 & 2032
- Table 107: Japan Stroke Disorder and Treatment Industry Revenue (Million) Forecast, by Application 2019 & 2032
- Table 108: Japan Stroke Disorder and Treatment Industry Volume (K Units) Forecast, by Application 2019 & 2032
- Table 109: India Stroke Disorder and Treatment Industry Revenue (Million) Forecast, by Application 2019 & 2032
- Table 110: India Stroke Disorder and Treatment Industry Volume (K Units) Forecast, by Application 2019 & 2032
- Table 111: Australia Stroke Disorder and Treatment Industry Revenue (Million) Forecast, by Application 2019 & 2032
- Table 112: Australia Stroke Disorder and Treatment Industry Volume (K Units) Forecast, by Application 2019 & 2032
- Table 113: South Korea Stroke Disorder and Treatment Industry Revenue (Million) Forecast, by Application 2019 & 2032
- Table 114: South Korea Stroke Disorder and Treatment Industry Volume (K Units) Forecast, by Application 2019 & 2032
- Table 115: Rest of Asia Pacific Stroke Disorder and Treatment Industry Revenue (Million) Forecast, by Application 2019 & 2032
- Table 116: Rest of Asia Pacific Stroke Disorder and Treatment Industry Volume (K Units) Forecast, by Application 2019 & 2032
- Table 117: Global Stroke Disorder and Treatment Industry Revenue Million Forecast, by Type 2019 & 2032
- Table 118: Global Stroke Disorder and Treatment Industry Volume K Units Forecast, by Type 2019 & 2032
- Table 119: Global Stroke Disorder and Treatment Industry Revenue Million Forecast, by Treatment 2019 & 2032
- Table 120: Global Stroke Disorder and Treatment Industry Volume K Units Forecast, by Treatment 2019 & 2032
- Table 121: Global Stroke Disorder and Treatment Industry Revenue Million Forecast, by End User 2019 & 2032
- Table 122: Global Stroke Disorder and Treatment Industry Volume K Units Forecast, by End User 2019 & 2032
- Table 123: Global Stroke Disorder and Treatment Industry Revenue Million Forecast, by Country 2019 & 2032
- Table 124: Global Stroke Disorder and Treatment Industry Volume K Units Forecast, by Country 2019 & 2032
- Table 125: GCC Stroke Disorder and Treatment Industry Revenue (Million) Forecast, by Application 2019 & 2032
- Table 126: GCC Stroke Disorder and Treatment Industry Volume (K Units) Forecast, by Application 2019 & 2032
- Table 127: South Africa Stroke Disorder and Treatment Industry Revenue (Million) Forecast, by Application 2019 & 2032
- Table 128: South Africa Stroke Disorder and Treatment Industry Volume (K Units) Forecast, by Application 2019 & 2032
- Table 129: Rest of Middle East and Africa Stroke Disorder and Treatment Industry Revenue (Million) Forecast, by Application 2019 & 2032
- Table 130: Rest of Middle East and Africa Stroke Disorder and Treatment Industry Volume (K Units) Forecast, by Application 2019 & 2032
- Table 131: Global Stroke Disorder and Treatment Industry Revenue Million Forecast, by Type 2019 & 2032
- Table 132: Global Stroke Disorder and Treatment Industry Volume K Units Forecast, by Type 2019 & 2032
- Table 133: Global Stroke Disorder and Treatment Industry Revenue Million Forecast, by Treatment 2019 & 2032
- Table 134: Global Stroke Disorder and Treatment Industry Volume K Units Forecast, by Treatment 2019 & 2032
- Table 135: Global Stroke Disorder and Treatment Industry Revenue Million Forecast, by End User 2019 & 2032
- Table 136: Global Stroke Disorder and Treatment Industry Volume K Units Forecast, by End User 2019 & 2032
- Table 137: Global Stroke Disorder and Treatment Industry Revenue Million Forecast, by Country 2019 & 2032
- Table 138: Global Stroke Disorder and Treatment Industry Volume K Units Forecast, by Country 2019 & 2032
- Table 139: Brazil Stroke Disorder and Treatment Industry Revenue (Million) Forecast, by Application 2019 & 2032
- Table 140: Brazil Stroke Disorder and Treatment Industry Volume (K Units) Forecast, by Application 2019 & 2032
- Table 141: Argentina Stroke Disorder and Treatment Industry Revenue (Million) Forecast, by Application 2019 & 2032
- Table 142: Argentina Stroke Disorder and Treatment Industry Volume (K Units) Forecast, by Application 2019 & 2032
- Table 143: Rest of South America Stroke Disorder and Treatment Industry Revenue (Million) Forecast, by Application 2019 & 2032
- Table 144: Rest of South America Stroke Disorder and Treatment Industry Volume (K Units) Forecast, by Application 2019 & 2032
Frequently Asked Questions
1. What is the projected Compound Annual Growth Rate (CAGR) of the Stroke Disorder and Treatment Industry?
The projected CAGR is approximately 4.50%.
2. Which companies are prominent players in the Stroke Disorder and Treatment Industry?
Key companies in the market include Sanofi SA, F Hoffmann La Roche Ltd, Boehringer Ingelheim International GmbH, Daiichi Sankyo Company Limited, Bayer AG, Amgen Inc, Johnson & Johnson, Merck and Co Inc, Biogen Inc, Bristol-Myers Squibb Company, Pfizer Inc.
3. What are the main segments of the Stroke Disorder and Treatment Industry?
The market segments include Type, Treatment, End User.
4. Can you provide details about the market size?
The market size is estimated to be USD XX Million as of 2022.
5. What are some drivers contributing to market growth?
Investment by Market Players for the Development of New Therapy and Advanced Technology; Increasing Number of Stroke Patients.
6. What are the notable trends driving market growth?
Tissue Plasminogen Activators (TPA) Dominated in the Market and is Expected to Hold Dominance during the Forecast Period.
7. Are there any restraints impacting market growth?
Entry of Various Generic Drugs.
8. Can you provide examples of recent developments in the market?
N/A
9. What pricing options are available for accessing the report?
Pricing options include single-user, multi-user, and enterprise licenses priced at USD 4750, USD 5250, and USD 8750 respectively.
10. Is the market size provided in terms of value or volume?
The market size is provided in terms of value, measured in Million and volume, measured in K Units.
11. Are there any specific market keywords associated with the report?
Yes, the market keyword associated with the report is "Stroke Disorder and Treatment Industry," which aids in identifying and referencing the specific market segment covered.
12. How do I determine which pricing option suits my needs best?
The pricing options vary based on user requirements and access needs. Individual users may opt for single-user licenses, while businesses requiring broader access may choose multi-user or enterprise licenses for cost-effective access to the report.
13. Are there any additional resources or data provided in the Stroke Disorder and Treatment Industry report?
While the report offers comprehensive insights, it's advisable to review the specific contents or supplementary materials provided to ascertain if additional resources or data are available.
14. How can I stay updated on further developments or reports in the Stroke Disorder and Treatment Industry?
To stay informed about further developments, trends, and reports in the Stroke Disorder and Treatment Industry, consider subscribing to industry newsletters, following relevant companies and organizations, or regularly checking reputable industry news sources and publications.
Methodology
Step 1 - Identification of Relevant Samples Size from Population Database


Step 2 - Approaches for Defining Global Market Size (Value, Volume* & Price*)

Note*: In applicable scenarios
Step 3 - Data Sources
Primary Research
- Web Analytics
- Survey Reports
- Research Institute
- Latest Research Reports
- Opinion Leaders
Secondary Research
- Annual Reports
- White Paper
- Latest Press Release
- Industry Association
- Paid Database
- Investor Presentations

Step 4 - Data Triangulation
Involves using different sources of information in order to increase the validity of a study
These sources are likely to be stakeholders in a program - participants, other researchers, program staff, other community members, and so on.
Then we put all data in single framework & apply various statistical tools to find out the dynamic on the market.
During the analysis stage, feedback from the stakeholder groups would be compared to determine areas of agreement as well as areas of divergence
