

Key Insights
The global sodium reduction ingredients market is experiencing robust growth, projected to reach a significant value by 2033. Driven by increasing consumer awareness of the health risks associated with high sodium intake, coupled with stringent government regulations promoting healthier food options, the market is witnessing a surge in demand for effective sodium reduction solutions. Key drivers include the rising prevalence of hypertension and cardiovascular diseases, leading food manufacturers to reformulate their products with lower sodium content while maintaining taste and texture. This demand fuels innovation in the development of effective and palatable sodium reduction ingredients, including amino acids, mineral salts (like potassium chloride), yeast extracts, and calcium chloride. The market is segmented by product type, with amino acids and mineral salts holding substantial market share, owing to their efficacy and cost-effectiveness. Application-wise, the bakery & confectionery, condiments, and dairy & frozen foods sectors are key consumers, indicating a broad market penetration across various food categories.
Growth is further fueled by advancements in ingredient technology allowing for more precise sodium reduction without compromising taste or product quality. Emerging trends include the increased use of natural and clean-label sodium reduction ingredients, catering to the growing consumer preference for healthier and more transparent food products. While challenges exist, including the cost of implementing new formulations and overcoming potential flavor compromises, the long-term growth outlook remains positive. Major players such as Angel Yeast Co Ltd, Givaudan, DSM, K+S Kali GMBH, and Cargill Inc. are actively engaged in research and development, expanding their product portfolios, and focusing on strategic partnerships to capture market share in this rapidly evolving landscape. Regional variations exist, with North America and Europe currently representing significant market shares, but the Asia-Pacific region demonstrates high growth potential, driven by increasing disposable incomes and changing dietary habits.
Sodium Reduction Ingredients Industry Market Report: 2019-2033
This comprehensive report provides an in-depth analysis of the Sodium Reduction Ingredients market, offering valuable insights for stakeholders seeking to navigate this dynamic sector. Covering the period from 2019 to 2033, with a focus on 2025, this report examines market trends, competitive landscapes, and future growth prospects. The global market is projected to reach xx Million by 2033, presenting significant opportunities for investment and expansion.
Sodium Reduction Ingredients Industry Market Composition & Trends
This section analyzes the Sodium Reduction Ingredients market's structure, examining market concentration, innovation drivers, regulatory shifts, substitute products, end-user profiles, and merger & acquisition (M&A) activities. The market is moderately fragmented, with key players like Cargill Inc, Kerry Group Plc, and DSM holding significant but not dominant market share. Precise market share distribution data for 2025 is unavailable (xx%), but the report provides estimated values based on rigorous analysis. Innovation is primarily driven by consumer demand for healthier food options and stricter government regulations limiting sodium intake. The regulatory landscape varies across regions, influencing product development and market access. Substitute products include potassium chloride and other mineral salts, although their functionality may differ from sodium chloride. Major end-users span the food and beverage industry, including bakery, condiments, and dairy sectors. M&A activity within the sector has been moderate, with deal values averaging xx Million in recent years.
- Market Concentration: Moderately fragmented (xx% market share for top 5 players in 2025)
- Key Innovation Catalysts: Consumer health consciousness, stringent sodium regulations.
- Regulatory Landscape: Regionally diverse, impacting product approvals and market entry.
- Substitute Products: Potassium chloride, other mineral salts.
- End-User Profile: Primarily food and beverage manufacturers.
- M&A Activity: Moderate, with average deal values of xx Million (2019-2024).
Sodium Reduction Ingredients Industry Industry Evolution
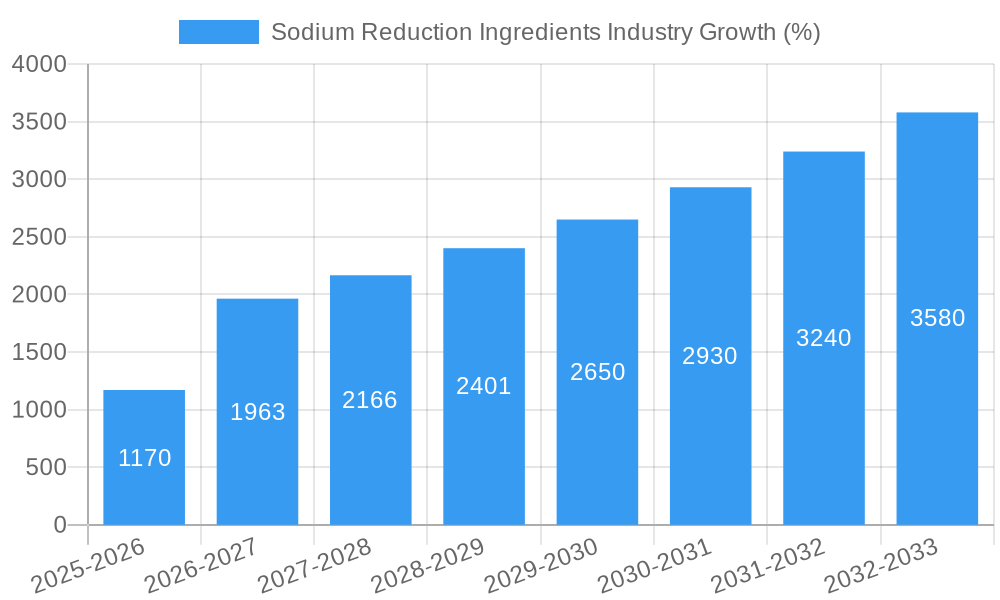
The Sodium Reduction Ingredients market has experienced significant evolution, driven by growing health awareness, changing consumer preferences, and technological advancements. From 2019 to 2024, the market witnessed a Compound Annual Growth Rate (CAGR) of xx%, fueled by increasing demand for low-sodium food products. This trend is expected to continue, with a projected CAGR of xx% during the forecast period (2025-2033). Technological advancements, such as the development of novel sodium reduction technologies and improved salt alternatives, contribute to this growth. Consumers are increasingly seeking healthier food options with reduced sodium content, further driving market expansion. The report details specific data points on growth rates and adoption metrics for different product types and applications.
Leading Regions, Countries, or Segments in Sodium Reduction Ingredients Industry
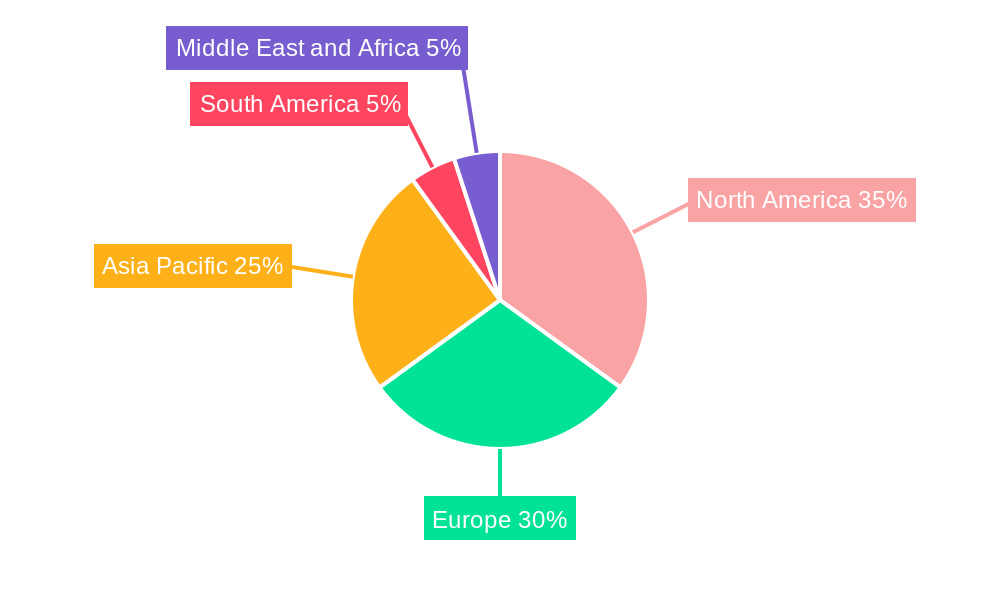
The North American and European regions currently dominate the Sodium Reduction Ingredients market, driven by robust regulatory frameworks promoting sodium reduction and high consumer awareness of health issues related to high sodium intake. Within product types, mineral salts and yeast extracts hold significant market share due to their functional properties and cost-effectiveness. The bakery and confectionery sector is a key application area, followed closely by condiments, seasonings, and sauces.
- Key Drivers in North America & Europe: Stringent regulations, high consumer health consciousness, significant investment in R&D.
- Dominant Product Types: Mineral salts, Yeast Extracts.
- Leading Application Segments: Bakery & Confectionery, Condiments, Seasonings & Sauces.
Sodium Reduction Ingredients Industry Product Innovations
Recent product innovations focus on creating functional ingredients that effectively reduce sodium content without compromising taste or texture. Cargill's purified sea salt flour, for instance, offers a unique fine-grained texture suitable for various applications. Other innovations involve the use of natural flavor enhancers and masking agents to minimize the impact of sodium reduction on palatability. These advancements cater to the growing demand for healthier yet delicious food products.
Propelling Factors for Sodium Reduction Ingredients Industry Growth
Several factors contribute to the growth of the Sodium Reduction Ingredients market. Firstly, the increasing prevalence of cardiovascular diseases linked to high sodium intake drives consumer demand for low-sodium alternatives. Secondly, stringent government regulations mandating sodium reduction in processed foods are pushing manufacturers to adopt these ingredients. Thirdly, technological advancements in ingredient development and formulation are creating more effective and palatable sodium-reduced products.
Obstacles in the Sodium Reduction Ingredients Industry Market
Despite the growth potential, the Sodium Reduction Ingredients market faces challenges. The high cost of some sodium-reducing ingredients compared to traditional salt can hinder adoption, especially in price-sensitive markets. Supply chain disruptions and fluctuations in raw material prices also present risks. Intense competition among established and emerging players further adds pressure on profit margins. The regulatory landscape can also be complex and vary across jurisdictions.
Future Opportunities in Sodium Reduction Ingredients Industry
Future opportunities lie in expanding into emerging markets with growing health awareness and regulatory changes. Furthermore, developing innovative products tailored to specific dietary requirements, such as those with reduced sodium and enhanced flavor profiles, will attract consumers and manufacturers. Investing in research and development of sustainable and cost-effective sodium reduction solutions can unlock new revenue streams.
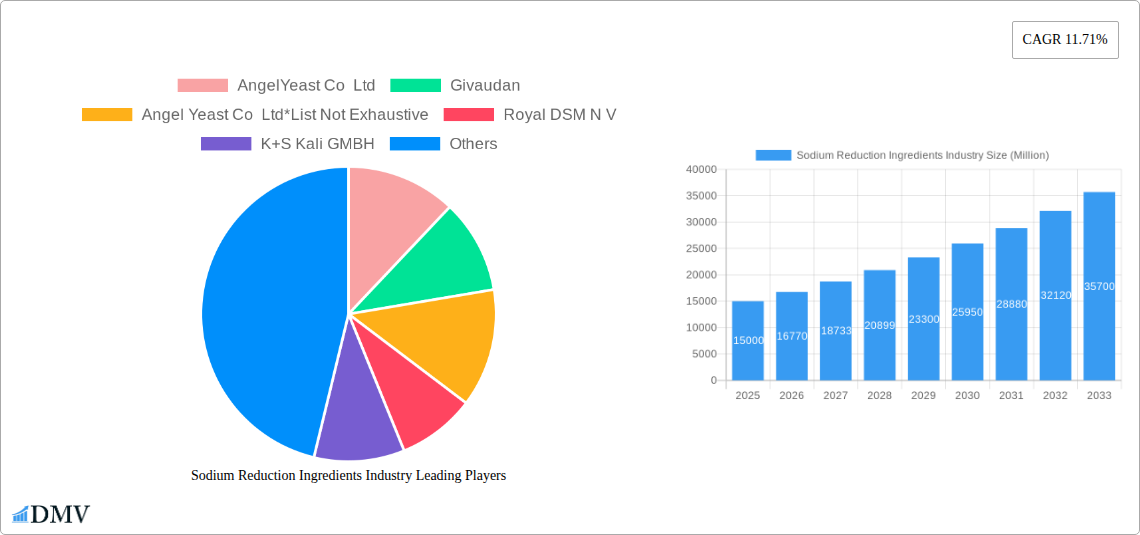
Major Players in the Sodium Reduction Ingredients Industry Ecosystem
- AngelYeast Co Ltd
- Givaudan
- Royal DSM N V
- K+S Kali GMBH
- Advanced Food Systems Inc
- Kerry Group Plc
- DuPont
- Dr Paul Lohmann GmbH & Co KGaA
- Cargill Inc
Key Developments in Sodium Reduction Ingredients Industry Industry
- 2021 (Q4): Cargill Salt launched a new purified sea salt flour, expanding its offerings in the low-sodium ingredient market.
- 2021 (Q3): Tata Salt introduced Tata Salt SuperLite, India's first 30% low-sodium salt, capitalizing on growing health concerns.
- 2021 (Q1): Food For Life launched three low-sodium products (English muffins, cereal, tortillas), targeting health-conscious consumers seeking convenient options.
Strategic Sodium Reduction Ingredients Industry Market Forecast
The Sodium Reduction Ingredients market is poised for substantial growth driven by an increasing focus on health and wellness, stricter regulations, and continuous innovation in low-sodium ingredient technologies. The market's expansion will be further accelerated by the rising demand for processed foods with reduced sodium content, paving the way for considerable market expansion and investment opportunities.
Sodium Reduction Ingredients Industry Segmentation
-
1. Product Type
- 1.1. Amino Acids & Glutamates
-
1.2. Mineral Salts
- 1.2.1. Potassium Chloride
- 1.2.2. Magnesium Sulphate
- 1.2.3. Potassium Lactate
- 1.2.4. Calcium Chloride
- 1.3. Yeast Extracts
- 1.4. Others
-
2. Application
- 2.1. Bakery & Confectionery
- 2.2. Condiments, Seasonings & Sauces
- 2.3. Dairy & Frozen Foods
- 2.4. Meat & Meat Products
- 2.5. Snacks
- 2.6. Others
Sodium Reduction Ingredients Industry Segmentation By Geography
-
1. North America
- 1.1. United States
- 1.2. Canada
- 1.3. Mexico
- 1.4. Rest of North America
-
2. Europe
- 2.1. United Kingdom
- 2.2. Germany
- 2.3. France
- 2.4. Russia
- 2.5. Italy
- 2.6. Spain
- 2.7. Rest of Europe
-
3. Asia Pacific
- 3.1. India
- 3.2. China
- 3.3. Japan
- 3.4. Australia
- 3.5. Rest of Asia Pacific
-
4. South America
- 4.1. Brazil
- 4.2. Argentina
- 4.3. Rest of South America
-
5. Middle East and Africa
- 5.1. South Africa
- 5.2. Saudi Arabia
- 5.3. Rest of Middle East and Africa
Sodium Reduction Ingredients Industry REPORT HIGHLIGHTS
| Aspects | Details |
|---|---|
| Study Period | 2019-2033 |
| Base Year | 2024 |
| Estimated Year | 2025 |
| Forecast Period | 2025-2033 |
| Historical Period | 2019-2024 |
| Growth Rate | CAGR of 11.71% from 2019-2033 |
| Segmentation |
|
Table of Contents
- 1. Introduction
- 1.1. Research Scope
- 1.2. Market Segmentation
- 1.3. Research Methodology
- 1.4. Definitions and Assumptions
- 2. Executive Summary
- 2.1. Introduction
- 3. Market Dynamics
- 3.1. Introduction
- 3.2. Market Drivers
- 3.2.1. Increasing Focus on Maintaining Health and Well-Being; Launching Supplements For Specific Purposes and Targeted Population
- 3.3. Market Restrains
- 3.3.1. Supplement Consumption and Their Side-effects; Inclination Towards Substitute Products
- 3.4. Market Trends
- 3.4.1. Growing Consumer Awareness Toward High Sodium Intake
- 4. Market Factor Analysis
- 4.1. Porters Five Forces
- 4.2. Supply/Value Chain
- 4.3. PESTEL analysis
- 4.4. Market Entropy
- 4.5. Patent/Trademark Analysis
- 5. Global Sodium Reduction Ingredients Industry Analysis, Insights and Forecast, 2019-2031
- 5.1. Market Analysis, Insights and Forecast - by Product Type
- 5.1.1. Amino Acids & Glutamates
- 5.1.2. Mineral Salts
- 5.1.2.1. Potassium Chloride
- 5.1.2.2. Magnesium Sulphate
- 5.1.2.3. Potassium Lactate
- 5.1.2.4. Calcium Chloride
- 5.1.3. Yeast Extracts
- 5.1.4. Others
- 5.2. Market Analysis, Insights and Forecast - by Application
- 5.2.1. Bakery & Confectionery
- 5.2.2. Condiments, Seasonings & Sauces
- 5.2.3. Dairy & Frozen Foods
- 5.2.4. Meat & Meat Products
- 5.2.5. Snacks
- 5.2.6. Others
- 5.3. Market Analysis, Insights and Forecast - by Region
- 5.3.1. North America
- 5.3.2. Europe
- 5.3.3. Asia Pacific
- 5.3.4. South America
- 5.3.5. Middle East and Africa
- 5.1. Market Analysis, Insights and Forecast - by Product Type
- 6. North America Sodium Reduction Ingredients Industry Analysis, Insights and Forecast, 2019-2031
- 6.1. Market Analysis, Insights and Forecast - by Product Type
- 6.1.1. Amino Acids & Glutamates
- 6.1.2. Mineral Salts
- 6.1.2.1. Potassium Chloride
- 6.1.2.2. Magnesium Sulphate
- 6.1.2.3. Potassium Lactate
- 6.1.2.4. Calcium Chloride
- 6.1.3. Yeast Extracts
- 6.1.4. Others
- 6.2. Market Analysis, Insights and Forecast - by Application
- 6.2.1. Bakery & Confectionery
- 6.2.2. Condiments, Seasonings & Sauces
- 6.2.3. Dairy & Frozen Foods
- 6.2.4. Meat & Meat Products
- 6.2.5. Snacks
- 6.2.6. Others
- 6.1. Market Analysis, Insights and Forecast - by Product Type
- 7. Europe Sodium Reduction Ingredients Industry Analysis, Insights and Forecast, 2019-2031
- 7.1. Market Analysis, Insights and Forecast - by Product Type
- 7.1.1. Amino Acids & Glutamates
- 7.1.2. Mineral Salts
- 7.1.2.1. Potassium Chloride
- 7.1.2.2. Magnesium Sulphate
- 7.1.2.3. Potassium Lactate
- 7.1.2.4. Calcium Chloride
- 7.1.3. Yeast Extracts
- 7.1.4. Others
- 7.2. Market Analysis, Insights and Forecast - by Application
- 7.2.1. Bakery & Confectionery
- 7.2.2. Condiments, Seasonings & Sauces
- 7.2.3. Dairy & Frozen Foods
- 7.2.4. Meat & Meat Products
- 7.2.5. Snacks
- 7.2.6. Others
- 7.1. Market Analysis, Insights and Forecast - by Product Type
- 8. Asia Pacific Sodium Reduction Ingredients Industry Analysis, Insights and Forecast, 2019-2031
- 8.1. Market Analysis, Insights and Forecast - by Product Type
- 8.1.1. Amino Acids & Glutamates
- 8.1.2. Mineral Salts
- 8.1.2.1. Potassium Chloride
- 8.1.2.2. Magnesium Sulphate
- 8.1.2.3. Potassium Lactate
- 8.1.2.4. Calcium Chloride
- 8.1.3. Yeast Extracts
- 8.1.4. Others
- 8.2. Market Analysis, Insights and Forecast - by Application
- 8.2.1. Bakery & Confectionery
- 8.2.2. Condiments, Seasonings & Sauces
- 8.2.3. Dairy & Frozen Foods
- 8.2.4. Meat & Meat Products
- 8.2.5. Snacks
- 8.2.6. Others
- 8.1. Market Analysis, Insights and Forecast - by Product Type
- 9. South America Sodium Reduction Ingredients Industry Analysis, Insights and Forecast, 2019-2031
- 9.1. Market Analysis, Insights and Forecast - by Product Type
- 9.1.1. Amino Acids & Glutamates
- 9.1.2. Mineral Salts
- 9.1.2.1. Potassium Chloride
- 9.1.2.2. Magnesium Sulphate
- 9.1.2.3. Potassium Lactate
- 9.1.2.4. Calcium Chloride
- 9.1.3. Yeast Extracts
- 9.1.4. Others
- 9.2. Market Analysis, Insights and Forecast - by Application
- 9.2.1. Bakery & Confectionery
- 9.2.2. Condiments, Seasonings & Sauces
- 9.2.3. Dairy & Frozen Foods
- 9.2.4. Meat & Meat Products
- 9.2.5. Snacks
- 9.2.6. Others
- 9.1. Market Analysis, Insights and Forecast - by Product Type
- 10. Middle East and Africa Sodium Reduction Ingredients Industry Analysis, Insights and Forecast, 2019-2031
- 10.1. Market Analysis, Insights and Forecast - by Product Type
- 10.1.1. Amino Acids & Glutamates
- 10.1.2. Mineral Salts
- 10.1.2.1. Potassium Chloride
- 10.1.2.2. Magnesium Sulphate
- 10.1.2.3. Potassium Lactate
- 10.1.2.4. Calcium Chloride
- 10.1.3. Yeast Extracts
- 10.1.4. Others
- 10.2. Market Analysis, Insights and Forecast - by Application
- 10.2.1. Bakery & Confectionery
- 10.2.2. Condiments, Seasonings & Sauces
- 10.2.3. Dairy & Frozen Foods
- 10.2.4. Meat & Meat Products
- 10.2.5. Snacks
- 10.2.6. Others
- 10.1. Market Analysis, Insights and Forecast - by Product Type
- 11. North America Sodium Reduction Ingredients Industry Analysis, Insights and Forecast, 2019-2031
- 11.1. Market Analysis, Insights and Forecast - By Country/Sub-region
- 11.1.1 United States
- 11.1.2 Canada
- 11.1.3 Mexico
- 11.1.4 Rest of North America
- 12. Europe Sodium Reduction Ingredients Industry Analysis, Insights and Forecast, 2019-2031
- 12.1. Market Analysis, Insights and Forecast - By Country/Sub-region
- 12.1.1 United Kingdom
- 12.1.2 Germany
- 12.1.3 France
- 12.1.4 Russia
- 12.1.5 Italy
- 12.1.6 Spain
- 12.1.7 Rest of Europe
- 13. Asia Pacific Sodium Reduction Ingredients Industry Analysis, Insights and Forecast, 2019-2031
- 13.1. Market Analysis, Insights and Forecast - By Country/Sub-region
- 13.1.1 India
- 13.1.2 China
- 13.1.3 Japan
- 13.1.4 Australia
- 13.1.5 Rest of Asia Pacific
- 14. South America Sodium Reduction Ingredients Industry Analysis, Insights and Forecast, 2019-2031
- 14.1. Market Analysis, Insights and Forecast - By Country/Sub-region
- 14.1.1 Brazil
- 14.1.2 Argentina
- 14.1.3 Rest of South America
- 15. Middle East and Africa Sodium Reduction Ingredients Industry Analysis, Insights and Forecast, 2019-2031
- 15.1. Market Analysis, Insights and Forecast - By Country/Sub-region
- 15.1.1 South Africa
- 15.1.2 Saudi Arabia
- 15.1.3 Rest of Middle East and Africa
- 16. Competitive Analysis
- 16.1. Global Market Share Analysis 2024
- 16.2. Company Profiles
- 16.2.1 AngelYeast Co Ltd
- 16.2.1.1. Overview
- 16.2.1.2. Products
- 16.2.1.3. SWOT Analysis
- 16.2.1.4. Recent Developments
- 16.2.1.5. Financials (Based on Availability)
- 16.2.2 Givaudan
- 16.2.2.1. Overview
- 16.2.2.2. Products
- 16.2.2.3. SWOT Analysis
- 16.2.2.4. Recent Developments
- 16.2.2.5. Financials (Based on Availability)
- 16.2.3 Angel Yeast Co Ltd*List Not Exhaustive
- 16.2.3.1. Overview
- 16.2.3.2. Products
- 16.2.3.3. SWOT Analysis
- 16.2.3.4. Recent Developments
- 16.2.3.5. Financials (Based on Availability)
- 16.2.4 Royal DSM N V
- 16.2.4.1. Overview
- 16.2.4.2. Products
- 16.2.4.3. SWOT Analysis
- 16.2.4.4. Recent Developments
- 16.2.4.5. Financials (Based on Availability)
- 16.2.5 K+S Kali GMBH
- 16.2.5.1. Overview
- 16.2.5.2. Products
- 16.2.5.3. SWOT Analysis
- 16.2.5.4. Recent Developments
- 16.2.5.5. Financials (Based on Availability)
- 16.2.6 Advanced Food Systems Inc
- 16.2.6.1. Overview
- 16.2.6.2. Products
- 16.2.6.3. SWOT Analysis
- 16.2.6.4. Recent Developments
- 16.2.6.5. Financials (Based on Availability)
- 16.2.7 Kerry Group Plc
- 16.2.7.1. Overview
- 16.2.7.2. Products
- 16.2.7.3. SWOT Analysis
- 16.2.7.4. Recent Developments
- 16.2.7.5. Financials (Based on Availability)
- 16.2.8 DuPont
- 16.2.8.1. Overview
- 16.2.8.2. Products
- 16.2.8.3. SWOT Analysis
- 16.2.8.4. Recent Developments
- 16.2.8.5. Financials (Based on Availability)
- 16.2.9 Dr Paul Lohmann GmbH & Co KGaA
- 16.2.9.1. Overview
- 16.2.9.2. Products
- 16.2.9.3. SWOT Analysis
- 16.2.9.4. Recent Developments
- 16.2.9.5. Financials (Based on Availability)
- 16.2.10 Cargill Inc
- 16.2.10.1. Overview
- 16.2.10.2. Products
- 16.2.10.3. SWOT Analysis
- 16.2.10.4. Recent Developments
- 16.2.10.5. Financials (Based on Availability)
- 16.2.1 AngelYeast Co Ltd
List of Figures
- Figure 1: Global Sodium Reduction Ingredients Industry Revenue Breakdown (Million, %) by Region 2024 & 2032
- Figure 2: North America Sodium Reduction Ingredients Industry Revenue (Million), by Country 2024 & 2032
- Figure 3: North America Sodium Reduction Ingredients Industry Revenue Share (%), by Country 2024 & 2032
- Figure 4: Europe Sodium Reduction Ingredients Industry Revenue (Million), by Country 2024 & 2032
- Figure 5: Europe Sodium Reduction Ingredients Industry Revenue Share (%), by Country 2024 & 2032
- Figure 6: Asia Pacific Sodium Reduction Ingredients Industry Revenue (Million), by Country 2024 & 2032
- Figure 7: Asia Pacific Sodium Reduction Ingredients Industry Revenue Share (%), by Country 2024 & 2032
- Figure 8: South America Sodium Reduction Ingredients Industry Revenue (Million), by Country 2024 & 2032
- Figure 9: South America Sodium Reduction Ingredients Industry Revenue Share (%), by Country 2024 & 2032
- Figure 10: Middle East and Africa Sodium Reduction Ingredients Industry Revenue (Million), by Country 2024 & 2032
- Figure 11: Middle East and Africa Sodium Reduction Ingredients Industry Revenue Share (%), by Country 2024 & 2032
- Figure 12: North America Sodium Reduction Ingredients Industry Revenue (Million), by Product Type 2024 & 2032
- Figure 13: North America Sodium Reduction Ingredients Industry Revenue Share (%), by Product Type 2024 & 2032
- Figure 14: North America Sodium Reduction Ingredients Industry Revenue (Million), by Application 2024 & 2032
- Figure 15: North America Sodium Reduction Ingredients Industry Revenue Share (%), by Application 2024 & 2032
- Figure 16: North America Sodium Reduction Ingredients Industry Revenue (Million), by Country 2024 & 2032
- Figure 17: North America Sodium Reduction Ingredients Industry Revenue Share (%), by Country 2024 & 2032
- Figure 18: Europe Sodium Reduction Ingredients Industry Revenue (Million), by Product Type 2024 & 2032
- Figure 19: Europe Sodium Reduction Ingredients Industry Revenue Share (%), by Product Type 2024 & 2032
- Figure 20: Europe Sodium Reduction Ingredients Industry Revenue (Million), by Application 2024 & 2032
- Figure 21: Europe Sodium Reduction Ingredients Industry Revenue Share (%), by Application 2024 & 2032
- Figure 22: Europe Sodium Reduction Ingredients Industry Revenue (Million), by Country 2024 & 2032
- Figure 23: Europe Sodium Reduction Ingredients Industry Revenue Share (%), by Country 2024 & 2032
- Figure 24: Asia Pacific Sodium Reduction Ingredients Industry Revenue (Million), by Product Type 2024 & 2032
- Figure 25: Asia Pacific Sodium Reduction Ingredients Industry Revenue Share (%), by Product Type 2024 & 2032
- Figure 26: Asia Pacific Sodium Reduction Ingredients Industry Revenue (Million), by Application 2024 & 2032
- Figure 27: Asia Pacific Sodium Reduction Ingredients Industry Revenue Share (%), by Application 2024 & 2032
- Figure 28: Asia Pacific Sodium Reduction Ingredients Industry Revenue (Million), by Country 2024 & 2032
- Figure 29: Asia Pacific Sodium Reduction Ingredients Industry Revenue Share (%), by Country 2024 & 2032
- Figure 30: South America Sodium Reduction Ingredients Industry Revenue (Million), by Product Type 2024 & 2032
- Figure 31: South America Sodium Reduction Ingredients Industry Revenue Share (%), by Product Type 2024 & 2032
- Figure 32: South America Sodium Reduction Ingredients Industry Revenue (Million), by Application 2024 & 2032
- Figure 33: South America Sodium Reduction Ingredients Industry Revenue Share (%), by Application 2024 & 2032
- Figure 34: South America Sodium Reduction Ingredients Industry Revenue (Million), by Country 2024 & 2032
- Figure 35: South America Sodium Reduction Ingredients Industry Revenue Share (%), by Country 2024 & 2032
- Figure 36: Middle East and Africa Sodium Reduction Ingredients Industry Revenue (Million), by Product Type 2024 & 2032
- Figure 37: Middle East and Africa Sodium Reduction Ingredients Industry Revenue Share (%), by Product Type 2024 & 2032
- Figure 38: Middle East and Africa Sodium Reduction Ingredients Industry Revenue (Million), by Application 2024 & 2032
- Figure 39: Middle East and Africa Sodium Reduction Ingredients Industry Revenue Share (%), by Application 2024 & 2032
- Figure 40: Middle East and Africa Sodium Reduction Ingredients Industry Revenue (Million), by Country 2024 & 2032
- Figure 41: Middle East and Africa Sodium Reduction Ingredients Industry Revenue Share (%), by Country 2024 & 2032
List of Tables
- Table 1: Global Sodium Reduction Ingredients Industry Revenue Million Forecast, by Region 2019 & 2032
- Table 2: Global Sodium Reduction Ingredients Industry Revenue Million Forecast, by Product Type 2019 & 2032
- Table 3: Global Sodium Reduction Ingredients Industry Revenue Million Forecast, by Application 2019 & 2032
- Table 4: Global Sodium Reduction Ingredients Industry Revenue Million Forecast, by Region 2019 & 2032
- Table 5: Global Sodium Reduction Ingredients Industry Revenue Million Forecast, by Country 2019 & 2032
- Table 6: United States Sodium Reduction Ingredients Industry Revenue (Million) Forecast, by Application 2019 & 2032
- Table 7: Canada Sodium Reduction Ingredients Industry Revenue (Million) Forecast, by Application 2019 & 2032
- Table 8: Mexico Sodium Reduction Ingredients Industry Revenue (Million) Forecast, by Application 2019 & 2032
- Table 9: Rest of North America Sodium Reduction Ingredients Industry Revenue (Million) Forecast, by Application 2019 & 2032
- Table 10: Global Sodium Reduction Ingredients Industry Revenue Million Forecast, by Country 2019 & 2032
- Table 11: United Kingdom Sodium Reduction Ingredients Industry Revenue (Million) Forecast, by Application 2019 & 2032
- Table 12: Germany Sodium Reduction Ingredients Industry Revenue (Million) Forecast, by Application 2019 & 2032
- Table 13: France Sodium Reduction Ingredients Industry Revenue (Million) Forecast, by Application 2019 & 2032
- Table 14: Russia Sodium Reduction Ingredients Industry Revenue (Million) Forecast, by Application 2019 & 2032
- Table 15: Italy Sodium Reduction Ingredients Industry Revenue (Million) Forecast, by Application 2019 & 2032
- Table 16: Spain Sodium Reduction Ingredients Industry Revenue (Million) Forecast, by Application 2019 & 2032
- Table 17: Rest of Europe Sodium Reduction Ingredients Industry Revenue (Million) Forecast, by Application 2019 & 2032
- Table 18: Global Sodium Reduction Ingredients Industry Revenue Million Forecast, by Country 2019 & 2032
- Table 19: India Sodium Reduction Ingredients Industry Revenue (Million) Forecast, by Application 2019 & 2032
- Table 20: China Sodium Reduction Ingredients Industry Revenue (Million) Forecast, by Application 2019 & 2032
- Table 21: Japan Sodium Reduction Ingredients Industry Revenue (Million) Forecast, by Application 2019 & 2032
- Table 22: Australia Sodium Reduction Ingredients Industry Revenue (Million) Forecast, by Application 2019 & 2032
- Table 23: Rest of Asia Pacific Sodium Reduction Ingredients Industry Revenue (Million) Forecast, by Application 2019 & 2032
- Table 24: Global Sodium Reduction Ingredients Industry Revenue Million Forecast, by Country 2019 & 2032
- Table 25: Brazil Sodium Reduction Ingredients Industry Revenue (Million) Forecast, by Application 2019 & 2032
- Table 26: Argentina Sodium Reduction Ingredients Industry Revenue (Million) Forecast, by Application 2019 & 2032
- Table 27: Rest of South America Sodium Reduction Ingredients Industry Revenue (Million) Forecast, by Application 2019 & 2032
- Table 28: Global Sodium Reduction Ingredients Industry Revenue Million Forecast, by Country 2019 & 2032
- Table 29: South Africa Sodium Reduction Ingredients Industry Revenue (Million) Forecast, by Application 2019 & 2032
- Table 30: Saudi Arabia Sodium Reduction Ingredients Industry Revenue (Million) Forecast, by Application 2019 & 2032
- Table 31: Rest of Middle East and Africa Sodium Reduction Ingredients Industry Revenue (Million) Forecast, by Application 2019 & 2032
- Table 32: Global Sodium Reduction Ingredients Industry Revenue Million Forecast, by Product Type 2019 & 2032
- Table 33: Global Sodium Reduction Ingredients Industry Revenue Million Forecast, by Application 2019 & 2032
- Table 34: Global Sodium Reduction Ingredients Industry Revenue Million Forecast, by Country 2019 & 2032
- Table 35: United States Sodium Reduction Ingredients Industry Revenue (Million) Forecast, by Application 2019 & 2032
- Table 36: Canada Sodium Reduction Ingredients Industry Revenue (Million) Forecast, by Application 2019 & 2032
- Table 37: Mexico Sodium Reduction Ingredients Industry Revenue (Million) Forecast, by Application 2019 & 2032
- Table 38: Rest of North America Sodium Reduction Ingredients Industry Revenue (Million) Forecast, by Application 2019 & 2032
- Table 39: Global Sodium Reduction Ingredients Industry Revenue Million Forecast, by Product Type 2019 & 2032
- Table 40: Global Sodium Reduction Ingredients Industry Revenue Million Forecast, by Application 2019 & 2032
- Table 41: Global Sodium Reduction Ingredients Industry Revenue Million Forecast, by Country 2019 & 2032
- Table 42: United Kingdom Sodium Reduction Ingredients Industry Revenue (Million) Forecast, by Application 2019 & 2032
- Table 43: Germany Sodium Reduction Ingredients Industry Revenue (Million) Forecast, by Application 2019 & 2032
- Table 44: France Sodium Reduction Ingredients Industry Revenue (Million) Forecast, by Application 2019 & 2032
- Table 45: Russia Sodium Reduction Ingredients Industry Revenue (Million) Forecast, by Application 2019 & 2032
- Table 46: Italy Sodium Reduction Ingredients Industry Revenue (Million) Forecast, by Application 2019 & 2032
- Table 47: Spain Sodium Reduction Ingredients Industry Revenue (Million) Forecast, by Application 2019 & 2032
- Table 48: Rest of Europe Sodium Reduction Ingredients Industry Revenue (Million) Forecast, by Application 2019 & 2032
- Table 49: Global Sodium Reduction Ingredients Industry Revenue Million Forecast, by Product Type 2019 & 2032
- Table 50: Global Sodium Reduction Ingredients Industry Revenue Million Forecast, by Application 2019 & 2032
- Table 51: Global Sodium Reduction Ingredients Industry Revenue Million Forecast, by Country 2019 & 2032
- Table 52: India Sodium Reduction Ingredients Industry Revenue (Million) Forecast, by Application 2019 & 2032
- Table 53: China Sodium Reduction Ingredients Industry Revenue (Million) Forecast, by Application 2019 & 2032
- Table 54: Japan Sodium Reduction Ingredients Industry Revenue (Million) Forecast, by Application 2019 & 2032
- Table 55: Australia Sodium Reduction Ingredients Industry Revenue (Million) Forecast, by Application 2019 & 2032
- Table 56: Rest of Asia Pacific Sodium Reduction Ingredients Industry Revenue (Million) Forecast, by Application 2019 & 2032
- Table 57: Global Sodium Reduction Ingredients Industry Revenue Million Forecast, by Product Type 2019 & 2032
- Table 58: Global Sodium Reduction Ingredients Industry Revenue Million Forecast, by Application 2019 & 2032
- Table 59: Global Sodium Reduction Ingredients Industry Revenue Million Forecast, by Country 2019 & 2032
- Table 60: Brazil Sodium Reduction Ingredients Industry Revenue (Million) Forecast, by Application 2019 & 2032
- Table 61: Argentina Sodium Reduction Ingredients Industry Revenue (Million) Forecast, by Application 2019 & 2032
- Table 62: Rest of South America Sodium Reduction Ingredients Industry Revenue (Million) Forecast, by Application 2019 & 2032
- Table 63: Global Sodium Reduction Ingredients Industry Revenue Million Forecast, by Product Type 2019 & 2032
- Table 64: Global Sodium Reduction Ingredients Industry Revenue Million Forecast, by Application 2019 & 2032
- Table 65: Global Sodium Reduction Ingredients Industry Revenue Million Forecast, by Country 2019 & 2032
- Table 66: South Africa Sodium Reduction Ingredients Industry Revenue (Million) Forecast, by Application 2019 & 2032
- Table 67: Saudi Arabia Sodium Reduction Ingredients Industry Revenue (Million) Forecast, by Application 2019 & 2032
- Table 68: Rest of Middle East and Africa Sodium Reduction Ingredients Industry Revenue (Million) Forecast, by Application 2019 & 2032
Frequently Asked Questions
1. What is the projected Compound Annual Growth Rate (CAGR) of the Sodium Reduction Ingredients Industry?
The projected CAGR is approximately 11.71%.
2. Which companies are prominent players in the Sodium Reduction Ingredients Industry?
Key companies in the market include AngelYeast Co Ltd, Givaudan, Angel Yeast Co Ltd*List Not Exhaustive, Royal DSM N V, K+S Kali GMBH, Advanced Food Systems Inc, Kerry Group Plc, DuPont, Dr Paul Lohmann GmbH & Co KGaA, Cargill Inc.
3. What are the main segments of the Sodium Reduction Ingredients Industry?
The market segments include Product Type, Application.
4. Can you provide details about the market size?
The market size is estimated to be USD XX Million as of 2022.
5. What are some drivers contributing to market growth?
Increasing Focus on Maintaining Health and Well-Being; Launching Supplements For Specific Purposes and Targeted Population.
6. What are the notable trends driving market growth?
Growing Consumer Awareness Toward High Sodium Intake.
7. Are there any restraints impacting market growth?
Supplement Consumption and Their Side-effects; Inclination Towards Substitute Products.
8. Can you provide examples of recent developments in the market?
In 2021, Cargill Salt launched a new purified sea salt flour. The ingredient is a unique type of ultra-fine cut, powder-like sodium chloride. It is suitable for blending applications that require perfect sizing, including dry soup, cereal, flour, spice mixes, and topping snack foods.
9. What pricing options are available for accessing the report?
Pricing options include single-user, multi-user, and enterprise licenses priced at USD 4750, USD 5250, and USD 8750 respectively.
10. Is the market size provided in terms of value or volume?
The market size is provided in terms of value, measured in Million.
11. Are there any specific market keywords associated with the report?
Yes, the market keyword associated with the report is "Sodium Reduction Ingredients Industry," which aids in identifying and referencing the specific market segment covered.
12. How do I determine which pricing option suits my needs best?
The pricing options vary based on user requirements and access needs. Individual users may opt for single-user licenses, while businesses requiring broader access may choose multi-user or enterprise licenses for cost-effective access to the report.
13. Are there any additional resources or data provided in the Sodium Reduction Ingredients Industry report?
While the report offers comprehensive insights, it's advisable to review the specific contents or supplementary materials provided to ascertain if additional resources or data are available.
14. How can I stay updated on further developments or reports in the Sodium Reduction Ingredients Industry?
To stay informed about further developments, trends, and reports in the Sodium Reduction Ingredients Industry, consider subscribing to industry newsletters, following relevant companies and organizations, or regularly checking reputable industry news sources and publications.
Methodology
Step 1 - Identification of Relevant Samples Size from Population Database


Step 2 - Approaches for Defining Global Market Size (Value, Volume* & Price*)

Note*: In applicable scenarios
Step 3 - Data Sources
Primary Research
- Web Analytics
- Survey Reports
- Research Institute
- Latest Research Reports
- Opinion Leaders
Secondary Research
- Annual Reports
- White Paper
- Latest Press Release
- Industry Association
- Paid Database
- Investor Presentations

Step 4 - Data Triangulation
Involves using different sources of information in order to increase the validity of a study
These sources are likely to be stakeholders in a program - participants, other researchers, program staff, other community members, and so on.
Then we put all data in single framework & apply various statistical tools to find out the dynamic on the market.
During the analysis stage, feedback from the stakeholder groups would be compared to determine areas of agreement as well as areas of divergence
