

Key Insights
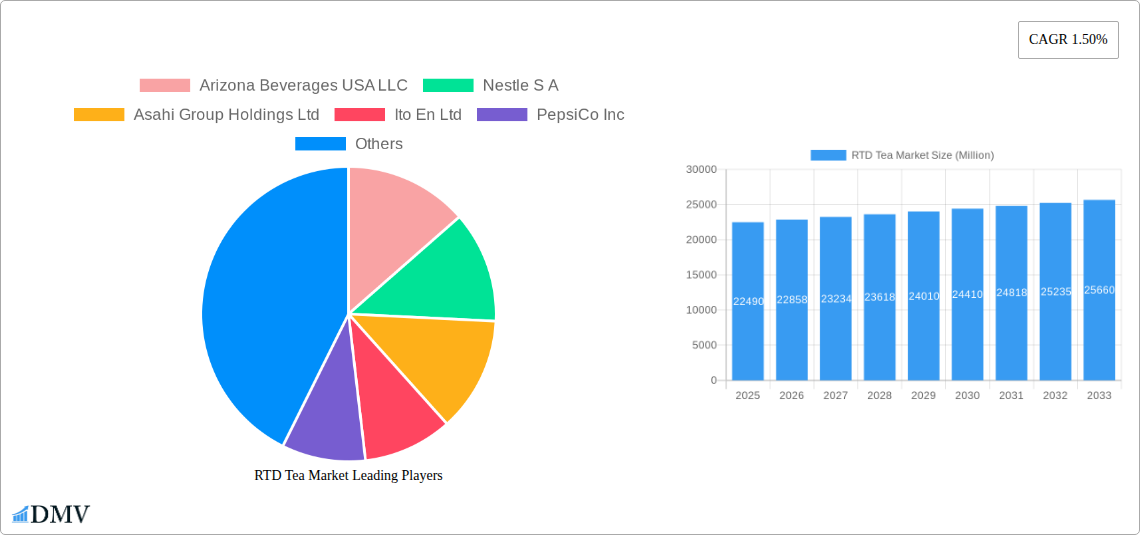
The Ready-to-Drink (RTD) tea market, currently valued at $22,490 million (2025), is projected to experience steady growth, driven by increasing health consciousness and the rising popularity of convenient beverage options. The market's Compound Annual Growth Rate (CAGR) of 1.5% from 2019 to 2024 suggests a consistent, albeit moderate, expansion. Key drivers include the growing demand for functional beverages with natural ingredients, the expanding presence of premium and specialty teas, and the increasing adoption of innovative packaging formats like aseptic packages and PET bottles catering to on-the-go consumption. Consumer preference is shifting towards healthier alternatives to sugary soft drinks, further fueling the RTD tea market's growth. Market segmentation reveals that green tea, herbal tea, and iced tea dominate the soft drink type segment, with aseptic packages and PET bottles leading in packaging. Distribution channels are split between off-trade (retail stores, supermarkets) and on-trade (restaurants, cafes), with the off-trade segment likely holding a larger share. Competition is fierce, with major players like Coca-Cola, PepsiCo, Nestle, and Unilever vying for market dominance through product innovation, brand building, and strategic acquisitions. Geographic expansion into emerging markets with growing middle classes, particularly in Asia-Pacific, offers significant opportunities for future growth. However, price fluctuations in raw materials and intense competition could potentially constrain market growth.
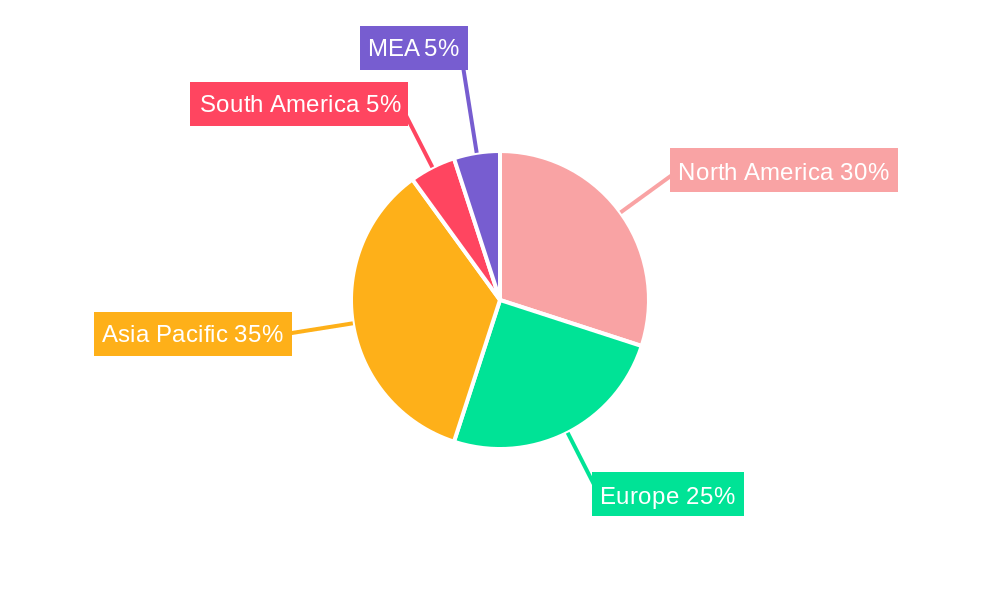
Regional variations in market size and growth rate are expected, with Asia-Pacific likely showcasing the most substantial growth, driven by the large and expanding population bases in countries like China and India. North America and Europe, although mature markets, will likely demonstrate stable growth, driven by premiumization and the introduction of novel tea-based products. The market's future trajectory hinges on maintaining sustainable sourcing of tea leaves, addressing concerns related to sugar content in some products, and continuing to innovate in packaging and flavors to appeal to evolving consumer preferences. The sustained focus on health and wellness, coupled with convenient packaging and diverse flavor profiles, will be crucial for future success in this competitive landscape.
RTD Tea Market: A Comprehensive Report (2019-2033)
This insightful report provides a detailed analysis of the Ready-to-Drink (RTD) Tea market, encompassing its current state, future projections, and key players. Covering the period from 2019 to 2033, with a base year of 2025 and a forecast period of 2025-2033, this study offers invaluable data for stakeholders seeking to navigate this dynamic market. The report utilizes a robust methodology, incorporating historical data (2019-2024) and projecting future trends based on in-depth market research and analysis. The global RTD Tea market is projected to reach xx Million by 2033.
RTD Tea Market Composition & Trends
This section delves into the intricate composition of the RTD tea market, analyzing market concentration, innovation drivers, regulatory landscapes, substitute products, end-user profiles, and merger & acquisition (M&A) activities. We examine the distribution of market share amongst key players such as Arizona Beverages USA LLC, Nestle S.A., and PepsiCo Inc., providing a comprehensive overview of the competitive landscape. The report also explores the impact of regulatory changes and evolving consumer preferences on market dynamics.
- Market Concentration: The RTD tea market exhibits a moderately concentrated structure, with the top 5 players holding an estimated xx% market share in 2024.
- Innovation Catalysts: Growing consumer demand for functional and healthier beverages fuels innovation in flavors, ingredients (e.g., functional mushrooms, adaptogens), and packaging.
- Regulatory Landscape: Government regulations concerning sugar content, labeling, and ingredient sourcing significantly impact market strategies.
- Substitute Products: Competition comes from other ready-to-drink beverages, including fruit juices, carbonated soft drinks, and bottled water.
- End-User Profiles: The primary end-users include individuals of all ages, with increasing demand from health-conscious consumers.
- M&A Activities: The RTD tea market has witnessed significant M&A activity in recent years, with deal values totaling approximately xx Million in 2024, driving consolidation and expansion. Key acquisitions are analyzed in detail.
RTD Tea Market Industry Evolution
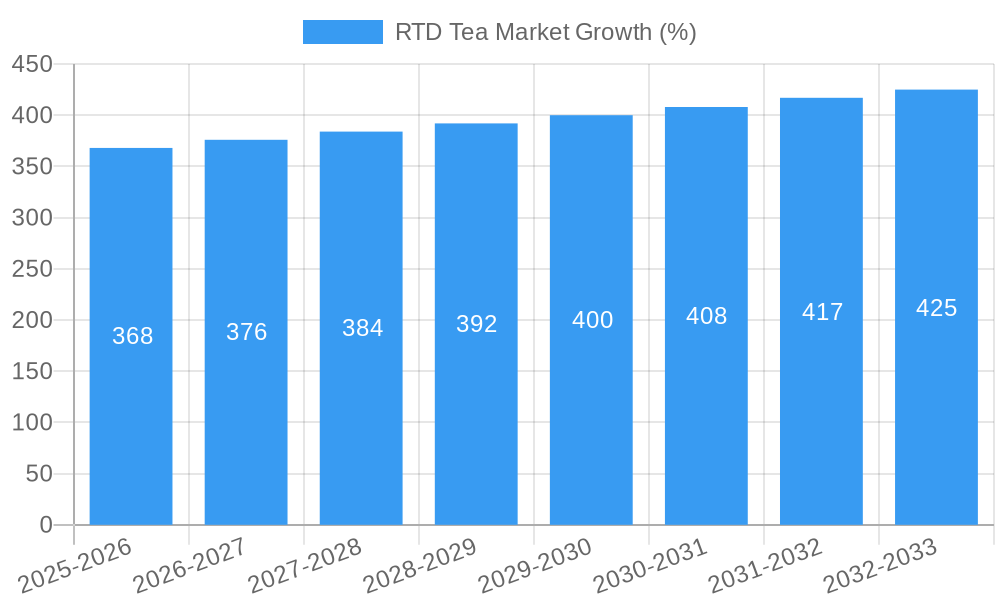
This section offers a detailed analysis of the RTD tea market's growth trajectory, technological advancements, and shifting consumer preferences during the period 2019-2033. We examine the factors driving market expansion, including changing lifestyles, increasing health awareness, and the introduction of innovative products. Growth rates are examined, showcasing periods of acceleration and deceleration, contextualized by external factors influencing the market, such as economic shifts and technological advancements. The adoption of new packaging technologies, such as sustainable and convenient options, is also scrutinized. The rising popularity of specific tea types, such as green tea and herbal tea, are analyzed, along with the impact on market segmentation. We also discuss the influence of marketing strategies and branding on consumer choices within this ever-evolving market.
Leading Regions, Countries, or Segments in RTD Tea Market
This section identifies the dominant regions, countries, and segments within the RTD tea market. We analyze key factors driving the dominance of specific segments, providing a detailed understanding of their market share and growth potential.
Dominant Segments:
- Packaging Type: PET Bottles currently holds the largest market share, driven by convenience and cost-effectiveness.
- Distribution Channel: Off-trade channels (retail stores, supermarkets) dominate, with the on-trade (restaurants, cafes) sector showing steady growth.
- Soft Drink Type: Iced tea remains the most popular segment, followed by green tea and herbal tea, reflecting diverse consumer preferences.
Key Drivers of Dominance:
- High consumer demand for convenience and portability fuels the dominance of PET bottles.
- Extensive distribution networks in developed and developing economies drive the dominance of off-trade channels.
- Health and wellness trends contribute to the rising popularity of green tea and herbal tea.
RTD Tea Market Product Innovations
The RTD tea market showcases continuous innovation, with new product launches focusing on unique flavors, functional ingredients, and convenient packaging. Companies are increasingly incorporating functional ingredients such as adaptogens and antioxidants to cater to the growing health-conscious consumer base. Technological advancements in packaging, such as aseptic packaging and sustainable materials, further enhance product appeal. These innovations contribute to the market's expansion and diversification.
Propelling Factors for RTD Tea Market Growth
Several factors propel the growth of the RTD tea market. These include the rising health consciousness among consumers, leading to increased demand for healthier beverage options. Technological advancements in packaging and processing enhance product shelf life and convenience. Favorable regulatory environments in some regions also support market expansion. Furthermore, increasing disposable incomes and changing lifestyles contribute to the growth of the RTD beverage sector.
Obstacles in the RTD Tea Market
Despite significant growth potential, the RTD tea market faces several challenges. Intense competition from other beverage categories, fluctuating raw material prices, and stringent regulatory compliance requirements present hurdles. Supply chain disruptions can also impact production and distribution, affecting market stability. Furthermore, evolving consumer preferences require constant product innovation to maintain market share. These challenges necessitate strategic planning and adaptation for market players.
Future Opportunities in RTD Tea Market
Future opportunities in the RTD tea market are abundant. Expanding into new markets, particularly in developing economies, offers significant growth potential. The development of innovative products incorporating functional ingredients and utilizing sustainable packaging presents exciting prospects. Catering to specific consumer segments, such as health-conscious individuals or those seeking specific functional benefits, also offers opportunities for market expansion.
Major Players in the RTD Tea Market Ecosystem
- Arizona Beverages USA LLC
- Nestle S.A.
- Asahi Group Holdings Ltd
- Ito En Ltd
- PepsiCo Inc
- Tata Consumer Products Ltd
- PT Anggada Putra Rekso Mulia
- Suntory Holdings Limited
- Keurig Dr Pepper Inc
- Tingyi (Cayman Islands) Holding Corporation
- The Coca-Cola Company
- Hangzhou Wahaha Group Co Ltd
- Uni-President Enterprises Corp
- Kirin Holdings Company Limited
- Thai Beverages PCL
- Reily Foods Company
- Sapporo Holdings Limited
Key Developments in RTD Tea Market Industry
- February 2024: Rockstar® Energy Drink (PepsiCo) launched "Rockstar Focus™," a new line of energy drinks with Lion's Mane mushroom and 200 mg of caffeine, expanding into the functional beverage market in Saudi Arabia, UAE, and Qatar.
- November 2023: The Coca-Cola Company's ChaiChun brand opened "The ChaiChun Store" in Delhi, expanding its retail presence in India.
- January 2023: Lipton Tea partnered with Full Cart (U.S. Hunger) to improve access to heart-friendly nutrition, demonstrating a commitment to social responsibility.
Strategic RTD Tea Market Forecast
The RTD tea market is poised for continued growth, driven by sustained demand for convenient and healthy beverages. Innovation in flavors, ingredients, and packaging will remain crucial for market success. Expanding into new geographical markets and tapping into evolving consumer preferences for functional and sustainable products will be key strategies for market players. The market is projected to experience robust growth in the coming years, presenting significant opportunities for investment and expansion.
RTD Tea Market Segmentation
-
1. Soft Drink Type
- 1.1. Green Tea
- 1.2. Herbal Tea
- 1.3. Iced Tea
- 1.4. Other RTD Tea
-
2. Packaging Type
- 2.1. Aseptic packages
- 2.2. Glass Bottles
- 2.3. Metal Can
- 2.4. PET Bottles
-
3. Distribution Channel
-
3.1. Off-trade
- 3.1.1. Convenience Stores
- 3.1.2. Online Retail
- 3.1.3. Supermarket/Hypermarket
- 3.1.4. Others
- 3.2. On-trade
-
3.1. Off-trade
RTD Tea Market Segmentation By Geography
-
1. North America
- 1.1. United States
- 1.2. Canada
- 1.3. Mexico
-
2. South America
- 2.1. Brazil
- 2.2. Argentina
- 2.3. Rest of South America
-
3. Europe
- 3.1. United Kingdom
- 3.2. Germany
- 3.3. France
- 3.4. Italy
- 3.5. Spain
- 3.6. Russia
- 3.7. Benelux
- 3.8. Nordics
- 3.9. Rest of Europe
-
4. Middle East & Africa
- 4.1. Turkey
- 4.2. Israel
- 4.3. GCC
- 4.4. North Africa
- 4.5. South Africa
- 4.6. Rest of Middle East & Africa
-
5. Asia Pacific
- 5.1. China
- 5.2. India
- 5.3. Japan
- 5.4. South Korea
- 5.5. ASEAN
- 5.6. Oceania
- 5.7. Rest of Asia Pacific
RTD Tea Market REPORT HIGHLIGHTS
| Aspects | Details |
|---|---|
| Study Period | 2019-2033 |
| Base Year | 2024 |
| Estimated Year | 2025 |
| Forecast Period | 2025-2033 |
| Historical Period | 2019-2024 |
| Growth Rate | CAGR of 1.50% from 2019-2033 |
| Segmentation |
|
Table of Contents
- 1. Introduction
- 1.1. Research Scope
- 1.2. Market Segmentation
- 1.3. Research Methodology
- 1.4. Definitions and Assumptions
- 2. Executive Summary
- 2.1. Introduction
- 3. Market Dynamics
- 3.1. Introduction
- 3.2. Market Drivers
- 3.2.1. Increasing demand for meat alternatives
- 3.3. Market Restrains
- 3.3.1. Presence of numerous alternatives in the plant proteins
- 3.4. Market Trends
- 3.4.1. OTHER KEY INDUSTRY TRENDS COVERED IN THE REPORT
- 4. Market Factor Analysis
- 4.1. Porters Five Forces
- 4.2. Supply/Value Chain
- 4.3. PESTEL analysis
- 4.4. Market Entropy
- 4.5. Patent/Trademark Analysis
- 5. Global RTD Tea Market Analysis, Insights and Forecast, 2019-2031
- 5.1. Market Analysis, Insights and Forecast - by Soft Drink Type
- 5.1.1. Green Tea
- 5.1.2. Herbal Tea
- 5.1.3. Iced Tea
- 5.1.4. Other RTD Tea
- 5.2. Market Analysis, Insights and Forecast - by Packaging Type
- 5.2.1. Aseptic packages
- 5.2.2. Glass Bottles
- 5.2.3. Metal Can
- 5.2.4. PET Bottles
- 5.3. Market Analysis, Insights and Forecast - by Distribution Channel
- 5.3.1. Off-trade
- 5.3.1.1. Convenience Stores
- 5.3.1.2. Online Retail
- 5.3.1.3. Supermarket/Hypermarket
- 5.3.1.4. Others
- 5.3.2. On-trade
- 5.3.1. Off-trade
- 5.4. Market Analysis, Insights and Forecast - by Region
- 5.4.1. North America
- 5.4.2. South America
- 5.4.3. Europe
- 5.4.4. Middle East & Africa
- 5.4.5. Asia Pacific
- 5.1. Market Analysis, Insights and Forecast - by Soft Drink Type
- 6. North America RTD Tea Market Analysis, Insights and Forecast, 2019-2031
- 6.1. Market Analysis, Insights and Forecast - by Soft Drink Type
- 6.1.1. Green Tea
- 6.1.2. Herbal Tea
- 6.1.3. Iced Tea
- 6.1.4. Other RTD Tea
- 6.2. Market Analysis, Insights and Forecast - by Packaging Type
- 6.2.1. Aseptic packages
- 6.2.2. Glass Bottles
- 6.2.3. Metal Can
- 6.2.4. PET Bottles
- 6.3. Market Analysis, Insights and Forecast - by Distribution Channel
- 6.3.1. Off-trade
- 6.3.1.1. Convenience Stores
- 6.3.1.2. Online Retail
- 6.3.1.3. Supermarket/Hypermarket
- 6.3.1.4. Others
- 6.3.2. On-trade
- 6.3.1. Off-trade
- 6.1. Market Analysis, Insights and Forecast - by Soft Drink Type
- 7. South America RTD Tea Market Analysis, Insights and Forecast, 2019-2031
- 7.1. Market Analysis, Insights and Forecast - by Soft Drink Type
- 7.1.1. Green Tea
- 7.1.2. Herbal Tea
- 7.1.3. Iced Tea
- 7.1.4. Other RTD Tea
- 7.2. Market Analysis, Insights and Forecast - by Packaging Type
- 7.2.1. Aseptic packages
- 7.2.2. Glass Bottles
- 7.2.3. Metal Can
- 7.2.4. PET Bottles
- 7.3. Market Analysis, Insights and Forecast - by Distribution Channel
- 7.3.1. Off-trade
- 7.3.1.1. Convenience Stores
- 7.3.1.2. Online Retail
- 7.3.1.3. Supermarket/Hypermarket
- 7.3.1.4. Others
- 7.3.2. On-trade
- 7.3.1. Off-trade
- 7.1. Market Analysis, Insights and Forecast - by Soft Drink Type
- 8. Europe RTD Tea Market Analysis, Insights and Forecast, 2019-2031
- 8.1. Market Analysis, Insights and Forecast - by Soft Drink Type
- 8.1.1. Green Tea
- 8.1.2. Herbal Tea
- 8.1.3. Iced Tea
- 8.1.4. Other RTD Tea
- 8.2. Market Analysis, Insights and Forecast - by Packaging Type
- 8.2.1. Aseptic packages
- 8.2.2. Glass Bottles
- 8.2.3. Metal Can
- 8.2.4. PET Bottles
- 8.3. Market Analysis, Insights and Forecast - by Distribution Channel
- 8.3.1. Off-trade
- 8.3.1.1. Convenience Stores
- 8.3.1.2. Online Retail
- 8.3.1.3. Supermarket/Hypermarket
- 8.3.1.4. Others
- 8.3.2. On-trade
- 8.3.1. Off-trade
- 8.1. Market Analysis, Insights and Forecast - by Soft Drink Type
- 9. Middle East & Africa RTD Tea Market Analysis, Insights and Forecast, 2019-2031
- 9.1. Market Analysis, Insights and Forecast - by Soft Drink Type
- 9.1.1. Green Tea
- 9.1.2. Herbal Tea
- 9.1.3. Iced Tea
- 9.1.4. Other RTD Tea
- 9.2. Market Analysis, Insights and Forecast - by Packaging Type
- 9.2.1. Aseptic packages
- 9.2.2. Glass Bottles
- 9.2.3. Metal Can
- 9.2.4. PET Bottles
- 9.3. Market Analysis, Insights and Forecast - by Distribution Channel
- 9.3.1. Off-trade
- 9.3.1.1. Convenience Stores
- 9.3.1.2. Online Retail
- 9.3.1.3. Supermarket/Hypermarket
- 9.3.1.4. Others
- 9.3.2. On-trade
- 9.3.1. Off-trade
- 9.1. Market Analysis, Insights and Forecast - by Soft Drink Type
- 10. Asia Pacific RTD Tea Market Analysis, Insights and Forecast, 2019-2031
- 10.1. Market Analysis, Insights and Forecast - by Soft Drink Type
- 10.1.1. Green Tea
- 10.1.2. Herbal Tea
- 10.1.3. Iced Tea
- 10.1.4. Other RTD Tea
- 10.2. Market Analysis, Insights and Forecast - by Packaging Type
- 10.2.1. Aseptic packages
- 10.2.2. Glass Bottles
- 10.2.3. Metal Can
- 10.2.4. PET Bottles
- 10.3. Market Analysis, Insights and Forecast - by Distribution Channel
- 10.3.1. Off-trade
- 10.3.1.1. Convenience Stores
- 10.3.1.2. Online Retail
- 10.3.1.3. Supermarket/Hypermarket
- 10.3.1.4. Others
- 10.3.2. On-trade
- 10.3.1. Off-trade
- 10.1. Market Analysis, Insights and Forecast - by Soft Drink Type
- 11. MEA RTD Tea Market Analysis, Insights and Forecast, 2019-2031
- 11.1. Market Analysis, Insights and Forecast - By Country/Sub-region
- 11.1.1 Middle East
- 11.1.2 Africa
- 12. South America RTD Tea Market Analysis, Insights and Forecast, 2019-2031
- 12.1. Market Analysis, Insights and Forecast - By Country/Sub-region
- 12.1.1 Brazil
- 12.1.2 Argentina
- 12.1.3 Rest of South America
- 13. Europe RTD Tea Market Analysis, Insights and Forecast, 2019-2031
- 13.1. Market Analysis, Insights and Forecast - By Country/Sub-region
- 13.1.1. Germany
- 14. Asia Pacific RTD Tea Market Analysis, Insights and Forecast, 2019-2031
- 14.1. Market Analysis, Insights and Forecast - By Country/Sub-region
- 14.1.1 China
- 14.1.2 Japan
- 14.1.3 India
- 14.1.4 South Korea
- 14.1.5 Taiwan
- 14.1.6 Australia
- 14.1.7 Rest of Asia-Pacific
- 15. North America RTD Tea Market Analysis, Insights and Forecast, 2019-2031
- 15.1. Market Analysis, Insights and Forecast - By Country/Sub-region
- 15.1.1. United States Canada Mexico
- 16. Competitive Analysis
- 16.1. Global Market Share Analysis 2024
- 16.2. Company Profiles
- 16.2.1 Arizona Beverages USA LLC
- 16.2.1.1. Overview
- 16.2.1.2. Products
- 16.2.1.3. SWOT Analysis
- 16.2.1.4. Recent Developments
- 16.2.1.5. Financials (Based on Availability)
- 16.2.2 Nestle S A
- 16.2.2.1. Overview
- 16.2.2.2. Products
- 16.2.2.3. SWOT Analysis
- 16.2.2.4. Recent Developments
- 16.2.2.5. Financials (Based on Availability)
- 16.2.3 Asahi Group Holdings Ltd
- 16.2.3.1. Overview
- 16.2.3.2. Products
- 16.2.3.3. SWOT Analysis
- 16.2.3.4. Recent Developments
- 16.2.3.5. Financials (Based on Availability)
- 16.2.4 Ito En Ltd
- 16.2.4.1. Overview
- 16.2.4.2. Products
- 16.2.4.3. SWOT Analysis
- 16.2.4.4. Recent Developments
- 16.2.4.5. Financials (Based on Availability)
- 16.2.5 PepsiCo Inc
- 16.2.5.1. Overview
- 16.2.5.2. Products
- 16.2.5.3. SWOT Analysis
- 16.2.5.4. Recent Developments
- 16.2.5.5. Financials (Based on Availability)
- 16.2.6 Tata Consumer Products Ltd
- 16.2.6.1. Overview
- 16.2.6.2. Products
- 16.2.6.3. SWOT Analysis
- 16.2.6.4. Recent Developments
- 16.2.6.5. Financials (Based on Availability)
- 16.2.7 PT Anggada Putra Rekso Mulia
- 16.2.7.1. Overview
- 16.2.7.2. Products
- 16.2.7.3. SWOT Analysis
- 16.2.7.4. Recent Developments
- 16.2.7.5. Financials (Based on Availability)
- 16.2.8 Suntory Holdings Limited
- 16.2.8.1. Overview
- 16.2.8.2. Products
- 16.2.8.3. SWOT Analysis
- 16.2.8.4. Recent Developments
- 16.2.8.5. Financials (Based on Availability)
- 16.2.9 Keurig Dr Pepper Inc
- 16.2.9.1. Overview
- 16.2.9.2. Products
- 16.2.9.3. SWOT Analysis
- 16.2.9.4. Recent Developments
- 16.2.9.5. Financials (Based on Availability)
- 16.2.10 Tingyi (Cayman Islands) Holding Corporation
- 16.2.10.1. Overview
- 16.2.10.2. Products
- 16.2.10.3. SWOT Analysis
- 16.2.10.4. Recent Developments
- 16.2.10.5. Financials (Based on Availability)
- 16.2.11 The Coca-Cola Company
- 16.2.11.1. Overview
- 16.2.11.2. Products
- 16.2.11.3. SWOT Analysis
- 16.2.11.4. Recent Developments
- 16.2.11.5. Financials (Based on Availability)
- 16.2.12 Hangzhou Wahaha Group Co Ltd
- 16.2.12.1. Overview
- 16.2.12.2. Products
- 16.2.12.3. SWOT Analysis
- 16.2.12.4. Recent Developments
- 16.2.12.5. Financials (Based on Availability)
- 16.2.13 Uni-President Enterprises Corp
- 16.2.13.1. Overview
- 16.2.13.2. Products
- 16.2.13.3. SWOT Analysis
- 16.2.13.4. Recent Developments
- 16.2.13.5. Financials (Based on Availability)
- 16.2.14 Kirin Holdings Company Limited
- 16.2.14.1. Overview
- 16.2.14.2. Products
- 16.2.14.3. SWOT Analysis
- 16.2.14.4. Recent Developments
- 16.2.14.5. Financials (Based on Availability)
- 16.2.15 Thai Beverages PCL
- 16.2.15.1. Overview
- 16.2.15.2. Products
- 16.2.15.3. SWOT Analysis
- 16.2.15.4. Recent Developments
- 16.2.15.5. Financials (Based on Availability)
- 16.2.16 Reily Foods Company
- 16.2.16.1. Overview
- 16.2.16.2. Products
- 16.2.16.3. SWOT Analysis
- 16.2.16.4. Recent Developments
- 16.2.16.5. Financials (Based on Availability)
- 16.2.17 Sapporo Holdings Limited
- 16.2.17.1. Overview
- 16.2.17.2. Products
- 16.2.17.3. SWOT Analysis
- 16.2.17.4. Recent Developments
- 16.2.17.5. Financials (Based on Availability)
- 16.2.1 Arizona Beverages USA LLC
List of Figures
- Figure 1: Global RTD Tea Market Revenue Breakdown (Million, %) by Region 2024 & 2032
- Figure 2: Global RTD Tea Market Volume Breakdown (K Tons, %) by Region 2024 & 2032
- Figure 3: MEA RTD Tea Market Revenue (Million), by Country 2024 & 2032
- Figure 4: MEA RTD Tea Market Volume (K Tons), by Country 2024 & 2032
- Figure 5: MEA RTD Tea Market Revenue Share (%), by Country 2024 & 2032
- Figure 6: MEA RTD Tea Market Volume Share (%), by Country 2024 & 2032
- Figure 7: South America RTD Tea Market Revenue (Million), by Country 2024 & 2032
- Figure 8: South America RTD Tea Market Volume (K Tons), by Country 2024 & 2032
- Figure 9: South America RTD Tea Market Revenue Share (%), by Country 2024 & 2032
- Figure 10: South America RTD Tea Market Volume Share (%), by Country 2024 & 2032
- Figure 11: Europe RTD Tea Market Revenue (Million), by Country 2024 & 2032
- Figure 12: Europe RTD Tea Market Volume (K Tons), by Country 2024 & 2032
- Figure 13: Europe RTD Tea Market Revenue Share (%), by Country 2024 & 2032
- Figure 14: Europe RTD Tea Market Volume Share (%), by Country 2024 & 2032
- Figure 15: Asia Pacific RTD Tea Market Revenue (Million), by Country 2024 & 2032
- Figure 16: Asia Pacific RTD Tea Market Volume (K Tons), by Country 2024 & 2032
- Figure 17: Asia Pacific RTD Tea Market Revenue Share (%), by Country 2024 & 2032
- Figure 18: Asia Pacific RTD Tea Market Volume Share (%), by Country 2024 & 2032
- Figure 19: North America RTD Tea Market Revenue (Million), by Country 2024 & 2032
- Figure 20: North America RTD Tea Market Volume (K Tons), by Country 2024 & 2032
- Figure 21: North America RTD Tea Market Revenue Share (%), by Country 2024 & 2032
- Figure 22: North America RTD Tea Market Volume Share (%), by Country 2024 & 2032
- Figure 23: North America RTD Tea Market Revenue (Million), by Soft Drink Type 2024 & 2032
- Figure 24: North America RTD Tea Market Volume (K Tons), by Soft Drink Type 2024 & 2032
- Figure 25: North America RTD Tea Market Revenue Share (%), by Soft Drink Type 2024 & 2032
- Figure 26: North America RTD Tea Market Volume Share (%), by Soft Drink Type 2024 & 2032
- Figure 27: North America RTD Tea Market Revenue (Million), by Packaging Type 2024 & 2032
- Figure 28: North America RTD Tea Market Volume (K Tons), by Packaging Type 2024 & 2032
- Figure 29: North America RTD Tea Market Revenue Share (%), by Packaging Type 2024 & 2032
- Figure 30: North America RTD Tea Market Volume Share (%), by Packaging Type 2024 & 2032
- Figure 31: North America RTD Tea Market Revenue (Million), by Distribution Channel 2024 & 2032
- Figure 32: North America RTD Tea Market Volume (K Tons), by Distribution Channel 2024 & 2032
- Figure 33: North America RTD Tea Market Revenue Share (%), by Distribution Channel 2024 & 2032
- Figure 34: North America RTD Tea Market Volume Share (%), by Distribution Channel 2024 & 2032
- Figure 35: North America RTD Tea Market Revenue (Million), by Country 2024 & 2032
- Figure 36: North America RTD Tea Market Volume (K Tons), by Country 2024 & 2032
- Figure 37: North America RTD Tea Market Revenue Share (%), by Country 2024 & 2032
- Figure 38: North America RTD Tea Market Volume Share (%), by Country 2024 & 2032
- Figure 39: South America RTD Tea Market Revenue (Million), by Soft Drink Type 2024 & 2032
- Figure 40: South America RTD Tea Market Volume (K Tons), by Soft Drink Type 2024 & 2032
- Figure 41: South America RTD Tea Market Revenue Share (%), by Soft Drink Type 2024 & 2032
- Figure 42: South America RTD Tea Market Volume Share (%), by Soft Drink Type 2024 & 2032
- Figure 43: South America RTD Tea Market Revenue (Million), by Packaging Type 2024 & 2032
- Figure 44: South America RTD Tea Market Volume (K Tons), by Packaging Type 2024 & 2032
- Figure 45: South America RTD Tea Market Revenue Share (%), by Packaging Type 2024 & 2032
- Figure 46: South America RTD Tea Market Volume Share (%), by Packaging Type 2024 & 2032
- Figure 47: South America RTD Tea Market Revenue (Million), by Distribution Channel 2024 & 2032
- Figure 48: South America RTD Tea Market Volume (K Tons), by Distribution Channel 2024 & 2032
- Figure 49: South America RTD Tea Market Revenue Share (%), by Distribution Channel 2024 & 2032
- Figure 50: South America RTD Tea Market Volume Share (%), by Distribution Channel 2024 & 2032
- Figure 51: South America RTD Tea Market Revenue (Million), by Country 2024 & 2032
- Figure 52: South America RTD Tea Market Volume (K Tons), by Country 2024 & 2032
- Figure 53: South America RTD Tea Market Revenue Share (%), by Country 2024 & 2032
- Figure 54: South America RTD Tea Market Volume Share (%), by Country 2024 & 2032
- Figure 55: Europe RTD Tea Market Revenue (Million), by Soft Drink Type 2024 & 2032
- Figure 56: Europe RTD Tea Market Volume (K Tons), by Soft Drink Type 2024 & 2032
- Figure 57: Europe RTD Tea Market Revenue Share (%), by Soft Drink Type 2024 & 2032
- Figure 58: Europe RTD Tea Market Volume Share (%), by Soft Drink Type 2024 & 2032
- Figure 59: Europe RTD Tea Market Revenue (Million), by Packaging Type 2024 & 2032
- Figure 60: Europe RTD Tea Market Volume (K Tons), by Packaging Type 2024 & 2032
- Figure 61: Europe RTD Tea Market Revenue Share (%), by Packaging Type 2024 & 2032
- Figure 62: Europe RTD Tea Market Volume Share (%), by Packaging Type 2024 & 2032
- Figure 63: Europe RTD Tea Market Revenue (Million), by Distribution Channel 2024 & 2032
- Figure 64: Europe RTD Tea Market Volume (K Tons), by Distribution Channel 2024 & 2032
- Figure 65: Europe RTD Tea Market Revenue Share (%), by Distribution Channel 2024 & 2032
- Figure 66: Europe RTD Tea Market Volume Share (%), by Distribution Channel 2024 & 2032
- Figure 67: Europe RTD Tea Market Revenue (Million), by Country 2024 & 2032
- Figure 68: Europe RTD Tea Market Volume (K Tons), by Country 2024 & 2032
- Figure 69: Europe RTD Tea Market Revenue Share (%), by Country 2024 & 2032
- Figure 70: Europe RTD Tea Market Volume Share (%), by Country 2024 & 2032
- Figure 71: Middle East & Africa RTD Tea Market Revenue (Million), by Soft Drink Type 2024 & 2032
- Figure 72: Middle East & Africa RTD Tea Market Volume (K Tons), by Soft Drink Type 2024 & 2032
- Figure 73: Middle East & Africa RTD Tea Market Revenue Share (%), by Soft Drink Type 2024 & 2032
- Figure 74: Middle East & Africa RTD Tea Market Volume Share (%), by Soft Drink Type 2024 & 2032
- Figure 75: Middle East & Africa RTD Tea Market Revenue (Million), by Packaging Type 2024 & 2032
- Figure 76: Middle East & Africa RTD Tea Market Volume (K Tons), by Packaging Type 2024 & 2032
- Figure 77: Middle East & Africa RTD Tea Market Revenue Share (%), by Packaging Type 2024 & 2032
- Figure 78: Middle East & Africa RTD Tea Market Volume Share (%), by Packaging Type 2024 & 2032
- Figure 79: Middle East & Africa RTD Tea Market Revenue (Million), by Distribution Channel 2024 & 2032
- Figure 80: Middle East & Africa RTD Tea Market Volume (K Tons), by Distribution Channel 2024 & 2032
- Figure 81: Middle East & Africa RTD Tea Market Revenue Share (%), by Distribution Channel 2024 & 2032
- Figure 82: Middle East & Africa RTD Tea Market Volume Share (%), by Distribution Channel 2024 & 2032
- Figure 83: Middle East & Africa RTD Tea Market Revenue (Million), by Country 2024 & 2032
- Figure 84: Middle East & Africa RTD Tea Market Volume (K Tons), by Country 2024 & 2032
- Figure 85: Middle East & Africa RTD Tea Market Revenue Share (%), by Country 2024 & 2032
- Figure 86: Middle East & Africa RTD Tea Market Volume Share (%), by Country 2024 & 2032
- Figure 87: Asia Pacific RTD Tea Market Revenue (Million), by Soft Drink Type 2024 & 2032
- Figure 88: Asia Pacific RTD Tea Market Volume (K Tons), by Soft Drink Type 2024 & 2032
- Figure 89: Asia Pacific RTD Tea Market Revenue Share (%), by Soft Drink Type 2024 & 2032
- Figure 90: Asia Pacific RTD Tea Market Volume Share (%), by Soft Drink Type 2024 & 2032
- Figure 91: Asia Pacific RTD Tea Market Revenue (Million), by Packaging Type 2024 & 2032
- Figure 92: Asia Pacific RTD Tea Market Volume (K Tons), by Packaging Type 2024 & 2032
- Figure 93: Asia Pacific RTD Tea Market Revenue Share (%), by Packaging Type 2024 & 2032
- Figure 94: Asia Pacific RTD Tea Market Volume Share (%), by Packaging Type 2024 & 2032
- Figure 95: Asia Pacific RTD Tea Market Revenue (Million), by Distribution Channel 2024 & 2032
- Figure 96: Asia Pacific RTD Tea Market Volume (K Tons), by Distribution Channel 2024 & 2032
- Figure 97: Asia Pacific RTD Tea Market Revenue Share (%), by Distribution Channel 2024 & 2032
- Figure 98: Asia Pacific RTD Tea Market Volume Share (%), by Distribution Channel 2024 & 2032
- Figure 99: Asia Pacific RTD Tea Market Revenue (Million), by Country 2024 & 2032
- Figure 100: Asia Pacific RTD Tea Market Volume (K Tons), by Country 2024 & 2032
- Figure 101: Asia Pacific RTD Tea Market Revenue Share (%), by Country 2024 & 2032
- Figure 102: Asia Pacific RTD Tea Market Volume Share (%), by Country 2024 & 2032
List of Tables
- Table 1: Global RTD Tea Market Revenue Million Forecast, by Region 2019 & 2032
- Table 2: Global RTD Tea Market Volume K Tons Forecast, by Region 2019 & 2032
- Table 3: Global RTD Tea Market Revenue Million Forecast, by Soft Drink Type 2019 & 2032
- Table 4: Global RTD Tea Market Volume K Tons Forecast, by Soft Drink Type 2019 & 2032
- Table 5: Global RTD Tea Market Revenue Million Forecast, by Packaging Type 2019 & 2032
- Table 6: Global RTD Tea Market Volume K Tons Forecast, by Packaging Type 2019 & 2032
- Table 7: Global RTD Tea Market Revenue Million Forecast, by Distribution Channel 2019 & 2032
- Table 8: Global RTD Tea Market Volume K Tons Forecast, by Distribution Channel 2019 & 2032
- Table 9: Global RTD Tea Market Revenue Million Forecast, by Region 2019 & 2032
- Table 10: Global RTD Tea Market Volume K Tons Forecast, by Region 2019 & 2032
- Table 11: Global RTD Tea Market Revenue Million Forecast, by Country 2019 & 2032
- Table 12: Global RTD Tea Market Volume K Tons Forecast, by Country 2019 & 2032
- Table 13: Middle East RTD Tea Market Revenue (Million) Forecast, by Application 2019 & 2032
- Table 14: Middle East RTD Tea Market Volume (K Tons) Forecast, by Application 2019 & 2032
- Table 15: Africa RTD Tea Market Revenue (Million) Forecast, by Application 2019 & 2032
- Table 16: Africa RTD Tea Market Volume (K Tons) Forecast, by Application 2019 & 2032
- Table 17: Global RTD Tea Market Revenue Million Forecast, by Country 2019 & 2032
- Table 18: Global RTD Tea Market Volume K Tons Forecast, by Country 2019 & 2032
- Table 19: Brazil RTD Tea Market Revenue (Million) Forecast, by Application 2019 & 2032
- Table 20: Brazil RTD Tea Market Volume (K Tons) Forecast, by Application 2019 & 2032
- Table 21: Argentina RTD Tea Market Revenue (Million) Forecast, by Application 2019 & 2032
- Table 22: Argentina RTD Tea Market Volume (K Tons) Forecast, by Application 2019 & 2032
- Table 23: Rest of South America RTD Tea Market Revenue (Million) Forecast, by Application 2019 & 2032
- Table 24: Rest of South America RTD Tea Market Volume (K Tons) Forecast, by Application 2019 & 2032
- Table 25: Global RTD Tea Market Revenue Million Forecast, by Country 2019 & 2032
- Table 26: Global RTD Tea Market Volume K Tons Forecast, by Country 2019 & 2032
- Table 27: Germany RTD Tea Market Revenue (Million) Forecast, by Application 2019 & 2032
- Table 28: Germany RTD Tea Market Volume (K Tons) Forecast, by Application 2019 & 2032
- Table 29: Global RTD Tea Market Revenue Million Forecast, by Country 2019 & 2032
- Table 30: Global RTD Tea Market Volume K Tons Forecast, by Country 2019 & 2032
- Table 31: China RTD Tea Market Revenue (Million) Forecast, by Application 2019 & 2032
- Table 32: China RTD Tea Market Volume (K Tons) Forecast, by Application 2019 & 2032
- Table 33: Japan RTD Tea Market Revenue (Million) Forecast, by Application 2019 & 2032
- Table 34: Japan RTD Tea Market Volume (K Tons) Forecast, by Application 2019 & 2032
- Table 35: India RTD Tea Market Revenue (Million) Forecast, by Application 2019 & 2032
- Table 36: India RTD Tea Market Volume (K Tons) Forecast, by Application 2019 & 2032
- Table 37: South Korea RTD Tea Market Revenue (Million) Forecast, by Application 2019 & 2032
- Table 38: South Korea RTD Tea Market Volume (K Tons) Forecast, by Application 2019 & 2032
- Table 39: Taiwan RTD Tea Market Revenue (Million) Forecast, by Application 2019 & 2032
- Table 40: Taiwan RTD Tea Market Volume (K Tons) Forecast, by Application 2019 & 2032
- Table 41: Australia RTD Tea Market Revenue (Million) Forecast, by Application 2019 & 2032
- Table 42: Australia RTD Tea Market Volume (K Tons) Forecast, by Application 2019 & 2032
- Table 43: Rest of Asia-Pacific RTD Tea Market Revenue (Million) Forecast, by Application 2019 & 2032
- Table 44: Rest of Asia-Pacific RTD Tea Market Volume (K Tons) Forecast, by Application 2019 & 2032
- Table 45: Global RTD Tea Market Revenue Million Forecast, by Country 2019 & 2032
- Table 46: Global RTD Tea Market Volume K Tons Forecast, by Country 2019 & 2032
- Table 47: United States Canada Mexico RTD Tea Market Revenue (Million) Forecast, by Application 2019 & 2032
- Table 48: United States Canada Mexico RTD Tea Market Volume (K Tons) Forecast, by Application 2019 & 2032
- Table 49: Global RTD Tea Market Revenue Million Forecast, by Soft Drink Type 2019 & 2032
- Table 50: Global RTD Tea Market Volume K Tons Forecast, by Soft Drink Type 2019 & 2032
- Table 51: Global RTD Tea Market Revenue Million Forecast, by Packaging Type 2019 & 2032
- Table 52: Global RTD Tea Market Volume K Tons Forecast, by Packaging Type 2019 & 2032
- Table 53: Global RTD Tea Market Revenue Million Forecast, by Distribution Channel 2019 & 2032
- Table 54: Global RTD Tea Market Volume K Tons Forecast, by Distribution Channel 2019 & 2032
- Table 55: Global RTD Tea Market Revenue Million Forecast, by Country 2019 & 2032
- Table 56: Global RTD Tea Market Volume K Tons Forecast, by Country 2019 & 2032
- Table 57: United States RTD Tea Market Revenue (Million) Forecast, by Application 2019 & 2032
- Table 58: United States RTD Tea Market Volume (K Tons) Forecast, by Application 2019 & 2032
- Table 59: Canada RTD Tea Market Revenue (Million) Forecast, by Application 2019 & 2032
- Table 60: Canada RTD Tea Market Volume (K Tons) Forecast, by Application 2019 & 2032
- Table 61: Mexico RTD Tea Market Revenue (Million) Forecast, by Application 2019 & 2032
- Table 62: Mexico RTD Tea Market Volume (K Tons) Forecast, by Application 2019 & 2032
- Table 63: Global RTD Tea Market Revenue Million Forecast, by Soft Drink Type 2019 & 2032
- Table 64: Global RTD Tea Market Volume K Tons Forecast, by Soft Drink Type 2019 & 2032
- Table 65: Global RTD Tea Market Revenue Million Forecast, by Packaging Type 2019 & 2032
- Table 66: Global RTD Tea Market Volume K Tons Forecast, by Packaging Type 2019 & 2032
- Table 67: Global RTD Tea Market Revenue Million Forecast, by Distribution Channel 2019 & 2032
- Table 68: Global RTD Tea Market Volume K Tons Forecast, by Distribution Channel 2019 & 2032
- Table 69: Global RTD Tea Market Revenue Million Forecast, by Country 2019 & 2032
- Table 70: Global RTD Tea Market Volume K Tons Forecast, by Country 2019 & 2032
- Table 71: Brazil RTD Tea Market Revenue (Million) Forecast, by Application 2019 & 2032
- Table 72: Brazil RTD Tea Market Volume (K Tons) Forecast, by Application 2019 & 2032
- Table 73: Argentina RTD Tea Market Revenue (Million) Forecast, by Application 2019 & 2032
- Table 74: Argentina RTD Tea Market Volume (K Tons) Forecast, by Application 2019 & 2032
- Table 75: Rest of South America RTD Tea Market Revenue (Million) Forecast, by Application 2019 & 2032
- Table 76: Rest of South America RTD Tea Market Volume (K Tons) Forecast, by Application 2019 & 2032
- Table 77: Global RTD Tea Market Revenue Million Forecast, by Soft Drink Type 2019 & 2032
- Table 78: Global RTD Tea Market Volume K Tons Forecast, by Soft Drink Type 2019 & 2032
- Table 79: Global RTD Tea Market Revenue Million Forecast, by Packaging Type 2019 & 2032
- Table 80: Global RTD Tea Market Volume K Tons Forecast, by Packaging Type 2019 & 2032
- Table 81: Global RTD Tea Market Revenue Million Forecast, by Distribution Channel 2019 & 2032
- Table 82: Global RTD Tea Market Volume K Tons Forecast, by Distribution Channel 2019 & 2032
- Table 83: Global RTD Tea Market Revenue Million Forecast, by Country 2019 & 2032
- Table 84: Global RTD Tea Market Volume K Tons Forecast, by Country 2019 & 2032
- Table 85: United Kingdom RTD Tea Market Revenue (Million) Forecast, by Application 2019 & 2032
- Table 86: United Kingdom RTD Tea Market Volume (K Tons) Forecast, by Application 2019 & 2032
- Table 87: Germany RTD Tea Market Revenue (Million) Forecast, by Application 2019 & 2032
- Table 88: Germany RTD Tea Market Volume (K Tons) Forecast, by Application 2019 & 2032
- Table 89: France RTD Tea Market Revenue (Million) Forecast, by Application 2019 & 2032
- Table 90: France RTD Tea Market Volume (K Tons) Forecast, by Application 2019 & 2032
- Table 91: Italy RTD Tea Market Revenue (Million) Forecast, by Application 2019 & 2032
- Table 92: Italy RTD Tea Market Volume (K Tons) Forecast, by Application 2019 & 2032
- Table 93: Spain RTD Tea Market Revenue (Million) Forecast, by Application 2019 & 2032
- Table 94: Spain RTD Tea Market Volume (K Tons) Forecast, by Application 2019 & 2032
- Table 95: Russia RTD Tea Market Revenue (Million) Forecast, by Application 2019 & 2032
- Table 96: Russia RTD Tea Market Volume (K Tons) Forecast, by Application 2019 & 2032
- Table 97: Benelux RTD Tea Market Revenue (Million) Forecast, by Application 2019 & 2032
- Table 98: Benelux RTD Tea Market Volume (K Tons) Forecast, by Application 2019 & 2032
- Table 99: Nordics RTD Tea Market Revenue (Million) Forecast, by Application 2019 & 2032
- Table 100: Nordics RTD Tea Market Volume (K Tons) Forecast, by Application 2019 & 2032
- Table 101: Rest of Europe RTD Tea Market Revenue (Million) Forecast, by Application 2019 & 2032
- Table 102: Rest of Europe RTD Tea Market Volume (K Tons) Forecast, by Application 2019 & 2032
- Table 103: Global RTD Tea Market Revenue Million Forecast, by Soft Drink Type 2019 & 2032
- Table 104: Global RTD Tea Market Volume K Tons Forecast, by Soft Drink Type 2019 & 2032
- Table 105: Global RTD Tea Market Revenue Million Forecast, by Packaging Type 2019 & 2032
- Table 106: Global RTD Tea Market Volume K Tons Forecast, by Packaging Type 2019 & 2032
- Table 107: Global RTD Tea Market Revenue Million Forecast, by Distribution Channel 2019 & 2032
- Table 108: Global RTD Tea Market Volume K Tons Forecast, by Distribution Channel 2019 & 2032
- Table 109: Global RTD Tea Market Revenue Million Forecast, by Country 2019 & 2032
- Table 110: Global RTD Tea Market Volume K Tons Forecast, by Country 2019 & 2032
- Table 111: Turkey RTD Tea Market Revenue (Million) Forecast, by Application 2019 & 2032
- Table 112: Turkey RTD Tea Market Volume (K Tons) Forecast, by Application 2019 & 2032
- Table 113: Israel RTD Tea Market Revenue (Million) Forecast, by Application 2019 & 2032
- Table 114: Israel RTD Tea Market Volume (K Tons) Forecast, by Application 2019 & 2032
- Table 115: GCC RTD Tea Market Revenue (Million) Forecast, by Application 2019 & 2032
- Table 116: GCC RTD Tea Market Volume (K Tons) Forecast, by Application 2019 & 2032
- Table 117: North Africa RTD Tea Market Revenue (Million) Forecast, by Application 2019 & 2032
- Table 118: North Africa RTD Tea Market Volume (K Tons) Forecast, by Application 2019 & 2032
- Table 119: South Africa RTD Tea Market Revenue (Million) Forecast, by Application 2019 & 2032
- Table 120: South Africa RTD Tea Market Volume (K Tons) Forecast, by Application 2019 & 2032
- Table 121: Rest of Middle East & Africa RTD Tea Market Revenue (Million) Forecast, by Application 2019 & 2032
- Table 122: Rest of Middle East & Africa RTD Tea Market Volume (K Tons) Forecast, by Application 2019 & 2032
- Table 123: Global RTD Tea Market Revenue Million Forecast, by Soft Drink Type 2019 & 2032
- Table 124: Global RTD Tea Market Volume K Tons Forecast, by Soft Drink Type 2019 & 2032
- Table 125: Global RTD Tea Market Revenue Million Forecast, by Packaging Type 2019 & 2032
- Table 126: Global RTD Tea Market Volume K Tons Forecast, by Packaging Type 2019 & 2032
- Table 127: Global RTD Tea Market Revenue Million Forecast, by Distribution Channel 2019 & 2032
- Table 128: Global RTD Tea Market Volume K Tons Forecast, by Distribution Channel 2019 & 2032
- Table 129: Global RTD Tea Market Revenue Million Forecast, by Country 2019 & 2032
- Table 130: Global RTD Tea Market Volume K Tons Forecast, by Country 2019 & 2032
- Table 131: China RTD Tea Market Revenue (Million) Forecast, by Application 2019 & 2032
- Table 132: China RTD Tea Market Volume (K Tons) Forecast, by Application 2019 & 2032
- Table 133: India RTD Tea Market Revenue (Million) Forecast, by Application 2019 & 2032
- Table 134: India RTD Tea Market Volume (K Tons) Forecast, by Application 2019 & 2032
- Table 135: Japan RTD Tea Market Revenue (Million) Forecast, by Application 2019 & 2032
- Table 136: Japan RTD Tea Market Volume (K Tons) Forecast, by Application 2019 & 2032
- Table 137: South Korea RTD Tea Market Revenue (Million) Forecast, by Application 2019 & 2032
- Table 138: South Korea RTD Tea Market Volume (K Tons) Forecast, by Application 2019 & 2032
- Table 139: ASEAN RTD Tea Market Revenue (Million) Forecast, by Application 2019 & 2032
- Table 140: ASEAN RTD Tea Market Volume (K Tons) Forecast, by Application 2019 & 2032
- Table 141: Oceania RTD Tea Market Revenue (Million) Forecast, by Application 2019 & 2032
- Table 142: Oceania RTD Tea Market Volume (K Tons) Forecast, by Application 2019 & 2032
- Table 143: Rest of Asia Pacific RTD Tea Market Revenue (Million) Forecast, by Application 2019 & 2032
- Table 144: Rest of Asia Pacific RTD Tea Market Volume (K Tons) Forecast, by Application 2019 & 2032
Frequently Asked Questions
1. What is the projected Compound Annual Growth Rate (CAGR) of the RTD Tea Market?
The projected CAGR is approximately 1.50%.
2. Which companies are prominent players in the RTD Tea Market?
Key companies in the market include Arizona Beverages USA LLC, Nestle S A, Asahi Group Holdings Ltd, Ito En Ltd, PepsiCo Inc, Tata Consumer Products Ltd, PT Anggada Putra Rekso Mulia, Suntory Holdings Limited, Keurig Dr Pepper Inc, Tingyi (Cayman Islands) Holding Corporation, The Coca-Cola Company, Hangzhou Wahaha Group Co Ltd, Uni-President Enterprises Corp, Kirin Holdings Company Limited, Thai Beverages PCL, Reily Foods Company, Sapporo Holdings Limited.
3. What are the main segments of the RTD Tea Market?
The market segments include Soft Drink Type, Packaging Type, Distribution Channel.
4. Can you provide details about the market size?
The market size is estimated to be USD 22490 Million as of 2022.
5. What are some drivers contributing to market growth?
Increasing demand for meat alternatives.
6. What are the notable trends driving market growth?
OTHER KEY INDUSTRY TRENDS COVERED IN THE REPORT.
7. Are there any restraints impacting market growth?
Presence of numerous alternatives in the plant proteins.
8. Can you provide examples of recent developments in the market?
February 2024: Rockstar® Energy Drink, a subsidiary of PepsiCo, Inc unveiled “Rockstar Focus™,” a new line of energy drinks delivering energy & mental boost made with innovative ingredients like Lion’s Mane, a mushroom used in traditional eastern cultures, and providing 200 mg of caffeine. These products are avilable in retail channels in Saudi Arabia, UAE and Qatar.November 2023: The Coca-Cola Company's brand ChaiChun brought exquisite teas to Delhi with its new store, The ChaiChun Store, expanding its business.January 2023: Lipton Tea has announced a new partnership with Full Cart, a program within nonprofit U.S. Hunger, and a virtual food pantry to make heart-friendly nutrition and grocery assistance more accessible.
9. What pricing options are available for accessing the report?
Pricing options include single-user, multi-user, and enterprise licenses priced at USD 3800, USD 4500, and USD 5800 respectively.
10. Is the market size provided in terms of value or volume?
The market size is provided in terms of value, measured in Million and volume, measured in K Tons.
11. Are there any specific market keywords associated with the report?
Yes, the market keyword associated with the report is "RTD Tea Market," which aids in identifying and referencing the specific market segment covered.
12. How do I determine which pricing option suits my needs best?
The pricing options vary based on user requirements and access needs. Individual users may opt for single-user licenses, while businesses requiring broader access may choose multi-user or enterprise licenses for cost-effective access to the report.
13. Are there any additional resources or data provided in the RTD Tea Market report?
While the report offers comprehensive insights, it's advisable to review the specific contents or supplementary materials provided to ascertain if additional resources or data are available.
14. How can I stay updated on further developments or reports in the RTD Tea Market?
To stay informed about further developments, trends, and reports in the RTD Tea Market, consider subscribing to industry newsletters, following relevant companies and organizations, or regularly checking reputable industry news sources and publications.
Methodology
Step 1 - Identification of Relevant Samples Size from Population Database


Step 2 - Approaches for Defining Global Market Size (Value, Volume* & Price*)

Note*: In applicable scenarios
Step 3 - Data Sources
Primary Research
- Web Analytics
- Survey Reports
- Research Institute
- Latest Research Reports
- Opinion Leaders
Secondary Research
- Annual Reports
- White Paper
- Latest Press Release
- Industry Association
- Paid Database
- Investor Presentations

Step 4 - Data Triangulation
Involves using different sources of information in order to increase the validity of a study
These sources are likely to be stakeholders in a program - participants, other researchers, program staff, other community members, and so on.
Then we put all data in single framework & apply various statistical tools to find out the dynamic on the market.
During the analysis stage, feedback from the stakeholder groups would be compared to determine areas of agreement as well as areas of divergence
