

Key Insights
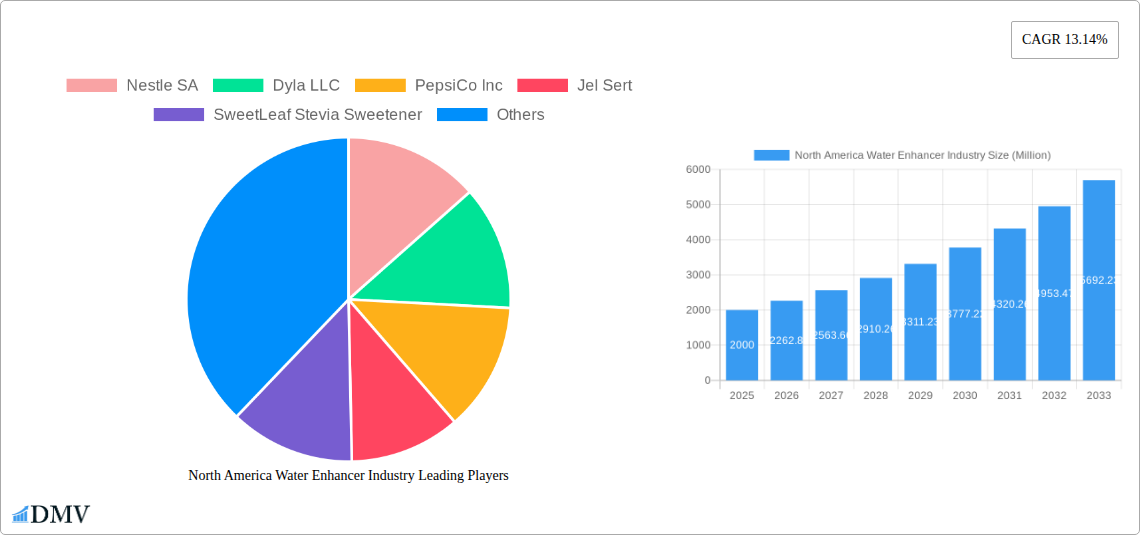
The North American water enhancer market, valued at approximately $XX million in 2025, is projected to experience robust growth, exhibiting a compound annual growth rate (CAGR) of 13.14% from 2025 to 2033. This expansion is fueled by several key drivers. The rising consumer awareness of health and wellness, coupled with a growing preference for healthier beverage alternatives to sugary sodas and juices, significantly boosts demand for water enhancers. Convenience also plays a crucial role; water enhancers offer a quick and easy way to add flavor and essential vitamins to water, aligning perfectly with busy lifestyles. Furthermore, the increasing popularity of functional beverages, those offering added health benefits beyond hydration, further propels market growth. Key players like Nestle SA, PepsiCo Inc., and The Coca-Cola Company are leveraging this trend, investing in innovative product development and expanding their distribution networks across various channels, including supermarkets, convenience stores, online platforms, and pharmacies. The market segmentation shows a diverse distribution landscape, with supermarkets/hypermarkets likely holding the largest market share due to their extensive reach and established presence. Online retail is also a rapidly growing segment, reflecting the increasing shift towards e-commerce.
However, certain restraints might impede market growth. Pricing sensitivity among consumers could restrict market penetration, particularly in the budget-conscious segments. Furthermore, the presence of numerous smaller players and intense competition could put pressure on profit margins. To maintain growth, companies will need to focus on product differentiation, marketing strategies targeting specific health-conscious consumer segments, and expansion into emerging channels. The continued innovation in flavor profiles, the introduction of natural and organic options, and a focus on sustainability will be critical success factors in this competitive and dynamic market. Future growth will depend heavily on successful navigation of these challenges and the continued evolution of consumer preferences toward healthy and convenient hydration options.
North America Water Enhancer Industry: A Comprehensive Market Report (2019-2033)
This insightful report provides a comprehensive analysis of the North America water enhancer industry, offering a detailed overview of market trends, growth drivers, competitive landscape, and future projections. Covering the period from 2019 to 2033, with a focus on 2025, this report is an invaluable resource for stakeholders seeking to understand and capitalize on opportunities within this dynamic sector. The report features in-depth analysis of key players such as Nestle SA, Dyla LLC, PepsiCo Inc, Jel Sert, SweetLeaf Stevia Sweetener, Nuun, The Kraft Heinz Company, and The Coca-Cola Company (list not exhaustive).
North America Water Enhancer Industry Market Composition & Trends
This section delves into the current state of the North American water enhancer market, examining its competitive intensity and identifying key trends shaping its future. We analyze market concentration, revealing the market share distribution among leading players and assessing the impact of mergers and acquisitions (M&A) activities. The estimated value of M&A deals in the industry during the historical period (2019-2024) is estimated at $XX Million. We also explore the influence of innovation, regulatory changes, the availability of substitute products, end-user preferences, and the overall competitive landscape.
- Market Concentration: The North American water enhancer market exhibits a [describe level of concentration: e.g., moderately concentrated] market structure, with the top five players holding an estimated [XX]% market share in 2024.
- Innovation Catalysts: The rising demand for healthier beverage options and the increasing focus on natural and organic ingredients are driving innovation in flavor profiles and formulations.
- Regulatory Landscape: Regulations concerning labeling, ingredients, and health claims significantly influence product development and marketing strategies.
- Substitute Products: Competition arises from other flavored beverages, including ready-to-drink teas, juices, and sports drinks.
- End-User Profiles: The primary consumers of water enhancers are health-conscious individuals seeking convenient and customizable hydration options.
- M&A Activity: The industry has witnessed [describe level of M&A activity: e.g., moderate] M&A activity, with deals primarily focused on [mention focus areas: e.g., expanding product portfolios and geographical reach].
North America Water Enhancer Industry Evolution
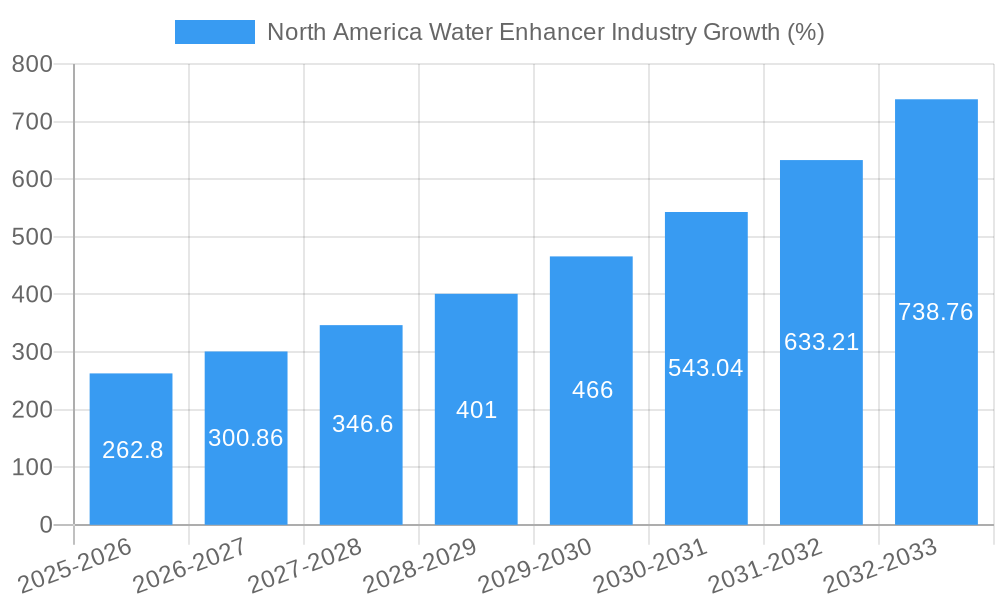
This section provides a comprehensive analysis of the North American water enhancer industry's evolution, exploring its historical growth trajectory, technological advancements, and evolving consumer preferences. We analyze market growth rates, adoption rates of new technologies, and the impact of changing consumer demands. The market witnessed a Compound Annual Growth Rate (CAGR) of XX% during the historical period (2019-2024) and is projected to grow at a CAGR of XX% during the forecast period (2025-2033), reaching an estimated value of $XX Million by 2033. The increasing adoption of [mention specific technologies: e.g., natural sweeteners and innovative flavor combinations] is further fueling market growth. Consumer preferences are shifting towards healthier, more natural, and convenient beverage options, creating significant opportunities for market expansion.
Leading Regions, Countries, or Segments in North America Water Enhancer Industry
This section identifies the dominant regions, countries, and distribution channels within the North American water enhancer market. The analysis focuses on Supermarkets/Hypermarkets, Convenience Stores, Pharmacy and Health Stores, Online Retail Stores, and Other Distribution Channels. Supermarkets/Hypermarkets currently hold the largest market share, driven by factors including [detailed analysis of supermarket dominance].
- Supermarkets/Hypermarkets:
- Key Drivers: High consumer foot traffic, established distribution networks, and opportunities for product placement.
- Detailed Analysis: The dominance of supermarkets stems from their broad reach, established consumer base, and ability to effectively promote new products.
- Convenience Stores:
- Key Drivers: Convenient location and growing demand for on-the-go hydration options.
- Detailed Analysis: [Insert detailed analysis of convenience store segment]
- Pharmacy and Health Stores:
- Key Drivers: Association with health and wellness, access to health-conscious consumers.
- Detailed Analysis: [Insert detailed analysis of pharmacy and health stores segment]
- Online Retail Stores:
- Key Drivers: Increasing e-commerce penetration and convenience of online shopping.
- Detailed Analysis: [Insert detailed analysis of online retail stores segment]
- Other Distribution Channels:
- Key Drivers: [Mention key drivers for this segment]
- Detailed Analysis: [Insert detailed analysis of other distribution channels segment]
North America Water Enhancer Industry Product Innovations
Recent years have witnessed significant innovation in water enhancer products, with a focus on natural sweeteners, unique flavor profiles, and functional benefits. Manufacturers are increasingly incorporating functional ingredients like vitamins, electrolytes, and antioxidants, catering to the growing demand for healthy and convenient beverage options. The introduction of single-serve packaging and innovative dispensing mechanisms has further enhanced product convenience and appeal. These innovations have resulted in a rise in premium-priced water enhancers with enhanced health benefits.
Propelling Factors for North America Water Enhancer Industry Growth
Several factors contribute to the growth of the North American water enhancer market. The increasing preference for healthier beverages, fueled by rising health awareness among consumers, is a key driver. Technological advancements in flavor creation and packaging are also contributing factors. Favorable regulatory environments in some regions, along with supportive government initiatives promoting healthy lifestyles, further stimulate market expansion.
Obstacles in the North America Water Enhancer Industry Market
The North American water enhancer market faces certain challenges. Intense competition from established beverage brands and emerging players creates pressure on pricing and profitability. Fluctuations in raw material costs can significantly impact production costs. Stringent regulatory requirements regarding labeling and ingredient safety also pose challenges for manufacturers.
Future Opportunities in North America Water Enhancer Industry
The future of the North American water enhancer market holds immense potential. Emerging trends like personalized nutrition and functional beverages are creating opportunities for product diversification. Expansion into new geographical markets, particularly in regions with growing health consciousness, presents significant growth potential. Technological advancements in flavor technology and sustainable packaging solutions can further drive market expansion.
Major Players in the North America Water Enhancer Industry Ecosystem
- Nestle SA
- Dyla LLC
- PepsiCo Inc
- Jel Sert
- SweetLeaf Stevia Sweetener
- Nuun
- The Kraft Heinz Company
- The Coca-Cola Company
Key Developments in North America Water Enhancer Industry Industry
- [Month, Year]: [Company Name] launched a new line of water enhancers featuring [key features]. This launch significantly impacted market share within the [segment] segment.
- [Month, Year]: [Company A] acquired [Company B], resulting in [impact on market dynamics].
- [Month, Year]: A new regulation regarding [specific regulation] was implemented, impacting the industry's landscape. [Explain impact].
- [Month, Year]: A significant shift in consumer preferences towards [specific trend] impacted product development strategies.
Strategic North America Water Enhancer Industry Market Forecast
The North American water enhancer market is poised for continued growth, driven by sustained consumer demand for healthier beverage options and ongoing product innovation. Emerging trends in personalized nutrition and functional beverages will unlock new market segments, while technological advancements in flavor creation and packaging will enhance consumer appeal and convenience. The forecast period anticipates strong growth, particularly in the [mention specific segments or regions showing high potential], presenting significant opportunities for both established players and new entrants.
North America Water Enhancer Industry Segmentation
-
1. Distribution Channel
- 1.1. Supermarkets/Hypermarkets
- 1.2. Convenience Stores
- 1.3. Pharmacy and Health Stores
- 1.4. Online Retail Stores
- 1.5. Other Distribution Channels
-
2. Geography
- 2.1. United States
- 2.2. Canada
- 2.3. Mexico
- 2.4. Rest of North America
North America Water Enhancer Industry Segmentation By Geography
- 1. United States
- 2. Canada
- 3. Mexico
- 4. Rest of North America
North America Water Enhancer Industry REPORT HIGHLIGHTS
| Aspects | Details |
|---|---|
| Study Period | 2019-2033 |
| Base Year | 2024 |
| Estimated Year | 2025 |
| Forecast Period | 2025-2033 |
| Historical Period | 2019-2024 |
| Growth Rate | CAGR of 13.14% from 2019-2033 |
| Segmentation |
|
Table of Contents
- 1. Introduction
- 1.1. Research Scope
- 1.2. Market Segmentation
- 1.3. Research Methodology
- 1.4. Definitions and Assumptions
- 2. Executive Summary
- 2.1. Introduction
- 3. Market Dynamics
- 3.1. Introduction
- 3.2. Market Drivers
- 3.2.1. Consumer shift towards health based beverages; Demand for plant based and vegan products
- 3.3. Market Restrains
- 3.3.1. Lack of awareness of the product
- 3.4. Market Trends
- 3.4.1. Rising Innovations with Tempting Marketing Approaches by Manufacturers
- 4. Market Factor Analysis
- 4.1. Porters Five Forces
- 4.2. Supply/Value Chain
- 4.3. PESTEL analysis
- 4.4. Market Entropy
- 4.5. Patent/Trademark Analysis
- 5. North America Water Enhancer Industry Analysis, Insights and Forecast, 2019-2031
- 5.1. Market Analysis, Insights and Forecast - by Distribution Channel
- 5.1.1. Supermarkets/Hypermarkets
- 5.1.2. Convenience Stores
- 5.1.3. Pharmacy and Health Stores
- 5.1.4. Online Retail Stores
- 5.1.5. Other Distribution Channels
- 5.2. Market Analysis, Insights and Forecast - by Geography
- 5.2.1. United States
- 5.2.2. Canada
- 5.2.3. Mexico
- 5.2.4. Rest of North America
- 5.3. Market Analysis, Insights and Forecast - by Region
- 5.3.1. United States
- 5.3.2. Canada
- 5.3.3. Mexico
- 5.3.4. Rest of North America
- 5.1. Market Analysis, Insights and Forecast - by Distribution Channel
- 6. United States North America Water Enhancer Industry Analysis, Insights and Forecast, 2019-2031
- 6.1. Market Analysis, Insights and Forecast - by Distribution Channel
- 6.1.1. Supermarkets/Hypermarkets
- 6.1.2. Convenience Stores
- 6.1.3. Pharmacy and Health Stores
- 6.1.4. Online Retail Stores
- 6.1.5. Other Distribution Channels
- 6.2. Market Analysis, Insights and Forecast - by Geography
- 6.2.1. United States
- 6.2.2. Canada
- 6.2.3. Mexico
- 6.2.4. Rest of North America
- 6.1. Market Analysis, Insights and Forecast - by Distribution Channel
- 7. Canada North America Water Enhancer Industry Analysis, Insights and Forecast, 2019-2031
- 7.1. Market Analysis, Insights and Forecast - by Distribution Channel
- 7.1.1. Supermarkets/Hypermarkets
- 7.1.2. Convenience Stores
- 7.1.3. Pharmacy and Health Stores
- 7.1.4. Online Retail Stores
- 7.1.5. Other Distribution Channels
- 7.2. Market Analysis, Insights and Forecast - by Geography
- 7.2.1. United States
- 7.2.2. Canada
- 7.2.3. Mexico
- 7.2.4. Rest of North America
- 7.1. Market Analysis, Insights and Forecast - by Distribution Channel
- 8. Mexico North America Water Enhancer Industry Analysis, Insights and Forecast, 2019-2031
- 8.1. Market Analysis, Insights and Forecast - by Distribution Channel
- 8.1.1. Supermarkets/Hypermarkets
- 8.1.2. Convenience Stores
- 8.1.3. Pharmacy and Health Stores
- 8.1.4. Online Retail Stores
- 8.1.5. Other Distribution Channels
- 8.2. Market Analysis, Insights and Forecast - by Geography
- 8.2.1. United States
- 8.2.2. Canada
- 8.2.3. Mexico
- 8.2.4. Rest of North America
- 8.1. Market Analysis, Insights and Forecast - by Distribution Channel
- 9. Rest of North America North America Water Enhancer Industry Analysis, Insights and Forecast, 2019-2031
- 9.1. Market Analysis, Insights and Forecast - by Distribution Channel
- 9.1.1. Supermarkets/Hypermarkets
- 9.1.2. Convenience Stores
- 9.1.3. Pharmacy and Health Stores
- 9.1.4. Online Retail Stores
- 9.1.5. Other Distribution Channels
- 9.2. Market Analysis, Insights and Forecast - by Geography
- 9.2.1. United States
- 9.2.2. Canada
- 9.2.3. Mexico
- 9.2.4. Rest of North America
- 9.1. Market Analysis, Insights and Forecast - by Distribution Channel
- 10. United States North America Water Enhancer Industry Analysis, Insights and Forecast, 2019-2031
- 11. Canada North America Water Enhancer Industry Analysis, Insights and Forecast, 2019-2031
- 12. Mexico North America Water Enhancer Industry Analysis, Insights and Forecast, 2019-2031
- 13. Rest of North America North America Water Enhancer Industry Analysis, Insights and Forecast, 2019-2031
- 14. Competitive Analysis
- 14.1. Market Share Analysis 2024
- 14.2. Company Profiles
- 14.2.1 Nestle SA
- 14.2.1.1. Overview
- 14.2.1.2. Products
- 14.2.1.3. SWOT Analysis
- 14.2.1.4. Recent Developments
- 14.2.1.5. Financials (Based on Availability)
- 14.2.2 Dyla LLC
- 14.2.2.1. Overview
- 14.2.2.2. Products
- 14.2.2.3. SWOT Analysis
- 14.2.2.4. Recent Developments
- 14.2.2.5. Financials (Based on Availability)
- 14.2.3 PepsiCo Inc
- 14.2.3.1. Overview
- 14.2.3.2. Products
- 14.2.3.3. SWOT Analysis
- 14.2.3.4. Recent Developments
- 14.2.3.5. Financials (Based on Availability)
- 14.2.4 Jel Sert
- 14.2.4.1. Overview
- 14.2.4.2. Products
- 14.2.4.3. SWOT Analysis
- 14.2.4.4. Recent Developments
- 14.2.4.5. Financials (Based on Availability)
- 14.2.5 SweetLeaf Stevia Sweetener
- 14.2.5.1. Overview
- 14.2.5.2. Products
- 14.2.5.3. SWOT Analysis
- 14.2.5.4. Recent Developments
- 14.2.5.5. Financials (Based on Availability)
- 14.2.6 Nuun*List Not Exhaustive
- 14.2.6.1. Overview
- 14.2.6.2. Products
- 14.2.6.3. SWOT Analysis
- 14.2.6.4. Recent Developments
- 14.2.6.5. Financials (Based on Availability)
- 14.2.7 The Kraft Heinz Company
- 14.2.7.1. Overview
- 14.2.7.2. Products
- 14.2.7.3. SWOT Analysis
- 14.2.7.4. Recent Developments
- 14.2.7.5. Financials (Based on Availability)
- 14.2.8 The Coca-Cola Company
- 14.2.8.1. Overview
- 14.2.8.2. Products
- 14.2.8.3. SWOT Analysis
- 14.2.8.4. Recent Developments
- 14.2.8.5. Financials (Based on Availability)
- 14.2.1 Nestle SA
List of Figures
- Figure 1: North America Water Enhancer Industry Revenue Breakdown (Million, %) by Product 2024 & 2032
- Figure 2: North America Water Enhancer Industry Share (%) by Company 2024
List of Tables
- Table 1: North America Water Enhancer Industry Revenue Million Forecast, by Region 2019 & 2032
- Table 2: North America Water Enhancer Industry Revenue Million Forecast, by Distribution Channel 2019 & 2032
- Table 3: North America Water Enhancer Industry Revenue Million Forecast, by Geography 2019 & 2032
- Table 4: North America Water Enhancer Industry Revenue Million Forecast, by Region 2019 & 2032
- Table 5: North America Water Enhancer Industry Revenue Million Forecast, by Country 2019 & 2032
- Table 6: United States North America Water Enhancer Industry Revenue (Million) Forecast, by Application 2019 & 2032
- Table 7: Canada North America Water Enhancer Industry Revenue (Million) Forecast, by Application 2019 & 2032
- Table 8: Mexico North America Water Enhancer Industry Revenue (Million) Forecast, by Application 2019 & 2032
- Table 9: Rest of North America North America Water Enhancer Industry Revenue (Million) Forecast, by Application 2019 & 2032
- Table 10: North America Water Enhancer Industry Revenue Million Forecast, by Distribution Channel 2019 & 2032
- Table 11: North America Water Enhancer Industry Revenue Million Forecast, by Geography 2019 & 2032
- Table 12: North America Water Enhancer Industry Revenue Million Forecast, by Country 2019 & 2032
- Table 13: North America Water Enhancer Industry Revenue Million Forecast, by Distribution Channel 2019 & 2032
- Table 14: North America Water Enhancer Industry Revenue Million Forecast, by Geography 2019 & 2032
- Table 15: North America Water Enhancer Industry Revenue Million Forecast, by Country 2019 & 2032
- Table 16: North America Water Enhancer Industry Revenue Million Forecast, by Distribution Channel 2019 & 2032
- Table 17: North America Water Enhancer Industry Revenue Million Forecast, by Geography 2019 & 2032
- Table 18: North America Water Enhancer Industry Revenue Million Forecast, by Country 2019 & 2032
- Table 19: North America Water Enhancer Industry Revenue Million Forecast, by Distribution Channel 2019 & 2032
- Table 20: North America Water Enhancer Industry Revenue Million Forecast, by Geography 2019 & 2032
- Table 21: North America Water Enhancer Industry Revenue Million Forecast, by Country 2019 & 2032
Frequently Asked Questions
1. What is the projected Compound Annual Growth Rate (CAGR) of the North America Water Enhancer Industry?
The projected CAGR is approximately 13.14%.
2. Which companies are prominent players in the North America Water Enhancer Industry?
Key companies in the market include Nestle SA, Dyla LLC, PepsiCo Inc, Jel Sert, SweetLeaf Stevia Sweetener, Nuun*List Not Exhaustive, The Kraft Heinz Company, The Coca-Cola Company.
3. What are the main segments of the North America Water Enhancer Industry?
The market segments include Distribution Channel, Geography.
4. Can you provide details about the market size?
The market size is estimated to be USD XX Million as of 2022.
5. What are some drivers contributing to market growth?
Consumer shift towards health based beverages; Demand for plant based and vegan products.
6. What are the notable trends driving market growth?
Rising Innovations with Tempting Marketing Approaches by Manufacturers.
7. Are there any restraints impacting market growth?
Lack of awareness of the product.
8. Can you provide examples of recent developments in the market?
N/A
9. What pricing options are available for accessing the report?
Pricing options include single-user, multi-user, and enterprise licenses priced at USD 4750, USD 5250, and USD 8750 respectively.
10. Is the market size provided in terms of value or volume?
The market size is provided in terms of value, measured in Million.
11. Are there any specific market keywords associated with the report?
Yes, the market keyword associated with the report is "North America Water Enhancer Industry," which aids in identifying and referencing the specific market segment covered.
12. How do I determine which pricing option suits my needs best?
The pricing options vary based on user requirements and access needs. Individual users may opt for single-user licenses, while businesses requiring broader access may choose multi-user or enterprise licenses for cost-effective access to the report.
13. Are there any additional resources or data provided in the North America Water Enhancer Industry report?
While the report offers comprehensive insights, it's advisable to review the specific contents or supplementary materials provided to ascertain if additional resources or data are available.
14. How can I stay updated on further developments or reports in the North America Water Enhancer Industry?
To stay informed about further developments, trends, and reports in the North America Water Enhancer Industry, consider subscribing to industry newsletters, following relevant companies and organizations, or regularly checking reputable industry news sources and publications.
Methodology
Step 1 - Identification of Relevant Samples Size from Population Database


Step 2 - Approaches for Defining Global Market Size (Value, Volume* & Price*)

Note*: In applicable scenarios
Step 3 - Data Sources
Primary Research
- Web Analytics
- Survey Reports
- Research Institute
- Latest Research Reports
- Opinion Leaders
Secondary Research
- Annual Reports
- White Paper
- Latest Press Release
- Industry Association
- Paid Database
- Investor Presentations

Step 4 - Data Triangulation
Involves using different sources of information in order to increase the validity of a study
These sources are likely to be stakeholders in a program - participants, other researchers, program staff, other community members, and so on.
Then we put all data in single framework & apply various statistical tools to find out the dynamic on the market.
During the analysis stage, feedback from the stakeholder groups would be compared to determine areas of agreement as well as areas of divergence
