

Key Insights
The global rice milk market, valued at $277.08 million in 2025, is projected to experience robust growth, exhibiting a Compound Annual Growth Rate (CAGR) of 5.28% from 2025 to 2033. This expansion is driven by several key factors. The increasing consumer preference for plant-based alternatives to dairy milk, fueled by health consciousness and dietary restrictions (lactose intolerance, veganism), is a significant catalyst. Growing awareness of the environmental impact of dairy farming further bolsters demand for sustainable and ethically sourced beverages like rice milk. Furthermore, the market is witnessing innovation in product development, with the emergence of various forms (powdered and fluid), sources (organic and conventional), and flavor profiles catering to diverse consumer preferences. The rise of online retail channels provides additional avenues for market penetration, expanding accessibility beyond traditional supermarket distribution. However, the market faces some challenges. Price competition from other plant-based milk alternatives, potential fluctuations in rice prices, and the need to address consumer perceptions regarding rice milk's nutritional value compared to dairy milk will continue to shape market dynamics.
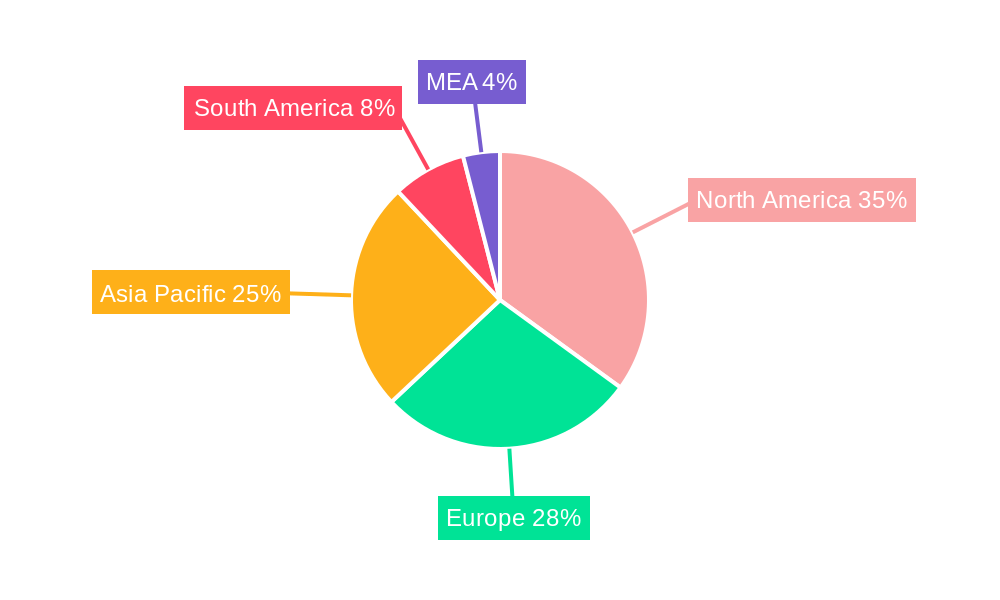
The geographic distribution of the rice milk market shows a diverse landscape. North America and Europe currently hold significant market shares, driven by high levels of health consciousness and established plant-based food markets. However, the Asia-Pacific region, particularly countries like China, India, and Japan, presents substantial growth potential due to the increasing adoption of Western dietary habits and rising disposable incomes. South America and the Middle East and Africa are also emerging markets, with untapped potential for expansion as awareness of rice milk and its benefits increases. The competitive landscape is characterized by both established multinational food companies and smaller, niche players. Competition is likely to intensify with further innovation and expansion into new markets. Successful players will need to focus on product differentiation, strong branding, and effective marketing strategies to capture and maintain market share in this evolving and dynamic market.

Rice Milk Industry: A Comprehensive Market Report (2019-2033)
This insightful report provides a detailed analysis of the global rice milk industry, offering a comprehensive overview of market dynamics, key players, and future growth prospects. With a study period spanning from 2019 to 2033, and a focus on the estimated year 2025, this report is an invaluable resource for stakeholders seeking to understand and capitalize on opportunities within this burgeoning market. The report covers a market valued at $XX Million in 2025, projecting growth to $XX Million by 2033.
Rice Milk Industry Market Composition & Trends
The global rice milk market exhibits a moderately fragmented landscape, with several key players vying for market share. Market concentration is expected to remain relatively stable during the forecast period (2025-2033), with the top five players holding approximately XX% of the market share in 2025. Innovation is driven primarily by the increasing demand for plant-based alternatives to dairy milk and the development of new product formats and functional benefits. The regulatory landscape is evolving, with increasing scrutiny on labeling and ingredient standards. Substitute products include other plant-based milks (soy, oat, almond), posing significant competitive pressure. End-users primarily consist of health-conscious consumers, vegans, and those with lactose intolerance. Mergers and acquisitions (M&A) activity has been significant, reflecting the consolidation trends within the industry, with recent deals valued at approximately $XX Million collectively.
- Market Share Distribution (2025): Top 5 players - XX%; Others - XX%
- M&A Deal Value (2019-2024): Approximately $XX Million
- Key Innovation Catalysts: Increased demand for plant-based products, functional food trends (e.g., fortified rice milk), sustainable sourcing.
- Regulatory Landscape: Focus on labeling accuracy, ingredient standards, and sustainability certifications.

Rice Milk Industry Industry Evolution
The rice milk industry has witnessed substantial growth over the historical period (2019-2024), driven by the increasing popularity of plant-based diets and growing awareness of the health benefits associated with rice milk. The compound annual growth rate (CAGR) during this period was estimated at XX%. Technological advancements, particularly in processing and packaging, have enhanced product shelf life and quality. Furthermore, consumer demand is shifting towards organic and sustainably sourced rice milk, with a significant increase in the adoption of organic products in recent years. The market is expected to continue its growth trajectory during the forecast period (2025-2033), with a projected CAGR of XX%, largely driven by the growing popularity of plant-based foods and beverages. Technological innovations such as improved fortification techniques and eco-friendly packaging will further stimulate market expansion. Shifting consumer preferences toward healthier and more convenient food choices will also play a critical role in the future growth trajectory of the rice milk market.
Leading Regions, Countries, or Segments in Rice Milk Industry
The dominant segments within the rice milk market are Fluid rice milk and Organic rice milk. The leading region for consumption is North America, driven by high demand for plant-based alternatives and high disposable income. Asia-Pacific is a significant growth region owing to the rising awareness of health benefits and the increased adoption of veganism. Supermarket/Hypermarkets represent the most prominent distribution channel, accounting for the majority of sales.
- Key Drivers in North America: High consumer awareness of health benefits, strong vegan culture, robust retail infrastructure
- Key Drivers in Asia-Pacific: Rising disposable income, growing population, and increased demand for convenient foods
- Dominant Segments: Fluid rice milk, Organic rice milk, Supermarket/Hypermarket distribution channel.
Rice Milk Industry Product Innovations
Recent innovations in the rice milk market focus on enhancing taste, texture, and nutritional value. Companies are incorporating additional ingredients such as vitamins, minerals, and protein to improve the nutritional profile of rice milk. Novel processing techniques are being implemented to enhance the texture and creamy consistency, making it a more appealing alternative to dairy milk. The emergence of flavored and barista-style rice milk varieties cater to diverse consumer preferences. These innovations address market demands for healthier, more versatile, and convenient plant-based beverages.
Propelling Factors for Rice Milk Industry Growth
The rice milk industry’s growth is propelled by several key factors, including the rising popularity of plant-based diets, increased awareness of lactose intolerance, and growing consumer demand for healthier and more sustainable food choices. Technological advancements in processing and packaging have also contributed to enhanced product quality and shelf-life. Furthermore, favorable government regulations and increasing investment in research and development are also fueling growth. The expanding global population and rising disposable incomes in developing economies provide further impetus for market expansion.
Obstacles in the Rice Milk Industry Market
The rice milk industry faces several challenges, including intense competition from other plant-based milk alternatives (oat, soy, almond), fluctuating raw material prices, and the potential for supply chain disruptions. Regulatory complexities regarding labeling and ingredient standards can also impact market growth. Moreover, the relatively high production cost of rice milk compared to some alternatives could pose a barrier to entry for some players. The industry may also encounter difficulties maintaining consistent product quality and taste due to the variability of rice crops.
Future Opportunities in Rice Milk Industry
Future opportunities for the rice milk industry lie in exploring new markets, particularly in developing economies, and expanding product lines to include functional and value-added rice milk products. The development of innovative packaging solutions that enhance product shelf life and reduce environmental impact presents another significant opportunity. Furthermore, collaborations with food service providers and the introduction of rice milk-based ready-to-drink products could generate new revenue streams. Lastly, the rising demand for sustainable and ethically sourced ingredients will open up further avenues for growth.
Major Players in the Rice Milk Industry Ecosystem
- Pureharvest Pty ltd
- Gan Teck Kar Foods
- The Bridge s r l
- Fine Japan Co Ltd
- Nature's Choice
- The Hain Celestial Group Inc
- WhiteWave Foods
- Vitasoy Australia Products Pty Ltd
- Ebro Foods (Tilda)
- Linda MacCartney Foods
- SunOpta Inc
- Panos Brands LLC (Better Than Milk)
Key Developments in Rice Milk Industry Industry
- February 2022: Ebro Foods subsidiary Tilda Rice launched a plant-based sweet rice milk with 16% rice content, highlighting its natural and organic ingredients and absence of artificial sweeteners.
- May 2021: Linda McCartney Foods expanded its plant-based milk range to include organic rice milk, alongside oat, coconut, and soy options.
- April 2021: SunOpta acquired Hain Celestial Group's North American non-dairy beverage brands, Dream and WestSoy, significantly expanding its market share.
Strategic Rice Milk Industry Market Forecast
The rice milk industry is poised for continued growth, driven by the ongoing shift towards plant-based diets and the increasing demand for healthier and more sustainable food options. The market will likely witness further consolidation through M&A activities, and product innovation will remain a key driver of growth. Expansion into new markets and the development of functional and value-added products will offer significant opportunities for market players. The industry is expected to experience strong growth throughout the forecast period (2025-2033), with substantial potential for market expansion.
Rice Milk Industry Segmentation
-
1. Form
- 1.1. Powder rice milk
- 1.2. Fluid rice milk
-
2. Source
- 2.1. Organic
- 2.2. Conventional
-
3. Distribution Channel
- 3.1. Supermarket/Hypermarket
- 3.2. Convenience Stores
- 3.3. Food Specialty Stores
- 3.4. Online Retailers
- 3.5. Others
Rice Milk Industry Segmentation By Geography
- 1. North America
- 2. Europe
- 3. Asia Pacific
- 4. South America
- 5. Middle East and Africa
Rice Milk Industry REPORT HIGHLIGHTS
| Aspects | Details |
|---|---|
| Study Period | 2019-2033 |
| Base Year | 2024 |
| Estimated Year | 2025 |
| Forecast Period | 2025-2033 |
| Historical Period | 2019-2024 |
| Growth Rate | CAGR of 5.28% from 2019-2033 |
| Segmentation |
|
Table of Contents
- 1. Introduction
- 1.1. Research Scope
- 1.2. Market Segmentation
- 1.3. Research Methodology
- 1.4. Definitions and Assumptions
- 2. Executive Summary
- 2.1. Introduction
- 3. Market Dynamics
- 3.1. Introduction
- 3.2. Market Drivers
- 3.2.1 The prevalence of lactose intolerance and dairy allergies is leading consumers to seek non-dairy alternatives
- 3.2.2 making rice milk an attractive option for those with dietary restrictions.
- 3.3. Market Restrains
- 3.3.1 Rice milk is lower in protein compared to other plant-based milks like soy or almond milk
- 3.3.2 which may deter some consumers seeking more balanced nutrition
- 3.4. Market Trends
- 3.4.1 There is a growing trend toward fortified rice milk products that address the nutritional gaps compared to dairy milk
- 3.4.2 such as low protein content.
- 4. Market Factor Analysis
- 4.1. Porters Five Forces
- 4.2. Supply/Value Chain
- 4.3. PESTEL analysis
- 4.4. Market Entropy
- 4.5. Patent/Trademark Analysis
- 5. Global Rice Milk Industry Analysis, Insights and Forecast, 2019-2031
- 5.1. Market Analysis, Insights and Forecast - by Form
- 5.1.1. Powder rice milk
- 5.1.2. Fluid rice milk
- 5.2. Market Analysis, Insights and Forecast - by Source
- 5.2.1. Organic
- 5.2.2. Conventional
- 5.3. Market Analysis, Insights and Forecast - by Distribution Channel
- 5.3.1. Supermarket/Hypermarket
- 5.3.2. Convenience Stores
- 5.3.3. Food Specialty Stores
- 5.3.4. Online Retailers
- 5.3.5. Others
- 5.4. Market Analysis, Insights and Forecast - by Region
- 5.4.1. North America
- 5.4.2. Europe
- 5.4.3. Asia Pacific
- 5.4.4. South America
- 5.4.5. Middle East and Africa
- 5.1. Market Analysis, Insights and Forecast - by Form
- 6. North America Rice Milk Industry Analysis, Insights and Forecast, 2019-2031
- 6.1. Market Analysis, Insights and Forecast - by Form
- 6.1.1. Powder rice milk
- 6.1.2. Fluid rice milk
- 6.2. Market Analysis, Insights and Forecast - by Source
- 6.2.1. Organic
- 6.2.2. Conventional
- 6.3. Market Analysis, Insights and Forecast - by Distribution Channel
- 6.3.1. Supermarket/Hypermarket
- 6.3.2. Convenience Stores
- 6.3.3. Food Specialty Stores
- 6.3.4. Online Retailers
- 6.3.5. Others
- 6.1. Market Analysis, Insights and Forecast - by Form
- 7. Europe Rice Milk Industry Analysis, Insights and Forecast, 2019-2031
- 7.1. Market Analysis, Insights and Forecast - by Form
- 7.1.1. Powder rice milk
- 7.1.2. Fluid rice milk
- 7.2. Market Analysis, Insights and Forecast - by Source
- 7.2.1. Organic
- 7.2.2. Conventional
- 7.3. Market Analysis, Insights and Forecast - by Distribution Channel
- 7.3.1. Supermarket/Hypermarket
- 7.3.2. Convenience Stores
- 7.3.3. Food Specialty Stores
- 7.3.4. Online Retailers
- 7.3.5. Others
- 7.1. Market Analysis, Insights and Forecast - by Form
- 8. Asia Pacific Rice Milk Industry Analysis, Insights and Forecast, 2019-2031
- 8.1. Market Analysis, Insights and Forecast - by Form
- 8.1.1. Powder rice milk
- 8.1.2. Fluid rice milk
- 8.2. Market Analysis, Insights and Forecast - by Source
- 8.2.1. Organic
- 8.2.2. Conventional
- 8.3. Market Analysis, Insights and Forecast - by Distribution Channel
- 8.3.1. Supermarket/Hypermarket
- 8.3.2. Convenience Stores
- 8.3.3. Food Specialty Stores
- 8.3.4. Online Retailers
- 8.3.5. Others
- 8.1. Market Analysis, Insights and Forecast - by Form
- 9. South America Rice Milk Industry Analysis, Insights and Forecast, 2019-2031
- 9.1. Market Analysis, Insights and Forecast - by Form
- 9.1.1. Powder rice milk
- 9.1.2. Fluid rice milk
- 9.2. Market Analysis, Insights and Forecast - by Source
- 9.2.1. Organic
- 9.2.2. Conventional
- 9.3. Market Analysis, Insights and Forecast - by Distribution Channel
- 9.3.1. Supermarket/Hypermarket
- 9.3.2. Convenience Stores
- 9.3.3. Food Specialty Stores
- 9.3.4. Online Retailers
- 9.3.5. Others
- 9.1. Market Analysis, Insights and Forecast - by Form
- 10. Middle East and Africa Rice Milk Industry Analysis, Insights and Forecast, 2019-2031
- 10.1. Market Analysis, Insights and Forecast - by Form
- 10.1.1. Powder rice milk
- 10.1.2. Fluid rice milk
- 10.2. Market Analysis, Insights and Forecast - by Source
- 10.2.1. Organic
- 10.2.2. Conventional
- 10.3. Market Analysis, Insights and Forecast - by Distribution Channel
- 10.3.1. Supermarket/Hypermarket
- 10.3.2. Convenience Stores
- 10.3.3. Food Specialty Stores
- 10.3.4. Online Retailers
- 10.3.5. Others
- 10.1. Market Analysis, Insights and Forecast - by Form
- 11. North America Rice Milk Industry Analysis, Insights and Forecast, 2019-2031
- 11.1. Market Analysis, Insights and Forecast - By Country/Sub-region
- 11.1.1 United States
- 11.1.2 Canada
- 11.1.3 Mexico
- 12. Europe Rice Milk Industry Analysis, Insights and Forecast, 2019-2031
- 12.1. Market Analysis, Insights and Forecast - By Country/Sub-region
- 12.1.1 Germany
- 12.1.2 United Kingdom
- 12.1.3 France
- 12.1.4 Spain
- 12.1.5 Italy
- 12.1.6 Spain
- 12.1.7 Belgium
- 12.1.8 Netherland
- 12.1.9 Nordics
- 12.1.10 Rest of Europe
- 13. Asia Pacific Rice Milk Industry Analysis, Insights and Forecast, 2019-2031
- 13.1. Market Analysis, Insights and Forecast - By Country/Sub-region
- 13.1.1 China
- 13.1.2 Japan
- 13.1.3 India
- 13.1.4 South Korea
- 13.1.5 Southeast Asia
- 13.1.6 Australia
- 13.1.7 Indonesia
- 13.1.8 Phillipes
- 13.1.9 Singapore
- 13.1.10 Thailandc
- 13.1.11 Rest of Asia Pacific
- 14. South America Rice Milk Industry Analysis, Insights and Forecast, 2019-2031
- 14.1. Market Analysis, Insights and Forecast - By Country/Sub-region
- 14.1.1 Brazil
- 14.1.2 Argentina
- 14.1.3 Peru
- 14.1.4 Chile
- 14.1.5 Colombia
- 14.1.6 Ecuador
- 14.1.7 Venezuela
- 14.1.8 Rest of South America
- 15. North America Rice Milk Industry Analysis, Insights and Forecast, 2019-2031
- 15.1. Market Analysis, Insights and Forecast - By Country/Sub-region
- 15.1.1 United States
- 15.1.2 Canada
- 15.1.3 Mexico
- 16. MEA Rice Milk Industry Analysis, Insights and Forecast, 2019-2031
- 16.1. Market Analysis, Insights and Forecast - By Country/Sub-region
- 16.1.1 United Arab Emirates
- 16.1.2 Saudi Arabia
- 16.1.3 South Africa
- 16.1.4 Rest of Middle East and Africa
- 17. Competitive Analysis
- 17.1. Global Market Share Analysis 2024
- 17.2. Company Profiles
- 17.2.1 Pureharvest Pty ltd
- 17.2.1.1. Overview
- 17.2.1.2. Products
- 17.2.1.3. SWOT Analysis
- 17.2.1.4. Recent Developments
- 17.2.1.5. Financials (Based on Availability)
- 17.2.2 Gan Teck Kar Foods
- 17.2.2.1. Overview
- 17.2.2.2. Products
- 17.2.2.3. SWOT Analysis
- 17.2.2.4. Recent Developments
- 17.2.2.5. Financials (Based on Availability)
- 17.2.3 The Bridge s r l
- 17.2.3.1. Overview
- 17.2.3.2. Products
- 17.2.3.3. SWOT Analysis
- 17.2.3.4. Recent Developments
- 17.2.3.5. Financials (Based on Availability)
- 17.2.4 Fine Japan Co Ltd
- 17.2.4.1. Overview
- 17.2.4.2. Products
- 17.2.4.3. SWOT Analysis
- 17.2.4.4. Recent Developments
- 17.2.4.5. Financials (Based on Availability)
- 17.2.5 Nature's Choice
- 17.2.5.1. Overview
- 17.2.5.2. Products
- 17.2.5.3. SWOT Analysis
- 17.2.5.4. Recent Developments
- 17.2.5.5. Financials (Based on Availability)
- 17.2.6 The Hain Celestial Group Inc
- 17.2.6.1. Overview
- 17.2.6.2. Products
- 17.2.6.3. SWOT Analysis
- 17.2.6.4. Recent Developments
- 17.2.6.5. Financials (Based on Availability)
- 17.2.7 WhiteWave Foods
- 17.2.7.1. Overview
- 17.2.7.2. Products
- 17.2.7.3. SWOT Analysis
- 17.2.7.4. Recent Developments
- 17.2.7.5. Financials (Based on Availability)
- 17.2.8 Vitasoy Australia Products Pty Ltd
- 17.2.8.1. Overview
- 17.2.8.2. Products
- 17.2.8.3. SWOT Analysis
- 17.2.8.4. Recent Developments
- 17.2.8.5. Financials (Based on Availability)
- 17.2.9 Ebro Foods (Tilda)
- 17.2.9.1. Overview
- 17.2.9.2. Products
- 17.2.9.3. SWOT Analysis
- 17.2.9.4. Recent Developments
- 17.2.9.5. Financials (Based on Availability)
- 17.2.10 Linda MacCartney Foods
- 17.2.10.1. Overview
- 17.2.10.2. Products
- 17.2.10.3. SWOT Analysis
- 17.2.10.4. Recent Developments
- 17.2.10.5. Financials (Based on Availability)
- 17.2.11 SunOpta Inc
- 17.2.11.1. Overview
- 17.2.11.2. Products
- 17.2.11.3. SWOT Analysis
- 17.2.11.4. Recent Developments
- 17.2.11.5. Financials (Based on Availability)
- 17.2.12 Panos Brands LLC (Better Than Milk)
- 17.2.12.1. Overview
- 17.2.12.2. Products
- 17.2.12.3. SWOT Analysis
- 17.2.12.4. Recent Developments
- 17.2.12.5. Financials (Based on Availability)
- 17.2.1 Pureharvest Pty ltd
List of Figures
- Figure 1: Global Rice Milk Industry Revenue Breakdown (Million, %) by Region 2024 & 2032
- Figure 2: North America Rice Milk Industry Revenue (Million), by Country 2024 & 2032
- Figure 3: North America Rice Milk Industry Revenue Share (%), by Country 2024 & 2032
- Figure 4: Europe Rice Milk Industry Revenue (Million), by Country 2024 & 2032
- Figure 5: Europe Rice Milk Industry Revenue Share (%), by Country 2024 & 2032
- Figure 6: Asia Pacific Rice Milk Industry Revenue (Million), by Country 2024 & 2032
- Figure 7: Asia Pacific Rice Milk Industry Revenue Share (%), by Country 2024 & 2032
- Figure 8: South America Rice Milk Industry Revenue (Million), by Country 2024 & 2032
- Figure 9: South America Rice Milk Industry Revenue Share (%), by Country 2024 & 2032
- Figure 10: North America Rice Milk Industry Revenue (Million), by Country 2024 & 2032
- Figure 11: North America Rice Milk Industry Revenue Share (%), by Country 2024 & 2032
- Figure 12: MEA Rice Milk Industry Revenue (Million), by Country 2024 & 2032
- Figure 13: MEA Rice Milk Industry Revenue Share (%), by Country 2024 & 2032
- Figure 14: North America Rice Milk Industry Revenue (Million), by Form 2024 & 2032
- Figure 15: North America Rice Milk Industry Revenue Share (%), by Form 2024 & 2032
- Figure 16: North America Rice Milk Industry Revenue (Million), by Source 2024 & 2032
- Figure 17: North America Rice Milk Industry Revenue Share (%), by Source 2024 & 2032
- Figure 18: North America Rice Milk Industry Revenue (Million), by Distribution Channel 2024 & 2032
- Figure 19: North America Rice Milk Industry Revenue Share (%), by Distribution Channel 2024 & 2032
- Figure 20: North America Rice Milk Industry Revenue (Million), by Country 2024 & 2032
- Figure 21: North America Rice Milk Industry Revenue Share (%), by Country 2024 & 2032
- Figure 22: Europe Rice Milk Industry Revenue (Million), by Form 2024 & 2032
- Figure 23: Europe Rice Milk Industry Revenue Share (%), by Form 2024 & 2032
- Figure 24: Europe Rice Milk Industry Revenue (Million), by Source 2024 & 2032
- Figure 25: Europe Rice Milk Industry Revenue Share (%), by Source 2024 & 2032
- Figure 26: Europe Rice Milk Industry Revenue (Million), by Distribution Channel 2024 & 2032
- Figure 27: Europe Rice Milk Industry Revenue Share (%), by Distribution Channel 2024 & 2032
- Figure 28: Europe Rice Milk Industry Revenue (Million), by Country 2024 & 2032
- Figure 29: Europe Rice Milk Industry Revenue Share (%), by Country 2024 & 2032
- Figure 30: Asia Pacific Rice Milk Industry Revenue (Million), by Form 2024 & 2032
- Figure 31: Asia Pacific Rice Milk Industry Revenue Share (%), by Form 2024 & 2032
- Figure 32: Asia Pacific Rice Milk Industry Revenue (Million), by Source 2024 & 2032
- Figure 33: Asia Pacific Rice Milk Industry Revenue Share (%), by Source 2024 & 2032
- Figure 34: Asia Pacific Rice Milk Industry Revenue (Million), by Distribution Channel 2024 & 2032
- Figure 35: Asia Pacific Rice Milk Industry Revenue Share (%), by Distribution Channel 2024 & 2032
- Figure 36: Asia Pacific Rice Milk Industry Revenue (Million), by Country 2024 & 2032
- Figure 37: Asia Pacific Rice Milk Industry Revenue Share (%), by Country 2024 & 2032
- Figure 38: South America Rice Milk Industry Revenue (Million), by Form 2024 & 2032
- Figure 39: South America Rice Milk Industry Revenue Share (%), by Form 2024 & 2032
- Figure 40: South America Rice Milk Industry Revenue (Million), by Source 2024 & 2032
- Figure 41: South America Rice Milk Industry Revenue Share (%), by Source 2024 & 2032
- Figure 42: South America Rice Milk Industry Revenue (Million), by Distribution Channel 2024 & 2032
- Figure 43: South America Rice Milk Industry Revenue Share (%), by Distribution Channel 2024 & 2032
- Figure 44: South America Rice Milk Industry Revenue (Million), by Country 2024 & 2032
- Figure 45: South America Rice Milk Industry Revenue Share (%), by Country 2024 & 2032
- Figure 46: Middle East and Africa Rice Milk Industry Revenue (Million), by Form 2024 & 2032
- Figure 47: Middle East and Africa Rice Milk Industry Revenue Share (%), by Form 2024 & 2032
- Figure 48: Middle East and Africa Rice Milk Industry Revenue (Million), by Source 2024 & 2032
- Figure 49: Middle East and Africa Rice Milk Industry Revenue Share (%), by Source 2024 & 2032
- Figure 50: Middle East and Africa Rice Milk Industry Revenue (Million), by Distribution Channel 2024 & 2032
- Figure 51: Middle East and Africa Rice Milk Industry Revenue Share (%), by Distribution Channel 2024 & 2032
- Figure 52: Middle East and Africa Rice Milk Industry Revenue (Million), by Country 2024 & 2032
- Figure 53: Middle East and Africa Rice Milk Industry Revenue Share (%), by Country 2024 & 2032
List of Tables
- Table 1: Global Rice Milk Industry Revenue Million Forecast, by Region 2019 & 2032
- Table 2: Global Rice Milk Industry Revenue Million Forecast, by Form 2019 & 2032
- Table 3: Global Rice Milk Industry Revenue Million Forecast, by Source 2019 & 2032
- Table 4: Global Rice Milk Industry Revenue Million Forecast, by Distribution Channel 2019 & 2032
- Table 5: Global Rice Milk Industry Revenue Million Forecast, by Region 2019 & 2032
- Table 6: Global Rice Milk Industry Revenue Million Forecast, by Country 2019 & 2032
- Table 7: United States Rice Milk Industry Revenue (Million) Forecast, by Application 2019 & 2032
- Table 8: Canada Rice Milk Industry Revenue (Million) Forecast, by Application 2019 & 2032
- Table 9: Mexico Rice Milk Industry Revenue (Million) Forecast, by Application 2019 & 2032
- Table 10: Global Rice Milk Industry Revenue Million Forecast, by Country 2019 & 2032
- Table 11: Germany Rice Milk Industry Revenue (Million) Forecast, by Application 2019 & 2032
- Table 12: United Kingdom Rice Milk Industry Revenue (Million) Forecast, by Application 2019 & 2032
- Table 13: France Rice Milk Industry Revenue (Million) Forecast, by Application 2019 & 2032
- Table 14: Spain Rice Milk Industry Revenue (Million) Forecast, by Application 2019 & 2032
- Table 15: Italy Rice Milk Industry Revenue (Million) Forecast, by Application 2019 & 2032
- Table 16: Spain Rice Milk Industry Revenue (Million) Forecast, by Application 2019 & 2032
- Table 17: Belgium Rice Milk Industry Revenue (Million) Forecast, by Application 2019 & 2032
- Table 18: Netherland Rice Milk Industry Revenue (Million) Forecast, by Application 2019 & 2032
- Table 19: Nordics Rice Milk Industry Revenue (Million) Forecast, by Application 2019 & 2032
- Table 20: Rest of Europe Rice Milk Industry Revenue (Million) Forecast, by Application 2019 & 2032
- Table 21: Global Rice Milk Industry Revenue Million Forecast, by Country 2019 & 2032
- Table 22: China Rice Milk Industry Revenue (Million) Forecast, by Application 2019 & 2032
- Table 23: Japan Rice Milk Industry Revenue (Million) Forecast, by Application 2019 & 2032
- Table 24: India Rice Milk Industry Revenue (Million) Forecast, by Application 2019 & 2032
- Table 25: South Korea Rice Milk Industry Revenue (Million) Forecast, by Application 2019 & 2032
- Table 26: Southeast Asia Rice Milk Industry Revenue (Million) Forecast, by Application 2019 & 2032
- Table 27: Australia Rice Milk Industry Revenue (Million) Forecast, by Application 2019 & 2032
- Table 28: Indonesia Rice Milk Industry Revenue (Million) Forecast, by Application 2019 & 2032
- Table 29: Phillipes Rice Milk Industry Revenue (Million) Forecast, by Application 2019 & 2032
- Table 30: Singapore Rice Milk Industry Revenue (Million) Forecast, by Application 2019 & 2032
- Table 31: Thailandc Rice Milk Industry Revenue (Million) Forecast, by Application 2019 & 2032
- Table 32: Rest of Asia Pacific Rice Milk Industry Revenue (Million) Forecast, by Application 2019 & 2032
- Table 33: Global Rice Milk Industry Revenue Million Forecast, by Country 2019 & 2032
- Table 34: Brazil Rice Milk Industry Revenue (Million) Forecast, by Application 2019 & 2032
- Table 35: Argentina Rice Milk Industry Revenue (Million) Forecast, by Application 2019 & 2032
- Table 36: Peru Rice Milk Industry Revenue (Million) Forecast, by Application 2019 & 2032
- Table 37: Chile Rice Milk Industry Revenue (Million) Forecast, by Application 2019 & 2032
- Table 38: Colombia Rice Milk Industry Revenue (Million) Forecast, by Application 2019 & 2032
- Table 39: Ecuador Rice Milk Industry Revenue (Million) Forecast, by Application 2019 & 2032
- Table 40: Venezuela Rice Milk Industry Revenue (Million) Forecast, by Application 2019 & 2032
- Table 41: Rest of South America Rice Milk Industry Revenue (Million) Forecast, by Application 2019 & 2032
- Table 42: Global Rice Milk Industry Revenue Million Forecast, by Country 2019 & 2032
- Table 43: United States Rice Milk Industry Revenue (Million) Forecast, by Application 2019 & 2032
- Table 44: Canada Rice Milk Industry Revenue (Million) Forecast, by Application 2019 & 2032
- Table 45: Mexico Rice Milk Industry Revenue (Million) Forecast, by Application 2019 & 2032
- Table 46: Global Rice Milk Industry Revenue Million Forecast, by Country 2019 & 2032
- Table 47: United Arab Emirates Rice Milk Industry Revenue (Million) Forecast, by Application 2019 & 2032
- Table 48: Saudi Arabia Rice Milk Industry Revenue (Million) Forecast, by Application 2019 & 2032
- Table 49: South Africa Rice Milk Industry Revenue (Million) Forecast, by Application 2019 & 2032
- Table 50: Rest of Middle East and Africa Rice Milk Industry Revenue (Million) Forecast, by Application 2019 & 2032
- Table 51: Global Rice Milk Industry Revenue Million Forecast, by Form 2019 & 2032
- Table 52: Global Rice Milk Industry Revenue Million Forecast, by Source 2019 & 2032
- Table 53: Global Rice Milk Industry Revenue Million Forecast, by Distribution Channel 2019 & 2032
- Table 54: Global Rice Milk Industry Revenue Million Forecast, by Country 2019 & 2032
- Table 55: Global Rice Milk Industry Revenue Million Forecast, by Form 2019 & 2032
- Table 56: Global Rice Milk Industry Revenue Million Forecast, by Source 2019 & 2032
- Table 57: Global Rice Milk Industry Revenue Million Forecast, by Distribution Channel 2019 & 2032
- Table 58: Global Rice Milk Industry Revenue Million Forecast, by Country 2019 & 2032
- Table 59: Global Rice Milk Industry Revenue Million Forecast, by Form 2019 & 2032
- Table 60: Global Rice Milk Industry Revenue Million Forecast, by Source 2019 & 2032
- Table 61: Global Rice Milk Industry Revenue Million Forecast, by Distribution Channel 2019 & 2032
- Table 62: Global Rice Milk Industry Revenue Million Forecast, by Country 2019 & 2032
- Table 63: Global Rice Milk Industry Revenue Million Forecast, by Form 2019 & 2032
- Table 64: Global Rice Milk Industry Revenue Million Forecast, by Source 2019 & 2032
- Table 65: Global Rice Milk Industry Revenue Million Forecast, by Distribution Channel 2019 & 2032
- Table 66: Global Rice Milk Industry Revenue Million Forecast, by Country 2019 & 2032
- Table 67: Global Rice Milk Industry Revenue Million Forecast, by Form 2019 & 2032
- Table 68: Global Rice Milk Industry Revenue Million Forecast, by Source 2019 & 2032
- Table 69: Global Rice Milk Industry Revenue Million Forecast, by Distribution Channel 2019 & 2032
- Table 70: Global Rice Milk Industry Revenue Million Forecast, by Country 2019 & 2032
Frequently Asked Questions
1. What is the projected Compound Annual Growth Rate (CAGR) of the Rice Milk Industry?
The projected CAGR is approximately 5.28%.
2. Which companies are prominent players in the Rice Milk Industry?
Key companies in the market include Pureharvest Pty ltd, Gan Teck Kar Foods, The Bridge s r l, Fine Japan Co Ltd, Nature's Choice, The Hain Celestial Group Inc, WhiteWave Foods, Vitasoy Australia Products Pty Ltd, Ebro Foods (Tilda), Linda MacCartney Foods, SunOpta Inc, Panos Brands LLC (Better Than Milk).
3. What are the main segments of the Rice Milk Industry?
The market segments include Form, Source, Distribution Channel.
4. Can you provide details about the market size?
The market size is estimated to be USD 277.08 Million as of 2022.
5. What are some drivers contributing to market growth?
The prevalence of lactose intolerance and dairy allergies is leading consumers to seek non-dairy alternatives. making rice milk an attractive option for those with dietary restrictions..
6. What are the notable trends driving market growth?
There is a growing trend toward fortified rice milk products that address the nutritional gaps compared to dairy milk. such as low protein content..
7. Are there any restraints impacting market growth?
Rice milk is lower in protein compared to other plant-based milks like soy or almond milk. which may deter some consumers seeking more balanced nutrition.
8. Can you provide examples of recent developments in the market?
February 2022: Ebro Foods subsidiary Tilda Rice launched plant-based sweet rice milk. The rice milk is made with natural and organic ingredients with 16% rice content. The company claims that this product includes more percentage of rice than any other brand and it is free from artificial sweeteners and added sugar.
9. What pricing options are available for accessing the report?
Pricing options include single-user, multi-user, and enterprise licenses priced at USD 4750, USD 5250, and USD 8750 respectively.
10. Is the market size provided in terms of value or volume?
The market size is provided in terms of value, measured in Million.
11. Are there any specific market keywords associated with the report?
Yes, the market keyword associated with the report is "Rice Milk Industry," which aids in identifying and referencing the specific market segment covered.
12. How do I determine which pricing option suits my needs best?
The pricing options vary based on user requirements and access needs. Individual users may opt for single-user licenses, while businesses requiring broader access may choose multi-user or enterprise licenses for cost-effective access to the report.
13. Are there any additional resources or data provided in the Rice Milk Industry report?
While the report offers comprehensive insights, it's advisable to review the specific contents or supplementary materials provided to ascertain if additional resources or data are available.
14. How can I stay updated on further developments or reports in the Rice Milk Industry?
To stay informed about further developments, trends, and reports in the Rice Milk Industry, consider subscribing to industry newsletters, following relevant companies and organizations, or regularly checking reputable industry news sources and publications.
Methodology
Step 1 - Identification of Relevant Samples Size from Population Database


Step 2 - Approaches for Defining Global Market Size (Value, Volume* & Price*)

Note*: In applicable scenarios
Step 3 - Data Sources
Primary Research
- Web Analytics
- Survey Reports
- Research Institute
- Latest Research Reports
- Opinion Leaders
Secondary Research
- Annual Reports
- White Paper
- Latest Press Release
- Industry Association
- Paid Database
- Investor Presentations

Step 4 - Data Triangulation
Involves using different sources of information in order to increase the validity of a study
These sources are likely to be stakeholders in a program - participants, other researchers, program staff, other community members, and so on.
Then we put all data in single framework & apply various statistical tools to find out the dynamic on the market.
During the analysis stage, feedback from the stakeholder groups would be compared to determine areas of agreement as well as areas of divergence
