

Key Insights
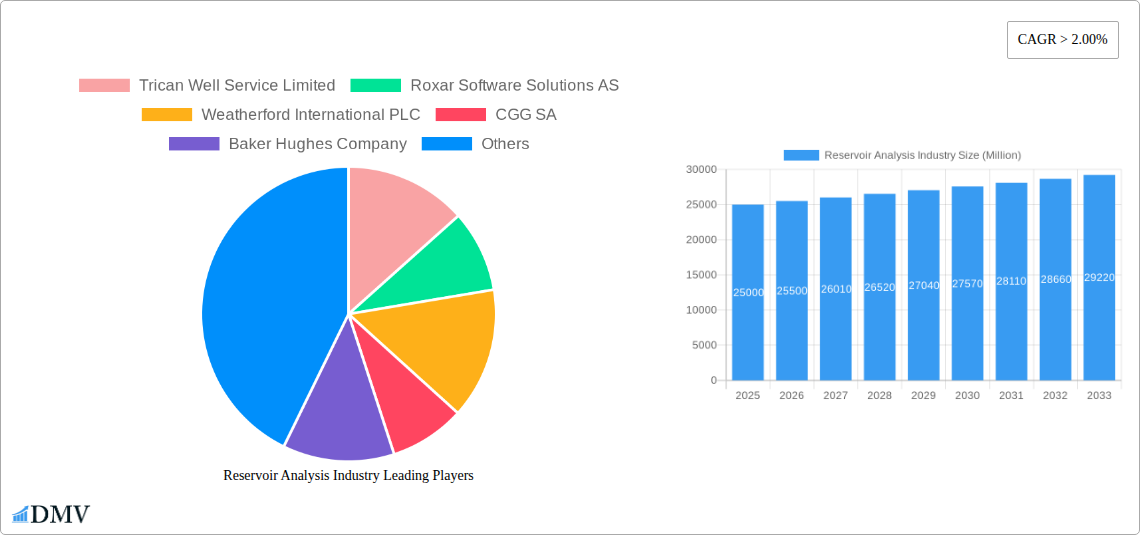
The global reservoir analysis market is experiencing robust growth, driven by the increasing demand for efficient oil and gas exploration and production. The market's Compound Annual Growth Rate (CAGR) exceeding 2.00% signifies a steady expansion, projected to reach a significant market size over the forecast period (2025-2033). This growth is fueled by several key factors. Firstly, advancements in data acquisition and processing technologies, such as high-resolution seismic imaging and advanced reservoir simulation software (like those offered by Roxar and Schlumberger), enable more accurate characterization of subsurface reservoirs. Secondly, the exploration and development of unconventional resources, including shale gas and tight oil, necessitate sophisticated reservoir analysis techniques to optimize production from complex geological formations. This increased complexity directly boosts demand for services like geo-modeling and reservoir sampling offered by companies like Trican Well Service and Core Laboratories. Thirdly, the ongoing digitalization of the oil and gas industry, encompassing the integration of IoT sensors and big data analytics, contributes to enhanced reservoir management and increased operational efficiency, further driving market growth. Finally, stricter environmental regulations and the need for sustainable resource management are pushing companies to adopt advanced reservoir analysis methods for maximizing recovery and minimizing environmental impact.
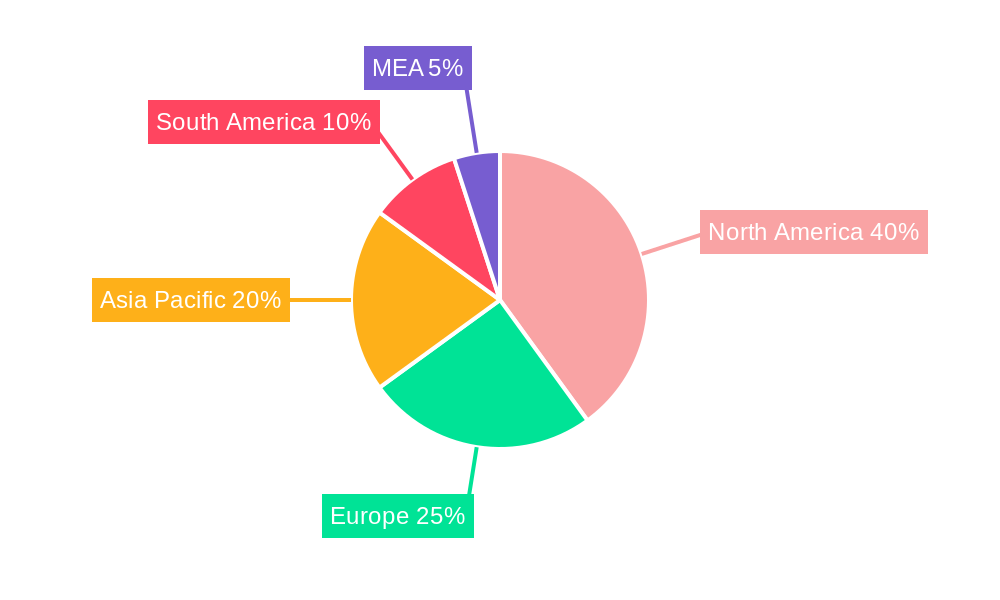
Despite the positive outlook, the market faces certain challenges. The volatility of oil and gas prices can significantly impact investment decisions in exploration and production activities, potentially slowing down the adoption of advanced reservoir analysis technologies. Furthermore, the high initial investment cost associated with implementing sophisticated software and hardware can be a barrier for smaller companies. However, the long-term benefits of improved reservoir understanding and optimized production outweigh these short-term challenges, ensuring continued growth in the market. Geographic distribution shows strong demand in North America (particularly the US), driven by extensive shale gas development, alongside significant potential in the Asia-Pacific region due to growing energy demand and ongoing exploration activities in countries like China and India. The market segmentation by reservoir type (conventional and unconventional), service type (geo-modeling, simulation, etc.), and application (onshore and offshore) provides valuable insights into the specific needs and growth opportunities within this dynamic sector.
Reservoir Analysis Industry: A Comprehensive Market Report (2019-2033)
This insightful report provides a detailed analysis of the Reservoir Analysis Industry, encompassing market size, growth trajectories, key players, and future opportunities. The study period covers 2019-2033, with 2025 as the base and estimated year. The report leverages extensive data analysis to provide stakeholders with actionable insights for strategic decision-making. The global market is projected to reach xx Million by 2033, exhibiting a Compound Annual Growth Rate (CAGR) of xx% during the forecast period (2025-2033).
Reservoir Analysis Industry Market Composition & Trends
The Reservoir Analysis Industry is characterized by a moderately concentrated market landscape, with key players like Schlumberger Limited, Halliburton Company, Baker Hughes Company, CGG SA, and Weatherford International PLC holding significant market share. The combined market share of these top five companies is estimated at xx Million in 2025. Innovation is driven by the need for enhanced reservoir characterization techniques to optimize hydrocarbon recovery from both conventional and unconventional reservoirs. Stringent environmental regulations and the push for sustainable oil and gas extraction are shaping the industry's trajectory. Substitute products, including advanced seismic imaging and machine learning algorithms, are continuously challenging traditional methods. The industry is witnessing increased M&A activity, with deal values exceeding xx Million in the past five years. These activities aim to consolidate market share, expand service offerings, and access new technologies.
- Market Share Distribution (2025): Schlumberger (xx%), Halliburton (xx%), Baker Hughes (xx%), CGG (xx%), Weatherford (xx%), Others (xx%).
- M&A Activity (2019-2024): Total Deal Value exceeding xx Million.
- Key End-Users: National Oil Companies (NOCs), Independent Oil and Gas Companies (IOCs), and Service Companies.
Reservoir Analysis Industry Industry Evolution
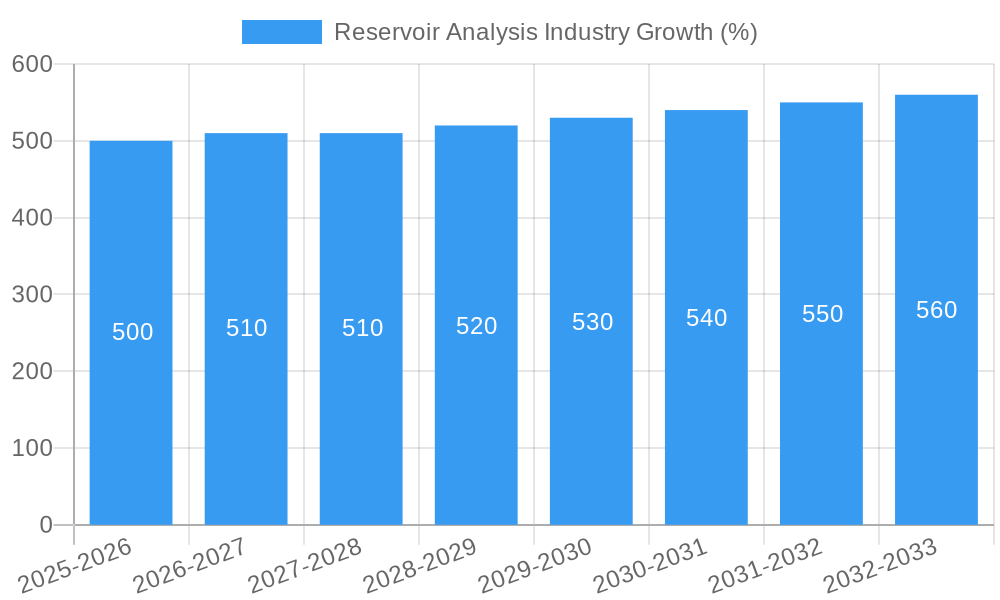
The Reservoir Analysis Industry has witnessed significant evolution, driven by technological advancements and shifting industry demands. The historical period (2019-2024) saw steady growth, fueled by increased exploration and production activities in both onshore and offshore segments. However, the growth rate experienced a slight dip during the initial phase of the COVID-19 pandemic, followed by a robust recovery. Technological advancements such as improved seismic imaging, advanced reservoir simulation software, and the application of artificial intelligence (AI) and machine learning (ML) are transforming reservoir characterization and management. The increasing adoption of digital oilfield technologies is streamlining workflows and enhancing operational efficiency. Consumer demand is increasingly focused on cost-effective and environmentally friendly solutions, driving the need for innovative technologies that improve hydrocarbon recovery while minimizing environmental impact. The market growth trajectory is expected to remain positive, driven by factors like increased investment in exploration and production, particularly in unconventional resources.
Leading Regions, Countries, or Segments in Reservoir Analysis Industry
- Dominant Region: North America (US, Canada) holds the largest market share due to significant exploration and production activities in unconventional shale gas and oil resources, coupled with substantial investments in technological advancements.
- Dominant Segment (Reservoir Type): The unconventional segment is experiencing the fastest growth rate, driven by the increasing focus on shale gas and tight oil extraction.
- Dominant Segment (Service): Reservoir simulation software and services are currently the largest segment, owing to their importance in optimizing hydrocarbon recovery and reducing operational costs.
- Dominant Segment (Application): The onshore segment maintains a larger market share due to the significant presence of conventional and unconventional oil and gas fields.
Key Drivers:
- North America: High levels of investment in unconventional resource extraction, supportive regulatory framework, robust technological infrastructure.
- Unconventional Reservoirs: Growing demand for energy, technological advancements enabling efficient extraction from tight formations, significant reserves.
- Reservoir Simulation: Crucial for optimizing production strategies, improving recovery factors, and reducing operational risks.
Reservoir Analysis Industry Product Innovations
Recent innovations include the development of high-resolution 3D seismic imaging techniques, enhanced reservoir simulation software incorporating machine learning algorithms, and improved data acquisition and monitoring systems integrating IoT sensors for real-time reservoir monitoring. These innovations offer unique selling propositions through improved accuracy, reduced computational times, and enhanced decision-making capabilities. The adoption of cloud-based platforms is also enabling improved collaboration and data sharing amongst stakeholders.
Propelling Factors for Reservoir Analysis Industry Growth
Growth is driven by increased exploration and production activities globally, especially in unconventional reservoirs, the need for improved reservoir characterization techniques for enhanced oil recovery (EOR), and government initiatives promoting technological advancements in oil and gas exploration. Investment in digital oilfield technologies further fuels growth, while the rising demand for energy worldwide continues to underpin market expansion.
Obstacles in the Reservoir Analysis Industry Market
The industry faces challenges such as fluctuating oil and gas prices, which impact investment decisions. Supply chain disruptions and the availability of skilled labor also pose limitations. Furthermore, stringent environmental regulations and the increasing focus on carbon emissions reduction create operational and cost pressures. Intense competition among established players and new entrants adds to the challenges.
Future Opportunities in Reservoir Analysis Industry
Emerging opportunities exist in the application of AI and ML for automated reservoir characterization, the development of more sustainable and environmentally friendly reservoir management techniques, and the expansion into new geographical regions with significant exploration potential. The increasing adoption of integrated reservoir simulation platforms and improved data analytics capabilities will present new opportunities for growth and value creation.
Major Players in the Reservoir Analysis Industry Ecosystem
- Trican Well Service Limited
- Roxar Software Solutions AS
- Weatherford International PLC
- CGG SA
- Baker Hughes Company
- Halliburton Company
- Core Laboratories N V
- Schlumberger Limited
Key Developments in Reservoir Analysis Industry Industry
- December 2022: ADNOC Offshore awarded two major software contracts (value: xx Million) to Kappa and Amarile, boosting the adoption of advanced reservoir simulation software. This signifies a shift towards more sophisticated technologies for reservoir management.
- June 2022: CGG secured a four-year contract extension with Petrobras, demonstrating the long-term value and reliability of their reservoir services. This strengthens CGG's market position and underscores the demand for their expertise.
Strategic Reservoir Analysis Industry Market Forecast
The Reservoir Analysis Industry is poised for continued growth driven by technological innovations, increased investment in exploration and production, and the demand for optimized hydrocarbon recovery. Future opportunities lie in the application of advanced analytics, AI, and machine learning to enhance reservoir understanding and decision-making. The market is expected to witness strong growth in the coming years, with significant potential for expansion into new geographical regions and unconventional resource development.
Reservoir Analysis Industry Segmentation
-
1. Application
- 1.1. Onshore
- 1.2. Offshore
-
2. Reservoir Type
- 2.1. Conventional
- 2.2. Unconventional
-
3. Service
- 3.1. Geo Modeling
- 3.2. Reservoir Simulation
- 3.3. Data Acquisition and Monitoring
- 3.4. Reservoir Sampling
- 3.5. Others
Reservoir Analysis Industry Segmentation By Geography
- 1. North America
- 2. Asia Pacific
- 3. Europe
- 4. South America
- 5. Middle East and Africa
Reservoir Analysis Industry REPORT HIGHLIGHTS
| Aspects | Details |
|---|---|
| Study Period | 2019-2033 |
| Base Year | 2024 |
| Estimated Year | 2025 |
| Forecast Period | 2025-2033 |
| Historical Period | 2019-2024 |
| Growth Rate | CAGR of > 2.00% from 2019-2033 |
| Segmentation |
|
Table of Contents
- 1. Introduction
- 1.1. Research Scope
- 1.2. Market Segmentation
- 1.3. Research Methodology
- 1.4. Definitions and Assumptions
- 2. Executive Summary
- 2.1. Introduction
- 3. Market Dynamics
- 3.1. Introduction
- 3.2. Market Drivers
- 3.2.1. 4.; Increasing Automotive Sales in Saudi Arabia4.; Rising Demand from Heavy Automotives
- 3.3. Market Restrains
- 3.3.1. 4.; Rising Emphasis on Electric Vehicles
- 3.4. Market Trends
- 3.4.1. Unconventional Segment to Witness Fastest Growth
- 4. Market Factor Analysis
- 4.1. Porters Five Forces
- 4.2. Supply/Value Chain
- 4.3. PESTEL analysis
- 4.4. Market Entropy
- 4.5. Patent/Trademark Analysis
- 5. Global Reservoir Analysis Industry Analysis, Insights and Forecast, 2019-2031
- 5.1. Market Analysis, Insights and Forecast - by Application
- 5.1.1. Onshore
- 5.1.2. Offshore
- 5.2. Market Analysis, Insights and Forecast - by Reservoir Type
- 5.2.1. Conventional
- 5.2.2. Unconventional
- 5.3. Market Analysis, Insights and Forecast - by Service
- 5.3.1. Geo Modeling
- 5.3.2. Reservoir Simulation
- 5.3.3. Data Acquisition and Monitoring
- 5.3.4. Reservoir Sampling
- 5.3.5. Others
- 5.4. Market Analysis, Insights and Forecast - by Region
- 5.4.1. North America
- 5.4.2. Asia Pacific
- 5.4.3. Europe
- 5.4.4. South America
- 5.4.5. Middle East and Africa
- 5.1. Market Analysis, Insights and Forecast - by Application
- 6. North America Reservoir Analysis Industry Analysis, Insights and Forecast, 2019-2031
- 6.1. Market Analysis, Insights and Forecast - by Application
- 6.1.1. Onshore
- 6.1.2. Offshore
- 6.2. Market Analysis, Insights and Forecast - by Reservoir Type
- 6.2.1. Conventional
- 6.2.2. Unconventional
- 6.3. Market Analysis, Insights and Forecast - by Service
- 6.3.1. Geo Modeling
- 6.3.2. Reservoir Simulation
- 6.3.3. Data Acquisition and Monitoring
- 6.3.4. Reservoir Sampling
- 6.3.5. Others
- 6.1. Market Analysis, Insights and Forecast - by Application
- 7. Asia Pacific Reservoir Analysis Industry Analysis, Insights and Forecast, 2019-2031
- 7.1. Market Analysis, Insights and Forecast - by Application
- 7.1.1. Onshore
- 7.1.2. Offshore
- 7.2. Market Analysis, Insights and Forecast - by Reservoir Type
- 7.2.1. Conventional
- 7.2.2. Unconventional
- 7.3. Market Analysis, Insights and Forecast - by Service
- 7.3.1. Geo Modeling
- 7.3.2. Reservoir Simulation
- 7.3.3. Data Acquisition and Monitoring
- 7.3.4. Reservoir Sampling
- 7.3.5. Others
- 7.1. Market Analysis, Insights and Forecast - by Application
- 8. Europe Reservoir Analysis Industry Analysis, Insights and Forecast, 2019-2031
- 8.1. Market Analysis, Insights and Forecast - by Application
- 8.1.1. Onshore
- 8.1.2. Offshore
- 8.2. Market Analysis, Insights and Forecast - by Reservoir Type
- 8.2.1. Conventional
- 8.2.2. Unconventional
- 8.3. Market Analysis, Insights and Forecast - by Service
- 8.3.1. Geo Modeling
- 8.3.2. Reservoir Simulation
- 8.3.3. Data Acquisition and Monitoring
- 8.3.4. Reservoir Sampling
- 8.3.5. Others
- 8.1. Market Analysis, Insights and Forecast - by Application
- 9. South America Reservoir Analysis Industry Analysis, Insights and Forecast, 2019-2031
- 9.1. Market Analysis, Insights and Forecast - by Application
- 9.1.1. Onshore
- 9.1.2. Offshore
- 9.2. Market Analysis, Insights and Forecast - by Reservoir Type
- 9.2.1. Conventional
- 9.2.2. Unconventional
- 9.3. Market Analysis, Insights and Forecast - by Service
- 9.3.1. Geo Modeling
- 9.3.2. Reservoir Simulation
- 9.3.3. Data Acquisition and Monitoring
- 9.3.4. Reservoir Sampling
- 9.3.5. Others
- 9.1. Market Analysis, Insights and Forecast - by Application
- 10. Middle East and Africa Reservoir Analysis Industry Analysis, Insights and Forecast, 2019-2031
- 10.1. Market Analysis, Insights and Forecast - by Application
- 10.1.1. Onshore
- 10.1.2. Offshore
- 10.2. Market Analysis, Insights and Forecast - by Reservoir Type
- 10.2.1. Conventional
- 10.2.2. Unconventional
- 10.3. Market Analysis, Insights and Forecast - by Service
- 10.3.1. Geo Modeling
- 10.3.2. Reservoir Simulation
- 10.3.3. Data Acquisition and Monitoring
- 10.3.4. Reservoir Sampling
- 10.3.5. Others
- 10.1. Market Analysis, Insights and Forecast - by Application
- 11. North America Reservoir Analysis Industry Analysis, Insights and Forecast, 2019-2031
- 11.1. Market Analysis, Insights and Forecast - By Country/Sub-region
- 11.1.1 United States
- 11.1.2 Canada
- 11.1.3 Mexico
- 12. Europe Reservoir Analysis Industry Analysis, Insights and Forecast, 2019-2031
- 12.1. Market Analysis, Insights and Forecast - By Country/Sub-region
- 12.1.1 Germany
- 12.1.2 United Kingdom
- 12.1.3 France
- 12.1.4 Spain
- 12.1.5 Italy
- 12.1.6 Spain
- 12.1.7 Belgium
- 12.1.8 Netherland
- 12.1.9 Nordics
- 12.1.10 Rest of Europe
- 13. Asia Pacific Reservoir Analysis Industry Analysis, Insights and Forecast, 2019-2031
- 13.1. Market Analysis, Insights and Forecast - By Country/Sub-region
- 13.1.1 China
- 13.1.2 Japan
- 13.1.3 India
- 13.1.4 South Korea
- 13.1.5 Southeast Asia
- 13.1.6 Australia
- 13.1.7 Indonesia
- 13.1.8 Phillipes
- 13.1.9 Singapore
- 13.1.10 Thailandc
- 13.1.11 Rest of Asia Pacific
- 14. South America Reservoir Analysis Industry Analysis, Insights and Forecast, 2019-2031
- 14.1. Market Analysis, Insights and Forecast - By Country/Sub-region
- 14.1.1 Brazil
- 14.1.2 Argentina
- 14.1.3 Peru
- 14.1.4 Chile
- 14.1.5 Colombia
- 14.1.6 Ecuador
- 14.1.7 Venezuela
- 14.1.8 Rest of South America
- 15. MEA Reservoir Analysis Industry Analysis, Insights and Forecast, 2019-2031
- 15.1. Market Analysis, Insights and Forecast - By Country/Sub-region
- 15.1.1 United Arab Emirates
- 15.1.2 Saudi Arabia
- 15.1.3 South Africa
- 15.1.4 Rest of Middle East and Africa
- 16. Competitive Analysis
- 16.1. Global Market Share Analysis 2024
- 16.2. Company Profiles
- 16.2.1 Trican Well Service Limited
- 16.2.1.1. Overview
- 16.2.1.2. Products
- 16.2.1.3. SWOT Analysis
- 16.2.1.4. Recent Developments
- 16.2.1.5. Financials (Based on Availability)
- 16.2.2 Roxar Software Solutions AS
- 16.2.2.1. Overview
- 16.2.2.2. Products
- 16.2.2.3. SWOT Analysis
- 16.2.2.4. Recent Developments
- 16.2.2.5. Financials (Based on Availability)
- 16.2.3 Weatherford International PLC
- 16.2.3.1. Overview
- 16.2.3.2. Products
- 16.2.3.3. SWOT Analysis
- 16.2.3.4. Recent Developments
- 16.2.3.5. Financials (Based on Availability)
- 16.2.4 CGG SA
- 16.2.4.1. Overview
- 16.2.4.2. Products
- 16.2.4.3. SWOT Analysis
- 16.2.4.4. Recent Developments
- 16.2.4.5. Financials (Based on Availability)
- 16.2.5 Baker Hughes Company
- 16.2.5.1. Overview
- 16.2.5.2. Products
- 16.2.5.3. SWOT Analysis
- 16.2.5.4. Recent Developments
- 16.2.5.5. Financials (Based on Availability)
- 16.2.6 Halliburton Company
- 16.2.6.1. Overview
- 16.2.6.2. Products
- 16.2.6.3. SWOT Analysis
- 16.2.6.4. Recent Developments
- 16.2.6.5. Financials (Based on Availability)
- 16.2.7 Core Laboratories N V
- 16.2.7.1. Overview
- 16.2.7.2. Products
- 16.2.7.3. SWOT Analysis
- 16.2.7.4. Recent Developments
- 16.2.7.5. Financials (Based on Availability)
- 16.2.8 Schlumberger Limited
- 16.2.8.1. Overview
- 16.2.8.2. Products
- 16.2.8.3. SWOT Analysis
- 16.2.8.4. Recent Developments
- 16.2.8.5. Financials (Based on Availability)
- 16.2.1 Trican Well Service Limited
List of Figures
- Figure 1: Global Reservoir Analysis Industry Revenue Breakdown (Million, %) by Region 2024 & 2032
- Figure 2: North America Reservoir Analysis Industry Revenue (Million), by Country 2024 & 2032
- Figure 3: North America Reservoir Analysis Industry Revenue Share (%), by Country 2024 & 2032
- Figure 4: Europe Reservoir Analysis Industry Revenue (Million), by Country 2024 & 2032
- Figure 5: Europe Reservoir Analysis Industry Revenue Share (%), by Country 2024 & 2032
- Figure 6: Asia Pacific Reservoir Analysis Industry Revenue (Million), by Country 2024 & 2032
- Figure 7: Asia Pacific Reservoir Analysis Industry Revenue Share (%), by Country 2024 & 2032
- Figure 8: South America Reservoir Analysis Industry Revenue (Million), by Country 2024 & 2032
- Figure 9: South America Reservoir Analysis Industry Revenue Share (%), by Country 2024 & 2032
- Figure 10: MEA Reservoir Analysis Industry Revenue (Million), by Country 2024 & 2032
- Figure 11: MEA Reservoir Analysis Industry Revenue Share (%), by Country 2024 & 2032
- Figure 12: North America Reservoir Analysis Industry Revenue (Million), by Application 2024 & 2032
- Figure 13: North America Reservoir Analysis Industry Revenue Share (%), by Application 2024 & 2032
- Figure 14: North America Reservoir Analysis Industry Revenue (Million), by Reservoir Type 2024 & 2032
- Figure 15: North America Reservoir Analysis Industry Revenue Share (%), by Reservoir Type 2024 & 2032
- Figure 16: North America Reservoir Analysis Industry Revenue (Million), by Service 2024 & 2032
- Figure 17: North America Reservoir Analysis Industry Revenue Share (%), by Service 2024 & 2032
- Figure 18: North America Reservoir Analysis Industry Revenue (Million), by Country 2024 & 2032
- Figure 19: North America Reservoir Analysis Industry Revenue Share (%), by Country 2024 & 2032
- Figure 20: Asia Pacific Reservoir Analysis Industry Revenue (Million), by Application 2024 & 2032
- Figure 21: Asia Pacific Reservoir Analysis Industry Revenue Share (%), by Application 2024 & 2032
- Figure 22: Asia Pacific Reservoir Analysis Industry Revenue (Million), by Reservoir Type 2024 & 2032
- Figure 23: Asia Pacific Reservoir Analysis Industry Revenue Share (%), by Reservoir Type 2024 & 2032
- Figure 24: Asia Pacific Reservoir Analysis Industry Revenue (Million), by Service 2024 & 2032
- Figure 25: Asia Pacific Reservoir Analysis Industry Revenue Share (%), by Service 2024 & 2032
- Figure 26: Asia Pacific Reservoir Analysis Industry Revenue (Million), by Country 2024 & 2032
- Figure 27: Asia Pacific Reservoir Analysis Industry Revenue Share (%), by Country 2024 & 2032
- Figure 28: Europe Reservoir Analysis Industry Revenue (Million), by Application 2024 & 2032
- Figure 29: Europe Reservoir Analysis Industry Revenue Share (%), by Application 2024 & 2032
- Figure 30: Europe Reservoir Analysis Industry Revenue (Million), by Reservoir Type 2024 & 2032
- Figure 31: Europe Reservoir Analysis Industry Revenue Share (%), by Reservoir Type 2024 & 2032
- Figure 32: Europe Reservoir Analysis Industry Revenue (Million), by Service 2024 & 2032
- Figure 33: Europe Reservoir Analysis Industry Revenue Share (%), by Service 2024 & 2032
- Figure 34: Europe Reservoir Analysis Industry Revenue (Million), by Country 2024 & 2032
- Figure 35: Europe Reservoir Analysis Industry Revenue Share (%), by Country 2024 & 2032
- Figure 36: South America Reservoir Analysis Industry Revenue (Million), by Application 2024 & 2032
- Figure 37: South America Reservoir Analysis Industry Revenue Share (%), by Application 2024 & 2032
- Figure 38: South America Reservoir Analysis Industry Revenue (Million), by Reservoir Type 2024 & 2032
- Figure 39: South America Reservoir Analysis Industry Revenue Share (%), by Reservoir Type 2024 & 2032
- Figure 40: South America Reservoir Analysis Industry Revenue (Million), by Service 2024 & 2032
- Figure 41: South America Reservoir Analysis Industry Revenue Share (%), by Service 2024 & 2032
- Figure 42: South America Reservoir Analysis Industry Revenue (Million), by Country 2024 & 2032
- Figure 43: South America Reservoir Analysis Industry Revenue Share (%), by Country 2024 & 2032
- Figure 44: Middle East and Africa Reservoir Analysis Industry Revenue (Million), by Application 2024 & 2032
- Figure 45: Middle East and Africa Reservoir Analysis Industry Revenue Share (%), by Application 2024 & 2032
- Figure 46: Middle East and Africa Reservoir Analysis Industry Revenue (Million), by Reservoir Type 2024 & 2032
- Figure 47: Middle East and Africa Reservoir Analysis Industry Revenue Share (%), by Reservoir Type 2024 & 2032
- Figure 48: Middle East and Africa Reservoir Analysis Industry Revenue (Million), by Service 2024 & 2032
- Figure 49: Middle East and Africa Reservoir Analysis Industry Revenue Share (%), by Service 2024 & 2032
- Figure 50: Middle East and Africa Reservoir Analysis Industry Revenue (Million), by Country 2024 & 2032
- Figure 51: Middle East and Africa Reservoir Analysis Industry Revenue Share (%), by Country 2024 & 2032
List of Tables
- Table 1: Global Reservoir Analysis Industry Revenue Million Forecast, by Region 2019 & 2032
- Table 2: Global Reservoir Analysis Industry Revenue Million Forecast, by Application 2019 & 2032
- Table 3: Global Reservoir Analysis Industry Revenue Million Forecast, by Reservoir Type 2019 & 2032
- Table 4: Global Reservoir Analysis Industry Revenue Million Forecast, by Service 2019 & 2032
- Table 5: Global Reservoir Analysis Industry Revenue Million Forecast, by Region 2019 & 2032
- Table 6: Global Reservoir Analysis Industry Revenue Million Forecast, by Country 2019 & 2032
- Table 7: United States Reservoir Analysis Industry Revenue (Million) Forecast, by Application 2019 & 2032
- Table 8: Canada Reservoir Analysis Industry Revenue (Million) Forecast, by Application 2019 & 2032
- Table 9: Mexico Reservoir Analysis Industry Revenue (Million) Forecast, by Application 2019 & 2032
- Table 10: Global Reservoir Analysis Industry Revenue Million Forecast, by Country 2019 & 2032
- Table 11: Germany Reservoir Analysis Industry Revenue (Million) Forecast, by Application 2019 & 2032
- Table 12: United Kingdom Reservoir Analysis Industry Revenue (Million) Forecast, by Application 2019 & 2032
- Table 13: France Reservoir Analysis Industry Revenue (Million) Forecast, by Application 2019 & 2032
- Table 14: Spain Reservoir Analysis Industry Revenue (Million) Forecast, by Application 2019 & 2032
- Table 15: Italy Reservoir Analysis Industry Revenue (Million) Forecast, by Application 2019 & 2032
- Table 16: Spain Reservoir Analysis Industry Revenue (Million) Forecast, by Application 2019 & 2032
- Table 17: Belgium Reservoir Analysis Industry Revenue (Million) Forecast, by Application 2019 & 2032
- Table 18: Netherland Reservoir Analysis Industry Revenue (Million) Forecast, by Application 2019 & 2032
- Table 19: Nordics Reservoir Analysis Industry Revenue (Million) Forecast, by Application 2019 & 2032
- Table 20: Rest of Europe Reservoir Analysis Industry Revenue (Million) Forecast, by Application 2019 & 2032
- Table 21: Global Reservoir Analysis Industry Revenue Million Forecast, by Country 2019 & 2032
- Table 22: China Reservoir Analysis Industry Revenue (Million) Forecast, by Application 2019 & 2032
- Table 23: Japan Reservoir Analysis Industry Revenue (Million) Forecast, by Application 2019 & 2032
- Table 24: India Reservoir Analysis Industry Revenue (Million) Forecast, by Application 2019 & 2032
- Table 25: South Korea Reservoir Analysis Industry Revenue (Million) Forecast, by Application 2019 & 2032
- Table 26: Southeast Asia Reservoir Analysis Industry Revenue (Million) Forecast, by Application 2019 & 2032
- Table 27: Australia Reservoir Analysis Industry Revenue (Million) Forecast, by Application 2019 & 2032
- Table 28: Indonesia Reservoir Analysis Industry Revenue (Million) Forecast, by Application 2019 & 2032
- Table 29: Phillipes Reservoir Analysis Industry Revenue (Million) Forecast, by Application 2019 & 2032
- Table 30: Singapore Reservoir Analysis Industry Revenue (Million) Forecast, by Application 2019 & 2032
- Table 31: Thailandc Reservoir Analysis Industry Revenue (Million) Forecast, by Application 2019 & 2032
- Table 32: Rest of Asia Pacific Reservoir Analysis Industry Revenue (Million) Forecast, by Application 2019 & 2032
- Table 33: Global Reservoir Analysis Industry Revenue Million Forecast, by Country 2019 & 2032
- Table 34: Brazil Reservoir Analysis Industry Revenue (Million) Forecast, by Application 2019 & 2032
- Table 35: Argentina Reservoir Analysis Industry Revenue (Million) Forecast, by Application 2019 & 2032
- Table 36: Peru Reservoir Analysis Industry Revenue (Million) Forecast, by Application 2019 & 2032
- Table 37: Chile Reservoir Analysis Industry Revenue (Million) Forecast, by Application 2019 & 2032
- Table 38: Colombia Reservoir Analysis Industry Revenue (Million) Forecast, by Application 2019 & 2032
- Table 39: Ecuador Reservoir Analysis Industry Revenue (Million) Forecast, by Application 2019 & 2032
- Table 40: Venezuela Reservoir Analysis Industry Revenue (Million) Forecast, by Application 2019 & 2032
- Table 41: Rest of South America Reservoir Analysis Industry Revenue (Million) Forecast, by Application 2019 & 2032
- Table 42: Global Reservoir Analysis Industry Revenue Million Forecast, by Country 2019 & 2032
- Table 43: United Arab Emirates Reservoir Analysis Industry Revenue (Million) Forecast, by Application 2019 & 2032
- Table 44: Saudi Arabia Reservoir Analysis Industry Revenue (Million) Forecast, by Application 2019 & 2032
- Table 45: South Africa Reservoir Analysis Industry Revenue (Million) Forecast, by Application 2019 & 2032
- Table 46: Rest of Middle East and Africa Reservoir Analysis Industry Revenue (Million) Forecast, by Application 2019 & 2032
- Table 47: Global Reservoir Analysis Industry Revenue Million Forecast, by Application 2019 & 2032
- Table 48: Global Reservoir Analysis Industry Revenue Million Forecast, by Reservoir Type 2019 & 2032
- Table 49: Global Reservoir Analysis Industry Revenue Million Forecast, by Service 2019 & 2032
- Table 50: Global Reservoir Analysis Industry Revenue Million Forecast, by Country 2019 & 2032
- Table 51: Global Reservoir Analysis Industry Revenue Million Forecast, by Application 2019 & 2032
- Table 52: Global Reservoir Analysis Industry Revenue Million Forecast, by Reservoir Type 2019 & 2032
- Table 53: Global Reservoir Analysis Industry Revenue Million Forecast, by Service 2019 & 2032
- Table 54: Global Reservoir Analysis Industry Revenue Million Forecast, by Country 2019 & 2032
- Table 55: Global Reservoir Analysis Industry Revenue Million Forecast, by Application 2019 & 2032
- Table 56: Global Reservoir Analysis Industry Revenue Million Forecast, by Reservoir Type 2019 & 2032
- Table 57: Global Reservoir Analysis Industry Revenue Million Forecast, by Service 2019 & 2032
- Table 58: Global Reservoir Analysis Industry Revenue Million Forecast, by Country 2019 & 2032
- Table 59: Global Reservoir Analysis Industry Revenue Million Forecast, by Application 2019 & 2032
- Table 60: Global Reservoir Analysis Industry Revenue Million Forecast, by Reservoir Type 2019 & 2032
- Table 61: Global Reservoir Analysis Industry Revenue Million Forecast, by Service 2019 & 2032
- Table 62: Global Reservoir Analysis Industry Revenue Million Forecast, by Country 2019 & 2032
- Table 63: Global Reservoir Analysis Industry Revenue Million Forecast, by Application 2019 & 2032
- Table 64: Global Reservoir Analysis Industry Revenue Million Forecast, by Reservoir Type 2019 & 2032
- Table 65: Global Reservoir Analysis Industry Revenue Million Forecast, by Service 2019 & 2032
- Table 66: Global Reservoir Analysis Industry Revenue Million Forecast, by Country 2019 & 2032
Frequently Asked Questions
1. What is the projected Compound Annual Growth Rate (CAGR) of the Reservoir Analysis Industry?
The projected CAGR is approximately > 2.00%.
2. Which companies are prominent players in the Reservoir Analysis Industry?
Key companies in the market include Trican Well Service Limited, Roxar Software Solutions AS, Weatherford International PLC, CGG SA, Baker Hughes Company, Halliburton Company, Core Laboratories N V, Schlumberger Limited.
3. What are the main segments of the Reservoir Analysis Industry?
The market segments include Application, Reservoir Type, Service.
4. Can you provide details about the market size?
The market size is estimated to be USD XX Million as of 2022.
5. What are some drivers contributing to market growth?
4.; Increasing Automotive Sales in Saudi Arabia4.; Rising Demand from Heavy Automotives.
6. What are the notable trends driving market growth?
Unconventional Segment to Witness Fastest Growth.
7. Are there any restraints impacting market growth?
4.; Rising Emphasis on Electric Vehicles.
8. Can you provide examples of recent developments in the market?
December 2022: ADNOC Offshore awarded two major software contracts to Dome Principals, Kappa, and Amarile. Kappa, a petroleum engineering software company, will provide ADNOC with different types of Reservoir Related Software Management Systems such as EMERAUDE,SAPHIRE, TOPAZ, etc. Amarile is a company helping Reservoir Engineers speed up and improve the quality of their field dynamic simulation workflow.
9. What pricing options are available for accessing the report?
Pricing options include single-user, multi-user, and enterprise licenses priced at USD 4750, USD 5250, and USD 8750 respectively.
10. Is the market size provided in terms of value or volume?
The market size is provided in terms of value, measured in Million.
11. Are there any specific market keywords associated with the report?
Yes, the market keyword associated with the report is "Reservoir Analysis Industry," which aids in identifying and referencing the specific market segment covered.
12. How do I determine which pricing option suits my needs best?
The pricing options vary based on user requirements and access needs. Individual users may opt for single-user licenses, while businesses requiring broader access may choose multi-user or enterprise licenses for cost-effective access to the report.
13. Are there any additional resources or data provided in the Reservoir Analysis Industry report?
While the report offers comprehensive insights, it's advisable to review the specific contents or supplementary materials provided to ascertain if additional resources or data are available.
14. How can I stay updated on further developments or reports in the Reservoir Analysis Industry?
To stay informed about further developments, trends, and reports in the Reservoir Analysis Industry, consider subscribing to industry newsletters, following relevant companies and organizations, or regularly checking reputable industry news sources and publications.
Methodology
Step 1 - Identification of Relevant Samples Size from Population Database


Step 2 - Approaches for Defining Global Market Size (Value, Volume* & Price*)

Note*: In applicable scenarios
Step 3 - Data Sources
Primary Research
- Web Analytics
- Survey Reports
- Research Institute
- Latest Research Reports
- Opinion Leaders
Secondary Research
- Annual Reports
- White Paper
- Latest Press Release
- Industry Association
- Paid Database
- Investor Presentations

Step 4 - Data Triangulation
Involves using different sources of information in order to increase the validity of a study
These sources are likely to be stakeholders in a program - participants, other researchers, program staff, other community members, and so on.
Then we put all data in single framework & apply various statistical tools to find out the dynamic on the market.
During the analysis stage, feedback from the stakeholder groups would be compared to determine areas of agreement as well as areas of divergence
