

Key Insights
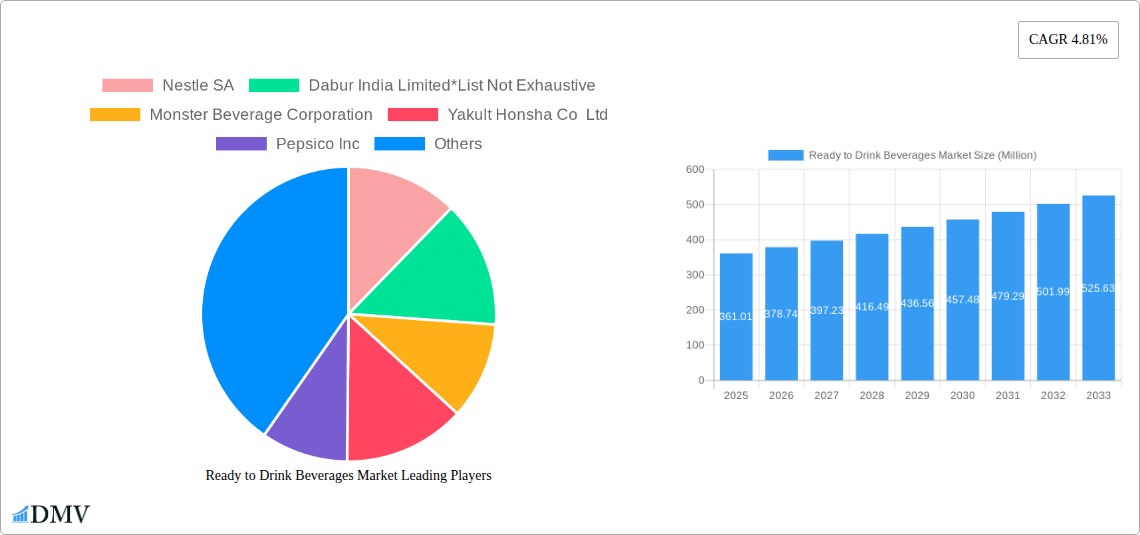
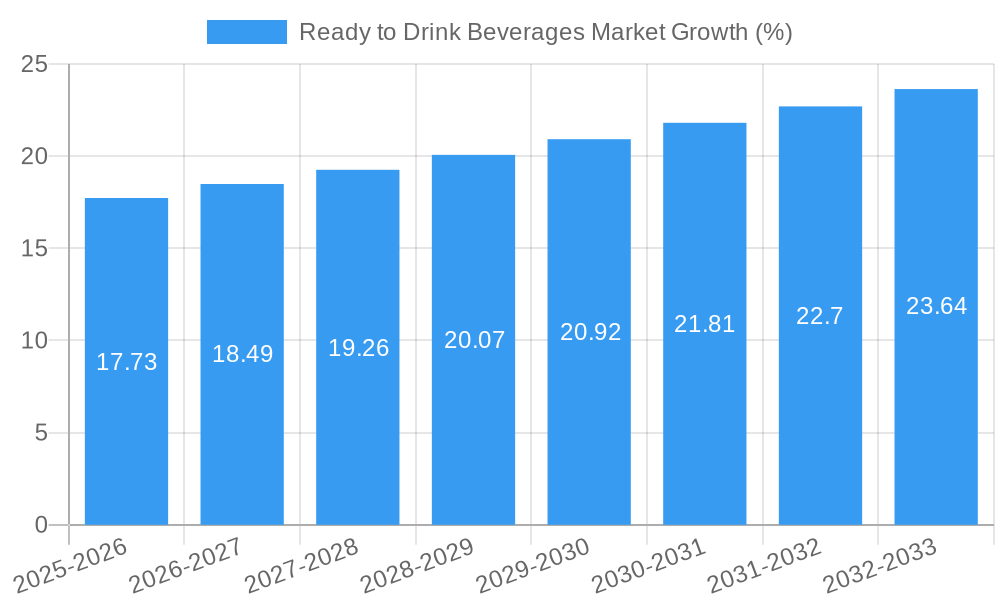
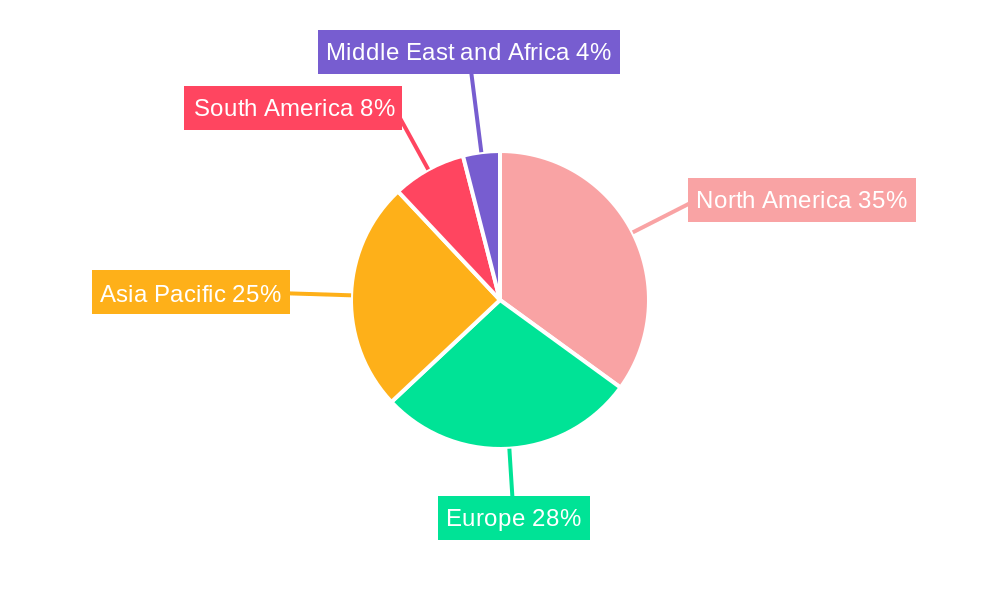
The Ready-to-Drink (RTD) beverages market, valued at $361.01 million in 2025, is projected to experience robust growth, driven by several key factors. The increasing demand for convenient and on-the-go consumption options, coupled with the rising popularity of health-conscious beverages like flavored water and dairy alternatives, fuels market expansion. Consumers are increasingly seeking healthier alternatives to sugary sodas, leading to a surge in demand for products such as tea, coffee, and yogurt drinks. The market segmentation reveals significant opportunities across various distribution channels, with online stores experiencing rapid growth alongside traditional supermarkets and convenience stores. The competitive landscape is dominated by established players like Nestle, PepsiCo, and Coca-Cola, alongside emerging brands focusing on niche segments and innovative product offerings. Geographic variations exist, with North America and Asia Pacific expected to lead the market growth due to higher per capita consumption and expanding middle classes. However, challenges such as fluctuating raw material prices and evolving consumer preferences pose potential restraints. The projected Compound Annual Growth Rate (CAGR) of 4.81% indicates a steady market expansion throughout the forecast period (2025-2033). Successful players will need to adapt to changing consumer needs, invest in innovative product development, and leverage robust distribution networks to capitalize on this growth potential.
Further analysis reveals the significant influence of product type on market dynamics. Tea and coffee-based RTD beverages maintain substantial market share due to their established consumer base and continuous innovation in flavors and formats. Energy drinks, while a smaller segment, showcase strong growth potential driven by younger demographics and active lifestyles. The rising health consciousness is driving the growth of dairy and dairy-alternative beverages and flavored/fortified water. This trend presents an opportunity for companies to focus on natural ingredients, functional benefits, and sustainable packaging to attract health-conscious consumers. The ongoing expansion of e-commerce also offers substantial opportunities for brands to reach a wider audience and enhance their market penetration. Effective marketing strategies targeting specific consumer segments, coupled with strategic partnerships and distribution agreements, will be crucial for achieving long-term success in this competitive market.
Ready to Drink Beverages Market: A Comprehensive Report (2019-2033)
This insightful report provides a deep dive into the Ready to Drink Beverages market, offering a comprehensive analysis of its current state, future trajectory, and key players. Spanning the period from 2019 to 2033, with a base year of 2025 and a forecast period of 2025-2033, this report is an invaluable resource for stakeholders seeking to understand and capitalize on the opportunities within this dynamic market. The global market size is estimated at xx Million in 2025 and is projected to reach xx Million by 2033.
Ready to Drink Beverages Market Composition & Trends
This section meticulously examines the Ready to Drink Beverages market's competitive landscape, encompassing market concentration, innovation drivers, regulatory frameworks, substitute products, end-user demographics, and merger & acquisition (M&A) activities. We delve into the market share distribution among key players, analyzing their strategic maneuvers and competitive advantages. Furthermore, we provide a detailed overview of significant M&A deals, including their values and implications for market consolidation. The analysis includes a thorough assessment of innovation trends, regulatory changes impacting the market, and the emergence of substitute products.
- Market Share Distribution: A detailed breakdown of market share held by key players like Nestle SA, Pepsico Inc., and The Coca-Cola Company, revealing the level of market concentration.
- M&A Activity Analysis: A comprehensive review of recent M&A activity, including deal values and their impact on market dynamics. For example, the xx Million acquisition of [Company A] by [Company B] significantly altered the competitive landscape.
- Innovation Landscape: An in-depth analysis of innovation in areas such as sustainable packaging, functional beverages, and new flavor profiles.
- Regulatory Landscape Analysis: A comprehensive overview of the regulatory environment affecting the Ready to Drink Beverages market across various geographies.
Ready to Drink Beverages Market Industry Evolution
This section charts the evolution of the Ready to Drink Beverages market, exploring its growth trajectory, technological advancements, and shifting consumer preferences. We present concrete data points, such as compound annual growth rates (CAGRs) and adoption rates of new technologies, to illustrate the market's dynamic nature. The analysis encompasses the influence of evolving consumer tastes, health consciousness, and the emergence of novel product categories on market growth. We discuss the impact of technological advancements like improved packaging and enhanced production methods. The analysis will reveal an overall CAGR of xx% from 2019 to 2024, with an expected increase to xx% during the forecast period (2025-2033).
Leading Regions, Countries, or Segments in Ready to Drink Beverages Market
This section identifies the leading regions, countries, and market segments within the Ready to Drink Beverages market. We analyze the dominance of specific distribution channels (Supermarkets/Hypermarkets, Convenience/Grocery Stores, Online Stores, Specialty Retail Stores, Other Distribution Channels) and product types (Tea, Coffee, Energy Drinks, Yogurt Drinks, Dairy and Dairy Alternative Beverages, Flavored & Fortified Water, Other Product Types). The key drivers behind the dominance of these segments are highlighted using bullet points, while paragraphs offer deeper insights into the underlying factors.
Dominant Distribution Channel:
- Supermarkets/Hypermarkets: High volume sales, established distribution networks, and strong brand presence.
- Convenience/Grocery Stores: Accessibility and impulse purchases drive market share.
Dominant Product Type:
- Energy Drinks: High growth driven by increasing consumer demand for functional beverages and convenience.
- Flavored & Fortified Water: Growing health consciousness is fueling demand in this segment.
Ready to Drink Beverages Market Product Innovations
This section details recent product innovations, applications, and performance metrics within the Ready to Drink Beverages market. We analyze unique selling propositions (USPs) of newly launched products and explore the technological advancements driving product improvements, focusing on enhanced taste, functionality, and sustainability. Examples include the rise of plant-based beverages and the integration of functional ingredients.
Propelling Factors for Ready to Drink Beverages Market Growth
This section identifies the key drivers fueling the growth of the Ready to Drink Beverages market. Technological advancements in production and packaging, coupled with evolving consumer preferences and favorable economic conditions, are highlighted. Specific examples include the rising adoption of sustainable packaging and the increasing popularity of functional beverages. Supportive regulatory frameworks, such as those encouraging healthier beverage options, also play a significant role.
Obstacles in the Ready to Drink Beverages Market
This section outlines the barriers and restraints hindering the growth of the Ready to Drink Beverages market. Regulatory challenges, supply chain disruptions, and intense competition are analyzed, along with their quantifiable impacts on market expansion. Examples include fluctuating raw material prices and increased pressure from private labels.
Future Opportunities in Ready to Drink Beverages Market
This section highlights promising opportunities for growth within the Ready to Drink Beverages market. We examine emerging markets, innovative technologies, and evolving consumer trends, highlighting areas with high potential for expansion and investment. For instance, the increasing demand for personalized and customized beverages presents significant opportunities.
Major Players in the Ready to Drink Beverages Market Ecosystem
- Nestle SA (Nestle SA)
- Dabur India Limited
- Monster Beverage Corporation (Monster Beverage Corporation)
- Yakult Honsha Co Ltd (Yakult Honsha Co Ltd)
- Pepsico Inc (Pepsico Inc)
- Danone SA (Danone SA)
- Suntory Holdings Limited (Suntory Holdings Limited)
- Red Bull GmbH (Red Bull GmbH)
- Blue Diamond Growers (Blue Diamond Growers)
- The Coca-Cola Company (The Coca-Cola Company)
Key Developments in Ready to Drink Beverages Market Industry
- February 2023: PepsiCo launched a marshmallow-flavored cola in partnership with Peeps, creating significant buzz and market attention.
- September 2022: Honest Tea's launch of Just Iced Tea expanded the organic, ethically sourced ready-to-drink tea segment.
- March 2022: Nirvana Water Sciences Inc. introduced a functional water product with immune-boosting and muscle recovery benefits, tapping into the growing health and wellness market.
Strategic Ready to Drink Beverages Market Forecast
The Ready to Drink Beverages market is poised for continued growth, driven by innovation, evolving consumer preferences, and expanding distribution channels. The market's future trajectory will be shaped by ongoing product diversification, the rise of functional beverages, and the increasing demand for sustainable packaging. These factors point towards significant opportunities for both established players and new entrants in the coming years.
Ready to Drink Beverages Market Segmentation
-
1. Product Type
- 1.1. Tea
- 1.2. Coffee
- 1.3. Energy Drinks
- 1.4. Yogurt Drinks
- 1.5. Dairy and Dairy Alternative Beverages
- 1.6. Flavored and Fortified Water
- 1.7. Other Product Types
-
2. Distribution Channel
- 2.1. Supermarkets/Hypermarkets
- 2.2. Convenience/Grocery Stores
- 2.3. Online Stores
- 2.4. Specialty Retail Stores
- 2.5. Other Distribution Channels
Ready to Drink Beverages Market Segmentation By Geography
-
1. North America
- 1.1. United States
- 1.2. Canada
- 1.3. Mexico
- 1.4. Rest of North America
-
2. Europe
- 2.1. Germany
- 2.2. United Kingdom
- 2.3. Italy
- 2.4. Spain
- 2.5. France
- 2.6. Russia
- 2.7. Rest of Europe
-
3. Asia Pacific
- 3.1. China
- 3.2. Japan
- 3.3. India
- 3.4. Australia
- 3.5. Rest of Asia Pacific
-
4. South America
- 4.1. Brazil
- 4.2. Argentina
- 4.3. Rest of South America
-
5. Middle East and Africa
- 5.1. South Africa
- 5.2. Saudi Arabia
- 5.3. Rest of Middle East and Africa
Ready to Drink Beverages Market REPORT HIGHLIGHTS
| Aspects | Details |
|---|---|
| Study Period | 2019-2033 |
| Base Year | 2024 |
| Estimated Year | 2025 |
| Forecast Period | 2025-2033 |
| Historical Period | 2019-2024 |
| Growth Rate | CAGR of 4.81% from 2019-2033 |
| Segmentation |
|
Table of Contents
- 1. Introduction
- 1.1. Research Scope
- 1.2. Market Segmentation
- 1.3. Research Methodology
- 1.4. Definitions and Assumptions
- 2. Executive Summary
- 2.1. Introduction
- 3. Market Dynamics
- 3.1. Introduction
- 3.2. Market Drivers
- 3.2.1. Inclination Toward Low-Sugar/Sugar-free Beverages
- 3.3. Market Restrains
- 3.3.1. Concerns Over Health Issues Associated with Functional Beverages
- 3.4. Market Trends
- 3.4.1. Augmented Expenditure on Advertisement and Promotional Activities Impel Market Growth
- 4. Market Factor Analysis
- 4.1. Porters Five Forces
- 4.2. Supply/Value Chain
- 4.3. PESTEL analysis
- 4.4. Market Entropy
- 4.5. Patent/Trademark Analysis
- 5. Global Ready to Drink Beverages Market Analysis, Insights and Forecast, 2019-2031
- 5.1. Market Analysis, Insights and Forecast - by Product Type
- 5.1.1. Tea
- 5.1.2. Coffee
- 5.1.3. Energy Drinks
- 5.1.4. Yogurt Drinks
- 5.1.5. Dairy and Dairy Alternative Beverages
- 5.1.6. Flavored and Fortified Water
- 5.1.7. Other Product Types
- 5.2. Market Analysis, Insights and Forecast - by Distribution Channel
- 5.2.1. Supermarkets/Hypermarkets
- 5.2.2. Convenience/Grocery Stores
- 5.2.3. Online Stores
- 5.2.4. Specialty Retail Stores
- 5.2.5. Other Distribution Channels
- 5.3. Market Analysis, Insights and Forecast - by Region
- 5.3.1. North America
- 5.3.2. Europe
- 5.3.3. Asia Pacific
- 5.3.4. South America
- 5.3.5. Middle East and Africa
- 5.1. Market Analysis, Insights and Forecast - by Product Type
- 6. North America Ready to Drink Beverages Market Analysis, Insights and Forecast, 2019-2031
- 6.1. Market Analysis, Insights and Forecast - by Product Type
- 6.1.1. Tea
- 6.1.2. Coffee
- 6.1.3. Energy Drinks
- 6.1.4. Yogurt Drinks
- 6.1.5. Dairy and Dairy Alternative Beverages
- 6.1.6. Flavored and Fortified Water
- 6.1.7. Other Product Types
- 6.2. Market Analysis, Insights and Forecast - by Distribution Channel
- 6.2.1. Supermarkets/Hypermarkets
- 6.2.2. Convenience/Grocery Stores
- 6.2.3. Online Stores
- 6.2.4. Specialty Retail Stores
- 6.2.5. Other Distribution Channels
- 6.1. Market Analysis, Insights and Forecast - by Product Type
- 7. Europe Ready to Drink Beverages Market Analysis, Insights and Forecast, 2019-2031
- 7.1. Market Analysis, Insights and Forecast - by Product Type
- 7.1.1. Tea
- 7.1.2. Coffee
- 7.1.3. Energy Drinks
- 7.1.4. Yogurt Drinks
- 7.1.5. Dairy and Dairy Alternative Beverages
- 7.1.6. Flavored and Fortified Water
- 7.1.7. Other Product Types
- 7.2. Market Analysis, Insights and Forecast - by Distribution Channel
- 7.2.1. Supermarkets/Hypermarkets
- 7.2.2. Convenience/Grocery Stores
- 7.2.3. Online Stores
- 7.2.4. Specialty Retail Stores
- 7.2.5. Other Distribution Channels
- 7.1. Market Analysis, Insights and Forecast - by Product Type
- 8. Asia Pacific Ready to Drink Beverages Market Analysis, Insights and Forecast, 2019-2031
- 8.1. Market Analysis, Insights and Forecast - by Product Type
- 8.1.1. Tea
- 8.1.2. Coffee
- 8.1.3. Energy Drinks
- 8.1.4. Yogurt Drinks
- 8.1.5. Dairy and Dairy Alternative Beverages
- 8.1.6. Flavored and Fortified Water
- 8.1.7. Other Product Types
- 8.2. Market Analysis, Insights and Forecast - by Distribution Channel
- 8.2.1. Supermarkets/Hypermarkets
- 8.2.2. Convenience/Grocery Stores
- 8.2.3. Online Stores
- 8.2.4. Specialty Retail Stores
- 8.2.5. Other Distribution Channels
- 8.1. Market Analysis, Insights and Forecast - by Product Type
- 9. South America Ready to Drink Beverages Market Analysis, Insights and Forecast, 2019-2031
- 9.1. Market Analysis, Insights and Forecast - by Product Type
- 9.1.1. Tea
- 9.1.2. Coffee
- 9.1.3. Energy Drinks
- 9.1.4. Yogurt Drinks
- 9.1.5. Dairy and Dairy Alternative Beverages
- 9.1.6. Flavored and Fortified Water
- 9.1.7. Other Product Types
- 9.2. Market Analysis, Insights and Forecast - by Distribution Channel
- 9.2.1. Supermarkets/Hypermarkets
- 9.2.2. Convenience/Grocery Stores
- 9.2.3. Online Stores
- 9.2.4. Specialty Retail Stores
- 9.2.5. Other Distribution Channels
- 9.1. Market Analysis, Insights and Forecast - by Product Type
- 10. Middle East and Africa Ready to Drink Beverages Market Analysis, Insights and Forecast, 2019-2031
- 10.1. Market Analysis, Insights and Forecast - by Product Type
- 10.1.1. Tea
- 10.1.2. Coffee
- 10.1.3. Energy Drinks
- 10.1.4. Yogurt Drinks
- 10.1.5. Dairy and Dairy Alternative Beverages
- 10.1.6. Flavored and Fortified Water
- 10.1.7. Other Product Types
- 10.2. Market Analysis, Insights and Forecast - by Distribution Channel
- 10.2.1. Supermarkets/Hypermarkets
- 10.2.2. Convenience/Grocery Stores
- 10.2.3. Online Stores
- 10.2.4. Specialty Retail Stores
- 10.2.5. Other Distribution Channels
- 10.1. Market Analysis, Insights and Forecast - by Product Type
- 11. North America Ready to Drink Beverages Market Analysis, Insights and Forecast, 2019-2031
- 11.1. Market Analysis, Insights and Forecast - By Country/Sub-region
- 11.1.1 United States
- 11.1.2 Canada
- 11.1.3 Mexico
- 11.1.4 Rest of North America
- 12. Europe Ready to Drink Beverages Market Analysis, Insights and Forecast, 2019-2031
- 12.1. Market Analysis, Insights and Forecast - By Country/Sub-region
- 12.1.1 Germany
- 12.1.2 United Kingdom
- 12.1.3 Italy
- 12.1.4 Spain
- 12.1.5 France
- 12.1.6 Russia
- 12.1.7 Rest of Europe
- 13. Asia Pacific Ready to Drink Beverages Market Analysis, Insights and Forecast, 2019-2031
- 13.1. Market Analysis, Insights and Forecast - By Country/Sub-region
- 13.1.1 China
- 13.1.2 Japan
- 13.1.3 India
- 13.1.4 Australia
- 13.1.5 Rest of Asia Pacific
- 14. South America Ready to Drink Beverages Market Analysis, Insights and Forecast, 2019-2031
- 14.1. Market Analysis, Insights and Forecast - By Country/Sub-region
- 14.1.1 Brazil
- 14.1.2 Argentina
- 14.1.3 Rest of South America
- 15. Middle East and Africa Ready to Drink Beverages Market Analysis, Insights and Forecast, 2019-2031
- 15.1. Market Analysis, Insights and Forecast - By Country/Sub-region
- 15.1.1 South Africa
- 15.1.2 Saudi Arabia
- 15.1.3 Rest of Middle East and Africa
- 16. Competitive Analysis
- 16.1. Global Market Share Analysis 2024
- 16.2. Company Profiles
- 16.2.1 Nestle SA
- 16.2.1.1. Overview
- 16.2.1.2. Products
- 16.2.1.3. SWOT Analysis
- 16.2.1.4. Recent Developments
- 16.2.1.5. Financials (Based on Availability)
- 16.2.2 Dabur India Limited*List Not Exhaustive
- 16.2.2.1. Overview
- 16.2.2.2. Products
- 16.2.2.3. SWOT Analysis
- 16.2.2.4. Recent Developments
- 16.2.2.5. Financials (Based on Availability)
- 16.2.3 Monster Beverage Corporation
- 16.2.3.1. Overview
- 16.2.3.2. Products
- 16.2.3.3. SWOT Analysis
- 16.2.3.4. Recent Developments
- 16.2.3.5. Financials (Based on Availability)
- 16.2.4 Yakult Honsha Co Ltd
- 16.2.4.1. Overview
- 16.2.4.2. Products
- 16.2.4.3. SWOT Analysis
- 16.2.4.4. Recent Developments
- 16.2.4.5. Financials (Based on Availability)
- 16.2.5 Pepsico Inc
- 16.2.5.1. Overview
- 16.2.5.2. Products
- 16.2.5.3. SWOT Analysis
- 16.2.5.4. Recent Developments
- 16.2.5.5. Financials (Based on Availability)
- 16.2.6 Danone SA
- 16.2.6.1. Overview
- 16.2.6.2. Products
- 16.2.6.3. SWOT Analysis
- 16.2.6.4. Recent Developments
- 16.2.6.5. Financials (Based on Availability)
- 16.2.7 Suntory Holdings Limited
- 16.2.7.1. Overview
- 16.2.7.2. Products
- 16.2.7.3. SWOT Analysis
- 16.2.7.4. Recent Developments
- 16.2.7.5. Financials (Based on Availability)
- 16.2.8 Red Bull GmbH
- 16.2.8.1. Overview
- 16.2.8.2. Products
- 16.2.8.3. SWOT Analysis
- 16.2.8.4. Recent Developments
- 16.2.8.5. Financials (Based on Availability)
- 16.2.9 Blue Diamond Growers
- 16.2.9.1. Overview
- 16.2.9.2. Products
- 16.2.9.3. SWOT Analysis
- 16.2.9.4. Recent Developments
- 16.2.9.5. Financials (Based on Availability)
- 16.2.10 The Coca-Cola Company
- 16.2.10.1. Overview
- 16.2.10.2. Products
- 16.2.10.3. SWOT Analysis
- 16.2.10.4. Recent Developments
- 16.2.10.5. Financials (Based on Availability)
- 16.2.1 Nestle SA
List of Figures
- Figure 1: Global Ready to Drink Beverages Market Revenue Breakdown (Million, %) by Region 2024 & 2032
- Figure 2: North America Ready to Drink Beverages Market Revenue (Million), by Country 2024 & 2032
- Figure 3: North America Ready to Drink Beverages Market Revenue Share (%), by Country 2024 & 2032
- Figure 4: Europe Ready to Drink Beverages Market Revenue (Million), by Country 2024 & 2032
- Figure 5: Europe Ready to Drink Beverages Market Revenue Share (%), by Country 2024 & 2032
- Figure 6: Asia Pacific Ready to Drink Beverages Market Revenue (Million), by Country 2024 & 2032
- Figure 7: Asia Pacific Ready to Drink Beverages Market Revenue Share (%), by Country 2024 & 2032
- Figure 8: South America Ready to Drink Beverages Market Revenue (Million), by Country 2024 & 2032
- Figure 9: South America Ready to Drink Beverages Market Revenue Share (%), by Country 2024 & 2032
- Figure 10: Middle East and Africa Ready to Drink Beverages Market Revenue (Million), by Country 2024 & 2032
- Figure 11: Middle East and Africa Ready to Drink Beverages Market Revenue Share (%), by Country 2024 & 2032
- Figure 12: North America Ready to Drink Beverages Market Revenue (Million), by Product Type 2024 & 2032
- Figure 13: North America Ready to Drink Beverages Market Revenue Share (%), by Product Type 2024 & 2032
- Figure 14: North America Ready to Drink Beverages Market Revenue (Million), by Distribution Channel 2024 & 2032
- Figure 15: North America Ready to Drink Beverages Market Revenue Share (%), by Distribution Channel 2024 & 2032
- Figure 16: North America Ready to Drink Beverages Market Revenue (Million), by Country 2024 & 2032
- Figure 17: North America Ready to Drink Beverages Market Revenue Share (%), by Country 2024 & 2032
- Figure 18: Europe Ready to Drink Beverages Market Revenue (Million), by Product Type 2024 & 2032
- Figure 19: Europe Ready to Drink Beverages Market Revenue Share (%), by Product Type 2024 & 2032
- Figure 20: Europe Ready to Drink Beverages Market Revenue (Million), by Distribution Channel 2024 & 2032
- Figure 21: Europe Ready to Drink Beverages Market Revenue Share (%), by Distribution Channel 2024 & 2032
- Figure 22: Europe Ready to Drink Beverages Market Revenue (Million), by Country 2024 & 2032
- Figure 23: Europe Ready to Drink Beverages Market Revenue Share (%), by Country 2024 & 2032
- Figure 24: Asia Pacific Ready to Drink Beverages Market Revenue (Million), by Product Type 2024 & 2032
- Figure 25: Asia Pacific Ready to Drink Beverages Market Revenue Share (%), by Product Type 2024 & 2032
- Figure 26: Asia Pacific Ready to Drink Beverages Market Revenue (Million), by Distribution Channel 2024 & 2032
- Figure 27: Asia Pacific Ready to Drink Beverages Market Revenue Share (%), by Distribution Channel 2024 & 2032
- Figure 28: Asia Pacific Ready to Drink Beverages Market Revenue (Million), by Country 2024 & 2032
- Figure 29: Asia Pacific Ready to Drink Beverages Market Revenue Share (%), by Country 2024 & 2032
- Figure 30: South America Ready to Drink Beverages Market Revenue (Million), by Product Type 2024 & 2032
- Figure 31: South America Ready to Drink Beverages Market Revenue Share (%), by Product Type 2024 & 2032
- Figure 32: South America Ready to Drink Beverages Market Revenue (Million), by Distribution Channel 2024 & 2032
- Figure 33: South America Ready to Drink Beverages Market Revenue Share (%), by Distribution Channel 2024 & 2032
- Figure 34: South America Ready to Drink Beverages Market Revenue (Million), by Country 2024 & 2032
- Figure 35: South America Ready to Drink Beverages Market Revenue Share (%), by Country 2024 & 2032
- Figure 36: Middle East and Africa Ready to Drink Beverages Market Revenue (Million), by Product Type 2024 & 2032
- Figure 37: Middle East and Africa Ready to Drink Beverages Market Revenue Share (%), by Product Type 2024 & 2032
- Figure 38: Middle East and Africa Ready to Drink Beverages Market Revenue (Million), by Distribution Channel 2024 & 2032
- Figure 39: Middle East and Africa Ready to Drink Beverages Market Revenue Share (%), by Distribution Channel 2024 & 2032
- Figure 40: Middle East and Africa Ready to Drink Beverages Market Revenue (Million), by Country 2024 & 2032
- Figure 41: Middle East and Africa Ready to Drink Beverages Market Revenue Share (%), by Country 2024 & 2032
List of Tables
- Table 1: Global Ready to Drink Beverages Market Revenue Million Forecast, by Region 2019 & 2032
- Table 2: Global Ready to Drink Beverages Market Revenue Million Forecast, by Product Type 2019 & 2032
- Table 3: Global Ready to Drink Beverages Market Revenue Million Forecast, by Distribution Channel 2019 & 2032
- Table 4: Global Ready to Drink Beverages Market Revenue Million Forecast, by Region 2019 & 2032
- Table 5: Global Ready to Drink Beverages Market Revenue Million Forecast, by Country 2019 & 2032
- Table 6: United States Ready to Drink Beverages Market Revenue (Million) Forecast, by Application 2019 & 2032
- Table 7: Canada Ready to Drink Beverages Market Revenue (Million) Forecast, by Application 2019 & 2032
- Table 8: Mexico Ready to Drink Beverages Market Revenue (Million) Forecast, by Application 2019 & 2032
- Table 9: Rest of North America Ready to Drink Beverages Market Revenue (Million) Forecast, by Application 2019 & 2032
- Table 10: Global Ready to Drink Beverages Market Revenue Million Forecast, by Country 2019 & 2032
- Table 11: Germany Ready to Drink Beverages Market Revenue (Million) Forecast, by Application 2019 & 2032
- Table 12: United Kingdom Ready to Drink Beverages Market Revenue (Million) Forecast, by Application 2019 & 2032
- Table 13: Italy Ready to Drink Beverages Market Revenue (Million) Forecast, by Application 2019 & 2032
- Table 14: Spain Ready to Drink Beverages Market Revenue (Million) Forecast, by Application 2019 & 2032
- Table 15: France Ready to Drink Beverages Market Revenue (Million) Forecast, by Application 2019 & 2032
- Table 16: Russia Ready to Drink Beverages Market Revenue (Million) Forecast, by Application 2019 & 2032
- Table 17: Rest of Europe Ready to Drink Beverages Market Revenue (Million) Forecast, by Application 2019 & 2032
- Table 18: Global Ready to Drink Beverages Market Revenue Million Forecast, by Country 2019 & 2032
- Table 19: China Ready to Drink Beverages Market Revenue (Million) Forecast, by Application 2019 & 2032
- Table 20: Japan Ready to Drink Beverages Market Revenue (Million) Forecast, by Application 2019 & 2032
- Table 21: India Ready to Drink Beverages Market Revenue (Million) Forecast, by Application 2019 & 2032
- Table 22: Australia Ready to Drink Beverages Market Revenue (Million) Forecast, by Application 2019 & 2032
- Table 23: Rest of Asia Pacific Ready to Drink Beverages Market Revenue (Million) Forecast, by Application 2019 & 2032
- Table 24: Global Ready to Drink Beverages Market Revenue Million Forecast, by Country 2019 & 2032
- Table 25: Brazil Ready to Drink Beverages Market Revenue (Million) Forecast, by Application 2019 & 2032
- Table 26: Argentina Ready to Drink Beverages Market Revenue (Million) Forecast, by Application 2019 & 2032
- Table 27: Rest of South America Ready to Drink Beverages Market Revenue (Million) Forecast, by Application 2019 & 2032
- Table 28: Global Ready to Drink Beverages Market Revenue Million Forecast, by Country 2019 & 2032
- Table 29: South Africa Ready to Drink Beverages Market Revenue (Million) Forecast, by Application 2019 & 2032
- Table 30: Saudi Arabia Ready to Drink Beverages Market Revenue (Million) Forecast, by Application 2019 & 2032
- Table 31: Rest of Middle East and Africa Ready to Drink Beverages Market Revenue (Million) Forecast, by Application 2019 & 2032
- Table 32: Global Ready to Drink Beverages Market Revenue Million Forecast, by Product Type 2019 & 2032
- Table 33: Global Ready to Drink Beverages Market Revenue Million Forecast, by Distribution Channel 2019 & 2032
- Table 34: Global Ready to Drink Beverages Market Revenue Million Forecast, by Country 2019 & 2032
- Table 35: United States Ready to Drink Beverages Market Revenue (Million) Forecast, by Application 2019 & 2032
- Table 36: Canada Ready to Drink Beverages Market Revenue (Million) Forecast, by Application 2019 & 2032
- Table 37: Mexico Ready to Drink Beverages Market Revenue (Million) Forecast, by Application 2019 & 2032
- Table 38: Rest of North America Ready to Drink Beverages Market Revenue (Million) Forecast, by Application 2019 & 2032
- Table 39: Global Ready to Drink Beverages Market Revenue Million Forecast, by Product Type 2019 & 2032
- Table 40: Global Ready to Drink Beverages Market Revenue Million Forecast, by Distribution Channel 2019 & 2032
- Table 41: Global Ready to Drink Beverages Market Revenue Million Forecast, by Country 2019 & 2032
- Table 42: Germany Ready to Drink Beverages Market Revenue (Million) Forecast, by Application 2019 & 2032
- Table 43: United Kingdom Ready to Drink Beverages Market Revenue (Million) Forecast, by Application 2019 & 2032
- Table 44: Italy Ready to Drink Beverages Market Revenue (Million) Forecast, by Application 2019 & 2032
- Table 45: Spain Ready to Drink Beverages Market Revenue (Million) Forecast, by Application 2019 & 2032
- Table 46: France Ready to Drink Beverages Market Revenue (Million) Forecast, by Application 2019 & 2032
- Table 47: Russia Ready to Drink Beverages Market Revenue (Million) Forecast, by Application 2019 & 2032
- Table 48: Rest of Europe Ready to Drink Beverages Market Revenue (Million) Forecast, by Application 2019 & 2032
- Table 49: Global Ready to Drink Beverages Market Revenue Million Forecast, by Product Type 2019 & 2032
- Table 50: Global Ready to Drink Beverages Market Revenue Million Forecast, by Distribution Channel 2019 & 2032
- Table 51: Global Ready to Drink Beverages Market Revenue Million Forecast, by Country 2019 & 2032
- Table 52: China Ready to Drink Beverages Market Revenue (Million) Forecast, by Application 2019 & 2032
- Table 53: Japan Ready to Drink Beverages Market Revenue (Million) Forecast, by Application 2019 & 2032
- Table 54: India Ready to Drink Beverages Market Revenue (Million) Forecast, by Application 2019 & 2032
- Table 55: Australia Ready to Drink Beverages Market Revenue (Million) Forecast, by Application 2019 & 2032
- Table 56: Rest of Asia Pacific Ready to Drink Beverages Market Revenue (Million) Forecast, by Application 2019 & 2032
- Table 57: Global Ready to Drink Beverages Market Revenue Million Forecast, by Product Type 2019 & 2032
- Table 58: Global Ready to Drink Beverages Market Revenue Million Forecast, by Distribution Channel 2019 & 2032
- Table 59: Global Ready to Drink Beverages Market Revenue Million Forecast, by Country 2019 & 2032
- Table 60: Brazil Ready to Drink Beverages Market Revenue (Million) Forecast, by Application 2019 & 2032
- Table 61: Argentina Ready to Drink Beverages Market Revenue (Million) Forecast, by Application 2019 & 2032
- Table 62: Rest of South America Ready to Drink Beverages Market Revenue (Million) Forecast, by Application 2019 & 2032
- Table 63: Global Ready to Drink Beverages Market Revenue Million Forecast, by Product Type 2019 & 2032
- Table 64: Global Ready to Drink Beverages Market Revenue Million Forecast, by Distribution Channel 2019 & 2032
- Table 65: Global Ready to Drink Beverages Market Revenue Million Forecast, by Country 2019 & 2032
- Table 66: South Africa Ready to Drink Beverages Market Revenue (Million) Forecast, by Application 2019 & 2032
- Table 67: Saudi Arabia Ready to Drink Beverages Market Revenue (Million) Forecast, by Application 2019 & 2032
- Table 68: Rest of Middle East and Africa Ready to Drink Beverages Market Revenue (Million) Forecast, by Application 2019 & 2032
Frequently Asked Questions
1. What is the projected Compound Annual Growth Rate (CAGR) of the Ready to Drink Beverages Market?
The projected CAGR is approximately 4.81%.
2. Which companies are prominent players in the Ready to Drink Beverages Market?
Key companies in the market include Nestle SA, Dabur India Limited*List Not Exhaustive, Monster Beverage Corporation, Yakult Honsha Co Ltd, Pepsico Inc, Danone SA, Suntory Holdings Limited, Red Bull GmbH, Blue Diamond Growers, The Coca-Cola Company.
3. What are the main segments of the Ready to Drink Beverages Market?
The market segments include Product Type, Distribution Channel.
4. Can you provide details about the market size?
The market size is estimated to be USD 361.01 Million as of 2022.
5. What are some drivers contributing to market growth?
Inclination Toward Low-Sugar/Sugar-free Beverages.
6. What are the notable trends driving market growth?
Augmented Expenditure on Advertisement and Promotional Activities Impel Market Growth.
7. Are there any restraints impacting market growth?
Concerns Over Health Issues Associated with Functional Beverages.
8. Can you provide examples of recent developments in the market?
February 2023: Pepsi Co. launched marshmallow-flavored Cola in partnership with Peeps. The pillowy-soft marshmallow cola flavor, paired with the instantly recognizable PEEPS®, comes in vibrant yellow packaging.
9. What pricing options are available for accessing the report?
Pricing options include single-user, multi-user, and enterprise licenses priced at USD 4750, USD 5250, and USD 8750 respectively.
10. Is the market size provided in terms of value or volume?
The market size is provided in terms of value, measured in Million.
11. Are there any specific market keywords associated with the report?
Yes, the market keyword associated with the report is "Ready to Drink Beverages Market," which aids in identifying and referencing the specific market segment covered.
12. How do I determine which pricing option suits my needs best?
The pricing options vary based on user requirements and access needs. Individual users may opt for single-user licenses, while businesses requiring broader access may choose multi-user or enterprise licenses for cost-effective access to the report.
13. Are there any additional resources or data provided in the Ready to Drink Beverages Market report?
While the report offers comprehensive insights, it's advisable to review the specific contents or supplementary materials provided to ascertain if additional resources or data are available.
14. How can I stay updated on further developments or reports in the Ready to Drink Beverages Market?
To stay informed about further developments, trends, and reports in the Ready to Drink Beverages Market, consider subscribing to industry newsletters, following relevant companies and organizations, or regularly checking reputable industry news sources and publications.
Methodology
Step 1 - Identification of Relevant Samples Size from Population Database


Step 2 - Approaches for Defining Global Market Size (Value, Volume* & Price*)

Note*: In applicable scenarios
Step 3 - Data Sources
Primary Research
- Web Analytics
- Survey Reports
- Research Institute
- Latest Research Reports
- Opinion Leaders
Secondary Research
- Annual Reports
- White Paper
- Latest Press Release
- Industry Association
- Paid Database
- Investor Presentations

Step 4 - Data Triangulation
Involves using different sources of information in order to increase the validity of a study
These sources are likely to be stakeholders in a program - participants, other researchers, program staff, other community members, and so on.
Then we put all data in single framework & apply various statistical tools to find out the dynamic on the market.
During the analysis stage, feedback from the stakeholder groups would be compared to determine areas of agreement as well as areas of divergence
