

Key Insights
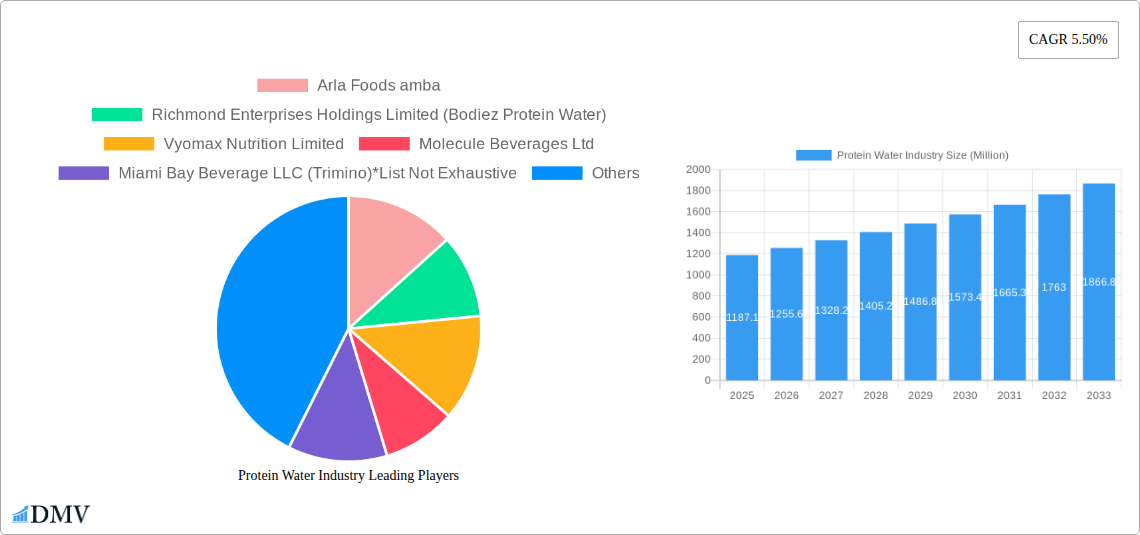
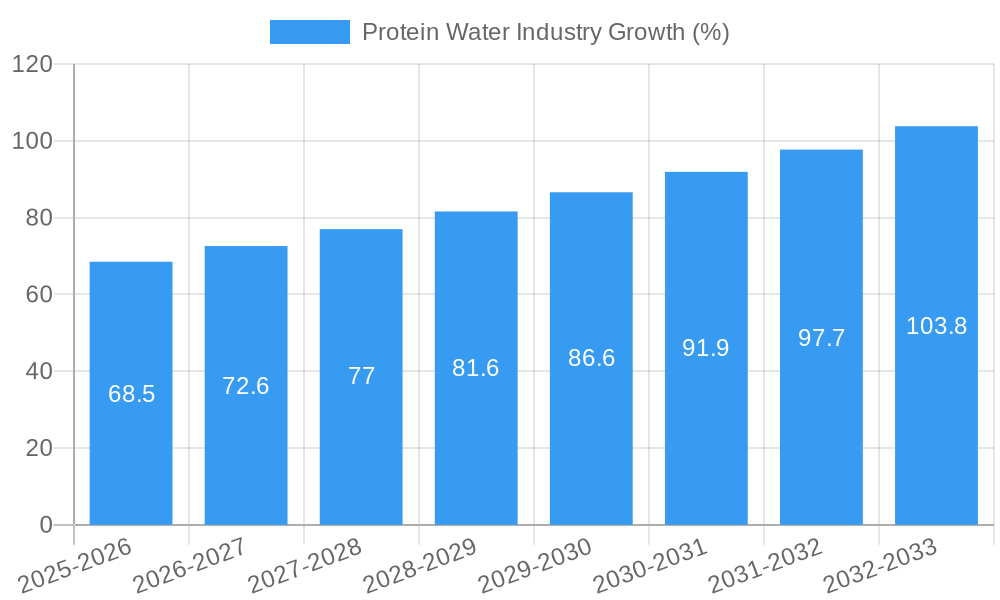
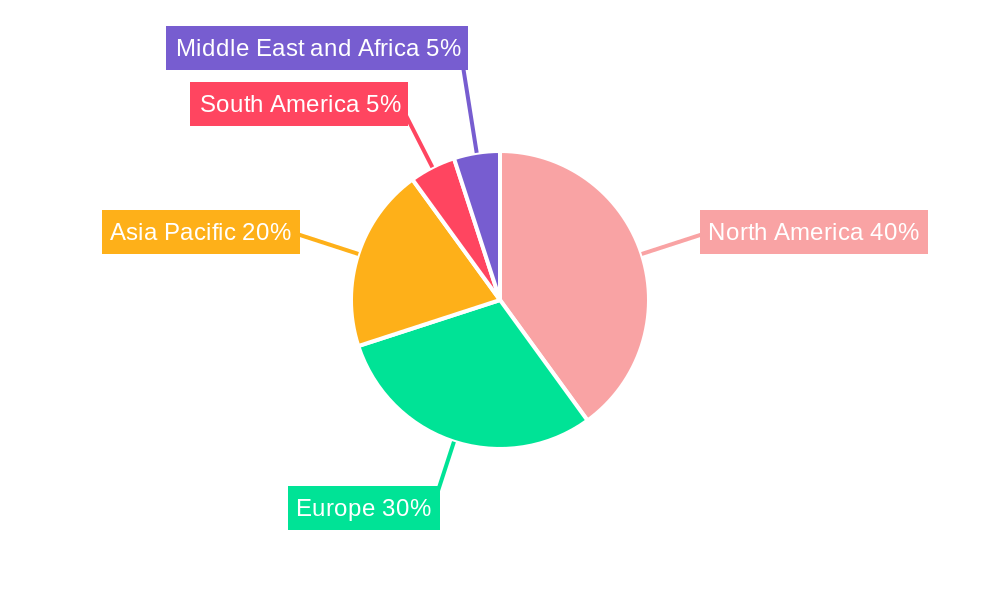
The protein water market, valued at $1187.1 million in 2025, is projected to experience robust growth, driven by increasing health consciousness among consumers and the rising popularity of convenient, on-the-go nutrition solutions. The market's 5.50% CAGR indicates a steady expansion throughout the forecast period (2025-2033). Key drivers include the growing demand for functional beverages, increasing awareness of the benefits of protein intake for muscle recovery and overall health, and the expanding distribution channels, particularly online platforms catering to a digitally savvy consumer base. Flavored protein water is expected to dominate the market due to its appealing taste profiles, while supermarkets and hypermarkets are likely to remain the primary distribution channels, although online sales will see significant growth. Competitive pressures among established players like Arla Foods amba, Richmond Enterprises Holdings Limited, and Glanbia PLC (Optimum Nutrition Inc), along with emerging brands, will contribute to innovation in product offerings and marketing strategies. Geographic expansion into developing markets, particularly in Asia-Pacific and South America, presents substantial opportunities for growth, although regulatory hurdles and varying consumer preferences could pose regional challenges.
The segment analysis suggests that the flavored protein water segment will likely capture a larger market share compared to the unflavored segment, reflecting consumer preference for enhanced taste. Distribution channels will see a dynamic shift, with online sales growing steadily alongside traditional channels like supermarkets and hypermarkets. North America and Europe are expected to remain dominant regional markets due to established consumer awareness and market penetration, but significant growth potential lies within rapidly developing economies in Asia-Pacific, particularly in countries like India and China. Continued research and development into novel protein sources, sustainable packaging, and innovative flavor profiles will be crucial for maintaining market competitiveness and catering to evolving consumer demands. Market restraints could include fluctuations in raw material costs, stringent regulatory requirements in certain regions, and potential consumer concerns regarding artificial sweeteners or added sugars.
Protein Water Industry: A Comprehensive Market Report (2019-2033)
This insightful report provides a detailed analysis of the global protein water industry, projecting a market value of $XX Million by 2033. It covers market trends, competitive landscape, leading players, and future growth prospects, offering crucial insights for stakeholders across the value chain. The report utilizes data from the historical period (2019-2024), base year (2025), and forecast period (2025-2033) to deliver a comprehensive view of this dynamic market.
Protein Water Industry Market Composition & Trends
The protein water market, valued at $XX Million in 2025, exhibits a moderately consolidated structure with key players vying for market share. Innovation is driven by the increasing demand for healthier, convenient hydration options, particularly among health-conscious consumers. Regulatory landscapes vary across regions, influencing product formulations and labeling requirements. Competition from other functional beverages, including enhanced water and sports drinks, poses a challenge. The report analyzes the end-user profiles, identifying key demographic segments driving market growth. Mergers and acquisitions (M&A) activity, while not frequent, plays a role in shaping market dynamics. Deal values have ranged from $XX Million to $XX Million in recent years.
- Market Share Distribution: Dominant players hold approximately XX% of the market share, while smaller players account for the remaining XX%.
- M&A Activity: The report includes a detailed analysis of significant M&A transactions, highlighting their impact on market consolidation.
- Regulatory Landscape: Analysis covers key regulations pertaining to labeling, ingredients, and claims.
- Substitute Products: The report discusses competitive pressure from substitute products such as sports drinks and enhanced waters.
Protein Water Industry Industry Evolution
The protein water industry has witnessed significant evolution since 2019, driven by several factors. Market growth has been fueled by increasing consumer awareness of protein's health benefits and the convenience of ready-to-drink protein sources. Technological advancements in processing and packaging have enhanced product quality and shelf life. Shifting consumer preferences towards healthier, functional beverages continue to shape the market. Growth rates have averaged approximately XX% annually during the historical period, with expectations of XX% annual growth during the forecast period. Adoption metrics such as per capita consumption are also analyzed. The report delves into specific trends like the rise of vegan protein waters and the integration of other functional ingredients. The evolving preferences towards natural and organic ingredients and the demand for innovative flavors and formats are also explored.
Leading Regions, Countries, or Segments in Protein Water Industry
The North American market currently dominates the global protein water industry, driven by high consumer demand and established distribution networks. However, Asia-Pacific is exhibiting strong growth potential due to rising disposable incomes and health awareness. Within product segments, flavored protein water holds a larger market share compared to unflavored options. Supermarkets/hypermarkets remain the primary distribution channel, though online channels are witnessing increasing traction.
- Key Drivers for North American Dominance:
- High disposable incomes
- Strong health and wellness culture
- Extensive distribution networks
- Early adoption of protein-infused products
- Key Drivers for Asia-Pacific Growth:
- Rising middle class
- Growing awareness of health and fitness
- Increasing demand for convenient nutrition
Protein Water Industry Product Innovations
Recent innovations focus on improving taste profiles, expanding flavor variety, and incorporating additional functional ingredients. This includes the introduction of plant-based protein sources, zero-sugar options, and functional additions like electrolytes. The unique selling propositions often center on convenience, taste, and health benefits. Technological advancements such as improved packaging and enhanced production processes have played a key role in improving product quality and shelf life.
Propelling Factors for Protein Water Industry Growth
Technological advancements in protein extraction and formulation are driving cost reduction and quality enhancement. Positive economic trends, particularly in developing economies, are boosting consumer spending power, making premium products more accessible. Favorable regulatory environments in several regions further promote market expansion. Increased awareness of the benefits of protein for muscle recovery and overall health significantly contributes to market growth.
Obstacles in the Protein Water Industry Market
Regulatory hurdles, especially concerning labeling and ingredient claims, can hinder market growth. Supply chain disruptions due to factors such as raw material availability and logistics pose significant challenges. Intense competition from established beverage companies and the emergence of new entrants create competitive pressures, impacting margins and profitability. Consumer perception regarding the taste and potential negative health impacts of artificial sweeteners or excessive protein intake can affect growth.
Future Opportunities in Protein Water Industry
Expanding into new geographic markets, particularly in developing economies, presents significant growth opportunities. Innovation in product formulations, including the incorporation of emerging protein sources and functional ingredients, remains a key focus. Leveraging direct-to-consumer online sales channels and developing strategic partnerships can significantly boost market penetration.
Major Players in the Protein Water Industry Ecosystem
- Arla Foods amba
- Richmond Enterprises Holdings Limited (Bodiez Protein Water)
- Vyomax Nutrition Limited
- Molecule Beverages Ltd
- Miami Bay Beverage LLC (Trimino)
- Aquatein
- Fizzique LLC
- Protein2o Inc
- Agropur Inc (BiPro USA)
- Glanbia PLC (Optimum Nutrition Inc)
Key Developments in Protein Water Industry Industry
- July 2022: Aquatein launches three new products and expands distribution to 1200 points of sale in India, and plans international expansion in the MENA region.
- April 2022: Vieve launches a new range of vegan protein waters in the UK.
- August 2021: All Market Inc. launches PWR LIFT, a new line of protein-infused waters.
Strategic Protein Water Industry Market Forecast
The protein water market is poised for robust growth over the forecast period (2025-2033), driven by increasing consumer demand, product innovation, and expansion into new markets. Continued technological advancements, coupled with favorable regulatory environments in key regions, will further propel market expansion. The market is expected to witness significant value growth, driven by both volume increases and premium product offerings. New product launches and strategic partnerships will shape the competitive landscape.
Protein Water Industry Segmentation
-
1. Type
- 1.1. Flavored
- 1.2. Unflavored
-
2. Distribution Channel
- 2.1. Supermarkets/Hypermarkets
- 2.2. Convenience Stores
- 2.3. Online Channels
- 2.4. Others
Protein Water Industry Segmentation By Geography
-
1. North America
- 1.1. United States
- 1.2. Canada
- 1.3. Mexico
- 1.4. Rest of North America
-
2. Europe
- 2.1. Spain
- 2.2. United Kingdom
- 2.3. Germany
- 2.4. France
- 2.5. Italy
- 2.6. Russia
- 2.7. Rest of Europe
-
3. Asia Pacific
- 3.1. China
- 3.2. Japan
- 3.3. India
- 3.4. Australia
- 3.5. Rest of Asia Pacific
-
4. South America
- 4.1. Brazil
- 4.2. Argentina
- 4.3. Rest of South America
-
5. Middle East and Africa
- 5.1. South Africa
- 5.2. Saudi Arabia
- 5.3. Rest of Middle East and Africa
Protein Water Industry REPORT HIGHLIGHTS
| Aspects | Details |
|---|---|
| Study Period | 2019-2033 |
| Base Year | 2024 |
| Estimated Year | 2025 |
| Forecast Period | 2025-2033 |
| Historical Period | 2019-2024 |
| Growth Rate | CAGR of 5.50% from 2019-2033 |
| Segmentation |
|
Table of Contents
- 1. Introduction
- 1.1. Research Scope
- 1.2. Market Segmentation
- 1.3. Research Methodology
- 1.4. Definitions and Assumptions
- 2. Executive Summary
- 2.1. Introduction
- 3. Market Dynamics
- 3.1. Introduction
- 3.2. Market Drivers
- 3.2.1. Increasing awareness towards fitness among consumers; Demand for convenient fortified foods
- 3.3. Market Restrains
- 3.3.1. Increasing vegan culture in the market
- 3.4. Market Trends
- 3.4.1. Increased Participation in the Sports Activities
- 4. Market Factor Analysis
- 4.1. Porters Five Forces
- 4.2. Supply/Value Chain
- 4.3. PESTEL analysis
- 4.4. Market Entropy
- 4.5. Patent/Trademark Analysis
- 5. Global Protein Water Industry Analysis, Insights and Forecast, 2019-2031
- 5.1. Market Analysis, Insights and Forecast - by Type
- 5.1.1. Flavored
- 5.1.2. Unflavored
- 5.2. Market Analysis, Insights and Forecast - by Distribution Channel
- 5.2.1. Supermarkets/Hypermarkets
- 5.2.2. Convenience Stores
- 5.2.3. Online Channels
- 5.2.4. Others
- 5.3. Market Analysis, Insights and Forecast - by Region
- 5.3.1. North America
- 5.3.2. Europe
- 5.3.3. Asia Pacific
- 5.3.4. South America
- 5.3.5. Middle East and Africa
- 5.1. Market Analysis, Insights and Forecast - by Type
- 6. North America Protein Water Industry Analysis, Insights and Forecast, 2019-2031
- 6.1. Market Analysis, Insights and Forecast - by Type
- 6.1.1. Flavored
- 6.1.2. Unflavored
- 6.2. Market Analysis, Insights and Forecast - by Distribution Channel
- 6.2.1. Supermarkets/Hypermarkets
- 6.2.2. Convenience Stores
- 6.2.3. Online Channels
- 6.2.4. Others
- 6.1. Market Analysis, Insights and Forecast - by Type
- 7. Europe Protein Water Industry Analysis, Insights and Forecast, 2019-2031
- 7.1. Market Analysis, Insights and Forecast - by Type
- 7.1.1. Flavored
- 7.1.2. Unflavored
- 7.2. Market Analysis, Insights and Forecast - by Distribution Channel
- 7.2.1. Supermarkets/Hypermarkets
- 7.2.2. Convenience Stores
- 7.2.3. Online Channels
- 7.2.4. Others
- 7.1. Market Analysis, Insights and Forecast - by Type
- 8. Asia Pacific Protein Water Industry Analysis, Insights and Forecast, 2019-2031
- 8.1. Market Analysis, Insights and Forecast - by Type
- 8.1.1. Flavored
- 8.1.2. Unflavored
- 8.2. Market Analysis, Insights and Forecast - by Distribution Channel
- 8.2.1. Supermarkets/Hypermarkets
- 8.2.2. Convenience Stores
- 8.2.3. Online Channels
- 8.2.4. Others
- 8.1. Market Analysis, Insights and Forecast - by Type
- 9. South America Protein Water Industry Analysis, Insights and Forecast, 2019-2031
- 9.1. Market Analysis, Insights and Forecast - by Type
- 9.1.1. Flavored
- 9.1.2. Unflavored
- 9.2. Market Analysis, Insights and Forecast - by Distribution Channel
- 9.2.1. Supermarkets/Hypermarkets
- 9.2.2. Convenience Stores
- 9.2.3. Online Channels
- 9.2.4. Others
- 9.1. Market Analysis, Insights and Forecast - by Type
- 10. Middle East and Africa Protein Water Industry Analysis, Insights and Forecast, 2019-2031
- 10.1. Market Analysis, Insights and Forecast - by Type
- 10.1.1. Flavored
- 10.1.2. Unflavored
- 10.2. Market Analysis, Insights and Forecast - by Distribution Channel
- 10.2.1. Supermarkets/Hypermarkets
- 10.2.2. Convenience Stores
- 10.2.3. Online Channels
- 10.2.4. Others
- 10.1. Market Analysis, Insights and Forecast - by Type
- 11. North America Protein Water Industry Analysis, Insights and Forecast, 2019-2031
- 11.1. Market Analysis, Insights and Forecast - By Country/Sub-region
- 11.1.1 United States
- 11.1.2 Canada
- 11.1.3 Mexico
- 11.1.4 Rest of North America
- 12. Europe Protein Water Industry Analysis, Insights and Forecast, 2019-2031
- 12.1. Market Analysis, Insights and Forecast - By Country/Sub-region
- 12.1.1 Spain
- 12.1.2 United Kingdom
- 12.1.3 Germany
- 12.1.4 France
- 12.1.5 Italy
- 12.1.6 Russia
- 12.1.7 Rest of Europe
- 13. Asia Pacific Protein Water Industry Analysis, Insights and Forecast, 2019-2031
- 13.1. Market Analysis, Insights and Forecast - By Country/Sub-region
- 13.1.1 China
- 13.1.2 Japan
- 13.1.3 India
- 13.1.4 Australia
- 13.1.5 Rest of Asia Pacific
- 14. South America Protein Water Industry Analysis, Insights and Forecast, 2019-2031
- 14.1. Market Analysis, Insights and Forecast - By Country/Sub-region
- 14.1.1 Brazil
- 14.1.2 Argentina
- 14.1.3 Rest of South America
- 15. Middle East and Africa Protein Water Industry Analysis, Insights and Forecast, 2019-2031
- 15.1. Market Analysis, Insights and Forecast - By Country/Sub-region
- 15.1.1 South Africa
- 15.1.2 Saudi Arabia
- 15.1.3 Rest of Middle East and Africa
- 16. Competitive Analysis
- 16.1. Global Market Share Analysis 2024
- 16.2. Company Profiles
- 16.2.1 Arla Foods amba
- 16.2.1.1. Overview
- 16.2.1.2. Products
- 16.2.1.3. SWOT Analysis
- 16.2.1.4. Recent Developments
- 16.2.1.5. Financials (Based on Availability)
- 16.2.2 Richmond Enterprises Holdings Limited (Bodiez Protein Water)
- 16.2.2.1. Overview
- 16.2.2.2. Products
- 16.2.2.3. SWOT Analysis
- 16.2.2.4. Recent Developments
- 16.2.2.5. Financials (Based on Availability)
- 16.2.3 Vyomax Nutrition Limited
- 16.2.3.1. Overview
- 16.2.3.2. Products
- 16.2.3.3. SWOT Analysis
- 16.2.3.4. Recent Developments
- 16.2.3.5. Financials (Based on Availability)
- 16.2.4 Molecule Beverages Ltd
- 16.2.4.1. Overview
- 16.2.4.2. Products
- 16.2.4.3. SWOT Analysis
- 16.2.4.4. Recent Developments
- 16.2.4.5. Financials (Based on Availability)
- 16.2.5 Miami Bay Beverage LLC (Trimino)*List Not Exhaustive
- 16.2.5.1. Overview
- 16.2.5.2. Products
- 16.2.5.3. SWOT Analysis
- 16.2.5.4. Recent Developments
- 16.2.5.5. Financials (Based on Availability)
- 16.2.6 Aquatein
- 16.2.6.1. Overview
- 16.2.6.2. Products
- 16.2.6.3. SWOT Analysis
- 16.2.6.4. Recent Developments
- 16.2.6.5. Financials (Based on Availability)
- 16.2.7 Fizzique LLC
- 16.2.7.1. Overview
- 16.2.7.2. Products
- 16.2.7.3. SWOT Analysis
- 16.2.7.4. Recent Developments
- 16.2.7.5. Financials (Based on Availability)
- 16.2.8 Protein2o Inc
- 16.2.8.1. Overview
- 16.2.8.2. Products
- 16.2.8.3. SWOT Analysis
- 16.2.8.4. Recent Developments
- 16.2.8.5. Financials (Based on Availability)
- 16.2.9 Agropur Inc (BiPro USA)
- 16.2.9.1. Overview
- 16.2.9.2. Products
- 16.2.9.3. SWOT Analysis
- 16.2.9.4. Recent Developments
- 16.2.9.5. Financials (Based on Availability)
- 16.2.10 Glanbia PLC (Optimum Nutrition Inc )
- 16.2.10.1. Overview
- 16.2.10.2. Products
- 16.2.10.3. SWOT Analysis
- 16.2.10.4. Recent Developments
- 16.2.10.5. Financials (Based on Availability)
- 16.2.1 Arla Foods amba
List of Figures
- Figure 1: Global Protein Water Industry Revenue Breakdown (Million, %) by Region 2024 & 2032
- Figure 2: Global Protein Water Industry Volume Breakdown (liter , %) by Region 2024 & 2032
- Figure 3: North America Protein Water Industry Revenue (Million), by Country 2024 & 2032
- Figure 4: North America Protein Water Industry Volume (liter ), by Country 2024 & 2032
- Figure 5: North America Protein Water Industry Revenue Share (%), by Country 2024 & 2032
- Figure 6: North America Protein Water Industry Volume Share (%), by Country 2024 & 2032
- Figure 7: Europe Protein Water Industry Revenue (Million), by Country 2024 & 2032
- Figure 8: Europe Protein Water Industry Volume (liter ), by Country 2024 & 2032
- Figure 9: Europe Protein Water Industry Revenue Share (%), by Country 2024 & 2032
- Figure 10: Europe Protein Water Industry Volume Share (%), by Country 2024 & 2032
- Figure 11: Asia Pacific Protein Water Industry Revenue (Million), by Country 2024 & 2032
- Figure 12: Asia Pacific Protein Water Industry Volume (liter ), by Country 2024 & 2032
- Figure 13: Asia Pacific Protein Water Industry Revenue Share (%), by Country 2024 & 2032
- Figure 14: Asia Pacific Protein Water Industry Volume Share (%), by Country 2024 & 2032
- Figure 15: South America Protein Water Industry Revenue (Million), by Country 2024 & 2032
- Figure 16: South America Protein Water Industry Volume (liter ), by Country 2024 & 2032
- Figure 17: South America Protein Water Industry Revenue Share (%), by Country 2024 & 2032
- Figure 18: South America Protein Water Industry Volume Share (%), by Country 2024 & 2032
- Figure 19: Middle East and Africa Protein Water Industry Revenue (Million), by Country 2024 & 2032
- Figure 20: Middle East and Africa Protein Water Industry Volume (liter ), by Country 2024 & 2032
- Figure 21: Middle East and Africa Protein Water Industry Revenue Share (%), by Country 2024 & 2032
- Figure 22: Middle East and Africa Protein Water Industry Volume Share (%), by Country 2024 & 2032
- Figure 23: North America Protein Water Industry Revenue (Million), by Type 2024 & 2032
- Figure 24: North America Protein Water Industry Volume (liter ), by Type 2024 & 2032
- Figure 25: North America Protein Water Industry Revenue Share (%), by Type 2024 & 2032
- Figure 26: North America Protein Water Industry Volume Share (%), by Type 2024 & 2032
- Figure 27: North America Protein Water Industry Revenue (Million), by Distribution Channel 2024 & 2032
- Figure 28: North America Protein Water Industry Volume (liter ), by Distribution Channel 2024 & 2032
- Figure 29: North America Protein Water Industry Revenue Share (%), by Distribution Channel 2024 & 2032
- Figure 30: North America Protein Water Industry Volume Share (%), by Distribution Channel 2024 & 2032
- Figure 31: North America Protein Water Industry Revenue (Million), by Country 2024 & 2032
- Figure 32: North America Protein Water Industry Volume (liter ), by Country 2024 & 2032
- Figure 33: North America Protein Water Industry Revenue Share (%), by Country 2024 & 2032
- Figure 34: North America Protein Water Industry Volume Share (%), by Country 2024 & 2032
- Figure 35: Europe Protein Water Industry Revenue (Million), by Type 2024 & 2032
- Figure 36: Europe Protein Water Industry Volume (liter ), by Type 2024 & 2032
- Figure 37: Europe Protein Water Industry Revenue Share (%), by Type 2024 & 2032
- Figure 38: Europe Protein Water Industry Volume Share (%), by Type 2024 & 2032
- Figure 39: Europe Protein Water Industry Revenue (Million), by Distribution Channel 2024 & 2032
- Figure 40: Europe Protein Water Industry Volume (liter ), by Distribution Channel 2024 & 2032
- Figure 41: Europe Protein Water Industry Revenue Share (%), by Distribution Channel 2024 & 2032
- Figure 42: Europe Protein Water Industry Volume Share (%), by Distribution Channel 2024 & 2032
- Figure 43: Europe Protein Water Industry Revenue (Million), by Country 2024 & 2032
- Figure 44: Europe Protein Water Industry Volume (liter ), by Country 2024 & 2032
- Figure 45: Europe Protein Water Industry Revenue Share (%), by Country 2024 & 2032
- Figure 46: Europe Protein Water Industry Volume Share (%), by Country 2024 & 2032
- Figure 47: Asia Pacific Protein Water Industry Revenue (Million), by Type 2024 & 2032
- Figure 48: Asia Pacific Protein Water Industry Volume (liter ), by Type 2024 & 2032
- Figure 49: Asia Pacific Protein Water Industry Revenue Share (%), by Type 2024 & 2032
- Figure 50: Asia Pacific Protein Water Industry Volume Share (%), by Type 2024 & 2032
- Figure 51: Asia Pacific Protein Water Industry Revenue (Million), by Distribution Channel 2024 & 2032
- Figure 52: Asia Pacific Protein Water Industry Volume (liter ), by Distribution Channel 2024 & 2032
- Figure 53: Asia Pacific Protein Water Industry Revenue Share (%), by Distribution Channel 2024 & 2032
- Figure 54: Asia Pacific Protein Water Industry Volume Share (%), by Distribution Channel 2024 & 2032
- Figure 55: Asia Pacific Protein Water Industry Revenue (Million), by Country 2024 & 2032
- Figure 56: Asia Pacific Protein Water Industry Volume (liter ), by Country 2024 & 2032
- Figure 57: Asia Pacific Protein Water Industry Revenue Share (%), by Country 2024 & 2032
- Figure 58: Asia Pacific Protein Water Industry Volume Share (%), by Country 2024 & 2032
- Figure 59: South America Protein Water Industry Revenue (Million), by Type 2024 & 2032
- Figure 60: South America Protein Water Industry Volume (liter ), by Type 2024 & 2032
- Figure 61: South America Protein Water Industry Revenue Share (%), by Type 2024 & 2032
- Figure 62: South America Protein Water Industry Volume Share (%), by Type 2024 & 2032
- Figure 63: South America Protein Water Industry Revenue (Million), by Distribution Channel 2024 & 2032
- Figure 64: South America Protein Water Industry Volume (liter ), by Distribution Channel 2024 & 2032
- Figure 65: South America Protein Water Industry Revenue Share (%), by Distribution Channel 2024 & 2032
- Figure 66: South America Protein Water Industry Volume Share (%), by Distribution Channel 2024 & 2032
- Figure 67: South America Protein Water Industry Revenue (Million), by Country 2024 & 2032
- Figure 68: South America Protein Water Industry Volume (liter ), by Country 2024 & 2032
- Figure 69: South America Protein Water Industry Revenue Share (%), by Country 2024 & 2032
- Figure 70: South America Protein Water Industry Volume Share (%), by Country 2024 & 2032
- Figure 71: Middle East and Africa Protein Water Industry Revenue (Million), by Type 2024 & 2032
- Figure 72: Middle East and Africa Protein Water Industry Volume (liter ), by Type 2024 & 2032
- Figure 73: Middle East and Africa Protein Water Industry Revenue Share (%), by Type 2024 & 2032
- Figure 74: Middle East and Africa Protein Water Industry Volume Share (%), by Type 2024 & 2032
- Figure 75: Middle East and Africa Protein Water Industry Revenue (Million), by Distribution Channel 2024 & 2032
- Figure 76: Middle East and Africa Protein Water Industry Volume (liter ), by Distribution Channel 2024 & 2032
- Figure 77: Middle East and Africa Protein Water Industry Revenue Share (%), by Distribution Channel 2024 & 2032
- Figure 78: Middle East and Africa Protein Water Industry Volume Share (%), by Distribution Channel 2024 & 2032
- Figure 79: Middle East and Africa Protein Water Industry Revenue (Million), by Country 2024 & 2032
- Figure 80: Middle East and Africa Protein Water Industry Volume (liter ), by Country 2024 & 2032
- Figure 81: Middle East and Africa Protein Water Industry Revenue Share (%), by Country 2024 & 2032
- Figure 82: Middle East and Africa Protein Water Industry Volume Share (%), by Country 2024 & 2032
List of Tables
- Table 1: Global Protein Water Industry Revenue Million Forecast, by Region 2019 & 2032
- Table 2: Global Protein Water Industry Volume liter Forecast, by Region 2019 & 2032
- Table 3: Global Protein Water Industry Revenue Million Forecast, by Type 2019 & 2032
- Table 4: Global Protein Water Industry Volume liter Forecast, by Type 2019 & 2032
- Table 5: Global Protein Water Industry Revenue Million Forecast, by Distribution Channel 2019 & 2032
- Table 6: Global Protein Water Industry Volume liter Forecast, by Distribution Channel 2019 & 2032
- Table 7: Global Protein Water Industry Revenue Million Forecast, by Region 2019 & 2032
- Table 8: Global Protein Water Industry Volume liter Forecast, by Region 2019 & 2032
- Table 9: Global Protein Water Industry Revenue Million Forecast, by Country 2019 & 2032
- Table 10: Global Protein Water Industry Volume liter Forecast, by Country 2019 & 2032
- Table 11: United States Protein Water Industry Revenue (Million) Forecast, by Application 2019 & 2032
- Table 12: United States Protein Water Industry Volume (liter ) Forecast, by Application 2019 & 2032
- Table 13: Canada Protein Water Industry Revenue (Million) Forecast, by Application 2019 & 2032
- Table 14: Canada Protein Water Industry Volume (liter ) Forecast, by Application 2019 & 2032
- Table 15: Mexico Protein Water Industry Revenue (Million) Forecast, by Application 2019 & 2032
- Table 16: Mexico Protein Water Industry Volume (liter ) Forecast, by Application 2019 & 2032
- Table 17: Rest of North America Protein Water Industry Revenue (Million) Forecast, by Application 2019 & 2032
- Table 18: Rest of North America Protein Water Industry Volume (liter ) Forecast, by Application 2019 & 2032
- Table 19: Global Protein Water Industry Revenue Million Forecast, by Country 2019 & 2032
- Table 20: Global Protein Water Industry Volume liter Forecast, by Country 2019 & 2032
- Table 21: Spain Protein Water Industry Revenue (Million) Forecast, by Application 2019 & 2032
- Table 22: Spain Protein Water Industry Volume (liter ) Forecast, by Application 2019 & 2032
- Table 23: United Kingdom Protein Water Industry Revenue (Million) Forecast, by Application 2019 & 2032
- Table 24: United Kingdom Protein Water Industry Volume (liter ) Forecast, by Application 2019 & 2032
- Table 25: Germany Protein Water Industry Revenue (Million) Forecast, by Application 2019 & 2032
- Table 26: Germany Protein Water Industry Volume (liter ) Forecast, by Application 2019 & 2032
- Table 27: France Protein Water Industry Revenue (Million) Forecast, by Application 2019 & 2032
- Table 28: France Protein Water Industry Volume (liter ) Forecast, by Application 2019 & 2032
- Table 29: Italy Protein Water Industry Revenue (Million) Forecast, by Application 2019 & 2032
- Table 30: Italy Protein Water Industry Volume (liter ) Forecast, by Application 2019 & 2032
- Table 31: Russia Protein Water Industry Revenue (Million) Forecast, by Application 2019 & 2032
- Table 32: Russia Protein Water Industry Volume (liter ) Forecast, by Application 2019 & 2032
- Table 33: Rest of Europe Protein Water Industry Revenue (Million) Forecast, by Application 2019 & 2032
- Table 34: Rest of Europe Protein Water Industry Volume (liter ) Forecast, by Application 2019 & 2032
- Table 35: Global Protein Water Industry Revenue Million Forecast, by Country 2019 & 2032
- Table 36: Global Protein Water Industry Volume liter Forecast, by Country 2019 & 2032
- Table 37: China Protein Water Industry Revenue (Million) Forecast, by Application 2019 & 2032
- Table 38: China Protein Water Industry Volume (liter ) Forecast, by Application 2019 & 2032
- Table 39: Japan Protein Water Industry Revenue (Million) Forecast, by Application 2019 & 2032
- Table 40: Japan Protein Water Industry Volume (liter ) Forecast, by Application 2019 & 2032
- Table 41: India Protein Water Industry Revenue (Million) Forecast, by Application 2019 & 2032
- Table 42: India Protein Water Industry Volume (liter ) Forecast, by Application 2019 & 2032
- Table 43: Australia Protein Water Industry Revenue (Million) Forecast, by Application 2019 & 2032
- Table 44: Australia Protein Water Industry Volume (liter ) Forecast, by Application 2019 & 2032
- Table 45: Rest of Asia Pacific Protein Water Industry Revenue (Million) Forecast, by Application 2019 & 2032
- Table 46: Rest of Asia Pacific Protein Water Industry Volume (liter ) Forecast, by Application 2019 & 2032
- Table 47: Global Protein Water Industry Revenue Million Forecast, by Country 2019 & 2032
- Table 48: Global Protein Water Industry Volume liter Forecast, by Country 2019 & 2032
- Table 49: Brazil Protein Water Industry Revenue (Million) Forecast, by Application 2019 & 2032
- Table 50: Brazil Protein Water Industry Volume (liter ) Forecast, by Application 2019 & 2032
- Table 51: Argentina Protein Water Industry Revenue (Million) Forecast, by Application 2019 & 2032
- Table 52: Argentina Protein Water Industry Volume (liter ) Forecast, by Application 2019 & 2032
- Table 53: Rest of South America Protein Water Industry Revenue (Million) Forecast, by Application 2019 & 2032
- Table 54: Rest of South America Protein Water Industry Volume (liter ) Forecast, by Application 2019 & 2032
- Table 55: Global Protein Water Industry Revenue Million Forecast, by Country 2019 & 2032
- Table 56: Global Protein Water Industry Volume liter Forecast, by Country 2019 & 2032
- Table 57: South Africa Protein Water Industry Revenue (Million) Forecast, by Application 2019 & 2032
- Table 58: South Africa Protein Water Industry Volume (liter ) Forecast, by Application 2019 & 2032
- Table 59: Saudi Arabia Protein Water Industry Revenue (Million) Forecast, by Application 2019 & 2032
- Table 60: Saudi Arabia Protein Water Industry Volume (liter ) Forecast, by Application 2019 & 2032
- Table 61: Rest of Middle East and Africa Protein Water Industry Revenue (Million) Forecast, by Application 2019 & 2032
- Table 62: Rest of Middle East and Africa Protein Water Industry Volume (liter ) Forecast, by Application 2019 & 2032
- Table 63: Global Protein Water Industry Revenue Million Forecast, by Type 2019 & 2032
- Table 64: Global Protein Water Industry Volume liter Forecast, by Type 2019 & 2032
- Table 65: Global Protein Water Industry Revenue Million Forecast, by Distribution Channel 2019 & 2032
- Table 66: Global Protein Water Industry Volume liter Forecast, by Distribution Channel 2019 & 2032
- Table 67: Global Protein Water Industry Revenue Million Forecast, by Country 2019 & 2032
- Table 68: Global Protein Water Industry Volume liter Forecast, by Country 2019 & 2032
- Table 69: United States Protein Water Industry Revenue (Million) Forecast, by Application 2019 & 2032
- Table 70: United States Protein Water Industry Volume (liter ) Forecast, by Application 2019 & 2032
- Table 71: Canada Protein Water Industry Revenue (Million) Forecast, by Application 2019 & 2032
- Table 72: Canada Protein Water Industry Volume (liter ) Forecast, by Application 2019 & 2032
- Table 73: Mexico Protein Water Industry Revenue (Million) Forecast, by Application 2019 & 2032
- Table 74: Mexico Protein Water Industry Volume (liter ) Forecast, by Application 2019 & 2032
- Table 75: Rest of North America Protein Water Industry Revenue (Million) Forecast, by Application 2019 & 2032
- Table 76: Rest of North America Protein Water Industry Volume (liter ) Forecast, by Application 2019 & 2032
- Table 77: Global Protein Water Industry Revenue Million Forecast, by Type 2019 & 2032
- Table 78: Global Protein Water Industry Volume liter Forecast, by Type 2019 & 2032
- Table 79: Global Protein Water Industry Revenue Million Forecast, by Distribution Channel 2019 & 2032
- Table 80: Global Protein Water Industry Volume liter Forecast, by Distribution Channel 2019 & 2032
- Table 81: Global Protein Water Industry Revenue Million Forecast, by Country 2019 & 2032
- Table 82: Global Protein Water Industry Volume liter Forecast, by Country 2019 & 2032
- Table 83: Spain Protein Water Industry Revenue (Million) Forecast, by Application 2019 & 2032
- Table 84: Spain Protein Water Industry Volume (liter ) Forecast, by Application 2019 & 2032
- Table 85: United Kingdom Protein Water Industry Revenue (Million) Forecast, by Application 2019 & 2032
- Table 86: United Kingdom Protein Water Industry Volume (liter ) Forecast, by Application 2019 & 2032
- Table 87: Germany Protein Water Industry Revenue (Million) Forecast, by Application 2019 & 2032
- Table 88: Germany Protein Water Industry Volume (liter ) Forecast, by Application 2019 & 2032
- Table 89: France Protein Water Industry Revenue (Million) Forecast, by Application 2019 & 2032
- Table 90: France Protein Water Industry Volume (liter ) Forecast, by Application 2019 & 2032
- Table 91: Italy Protein Water Industry Revenue (Million) Forecast, by Application 2019 & 2032
- Table 92: Italy Protein Water Industry Volume (liter ) Forecast, by Application 2019 & 2032
- Table 93: Russia Protein Water Industry Revenue (Million) Forecast, by Application 2019 & 2032
- Table 94: Russia Protein Water Industry Volume (liter ) Forecast, by Application 2019 & 2032
- Table 95: Rest of Europe Protein Water Industry Revenue (Million) Forecast, by Application 2019 & 2032
- Table 96: Rest of Europe Protein Water Industry Volume (liter ) Forecast, by Application 2019 & 2032
- Table 97: Global Protein Water Industry Revenue Million Forecast, by Type 2019 & 2032
- Table 98: Global Protein Water Industry Volume liter Forecast, by Type 2019 & 2032
- Table 99: Global Protein Water Industry Revenue Million Forecast, by Distribution Channel 2019 & 2032
- Table 100: Global Protein Water Industry Volume liter Forecast, by Distribution Channel 2019 & 2032
- Table 101: Global Protein Water Industry Revenue Million Forecast, by Country 2019 & 2032
- Table 102: Global Protein Water Industry Volume liter Forecast, by Country 2019 & 2032
- Table 103: China Protein Water Industry Revenue (Million) Forecast, by Application 2019 & 2032
- Table 104: China Protein Water Industry Volume (liter ) Forecast, by Application 2019 & 2032
- Table 105: Japan Protein Water Industry Revenue (Million) Forecast, by Application 2019 & 2032
- Table 106: Japan Protein Water Industry Volume (liter ) Forecast, by Application 2019 & 2032
- Table 107: India Protein Water Industry Revenue (Million) Forecast, by Application 2019 & 2032
- Table 108: India Protein Water Industry Volume (liter ) Forecast, by Application 2019 & 2032
- Table 109: Australia Protein Water Industry Revenue (Million) Forecast, by Application 2019 & 2032
- Table 110: Australia Protein Water Industry Volume (liter ) Forecast, by Application 2019 & 2032
- Table 111: Rest of Asia Pacific Protein Water Industry Revenue (Million) Forecast, by Application 2019 & 2032
- Table 112: Rest of Asia Pacific Protein Water Industry Volume (liter ) Forecast, by Application 2019 & 2032
- Table 113: Global Protein Water Industry Revenue Million Forecast, by Type 2019 & 2032
- Table 114: Global Protein Water Industry Volume liter Forecast, by Type 2019 & 2032
- Table 115: Global Protein Water Industry Revenue Million Forecast, by Distribution Channel 2019 & 2032
- Table 116: Global Protein Water Industry Volume liter Forecast, by Distribution Channel 2019 & 2032
- Table 117: Global Protein Water Industry Revenue Million Forecast, by Country 2019 & 2032
- Table 118: Global Protein Water Industry Volume liter Forecast, by Country 2019 & 2032
- Table 119: Brazil Protein Water Industry Revenue (Million) Forecast, by Application 2019 & 2032
- Table 120: Brazil Protein Water Industry Volume (liter ) Forecast, by Application 2019 & 2032
- Table 121: Argentina Protein Water Industry Revenue (Million) Forecast, by Application 2019 & 2032
- Table 122: Argentina Protein Water Industry Volume (liter ) Forecast, by Application 2019 & 2032
- Table 123: Rest of South America Protein Water Industry Revenue (Million) Forecast, by Application 2019 & 2032
- Table 124: Rest of South America Protein Water Industry Volume (liter ) Forecast, by Application 2019 & 2032
- Table 125: Global Protein Water Industry Revenue Million Forecast, by Type 2019 & 2032
- Table 126: Global Protein Water Industry Volume liter Forecast, by Type 2019 & 2032
- Table 127: Global Protein Water Industry Revenue Million Forecast, by Distribution Channel 2019 & 2032
- Table 128: Global Protein Water Industry Volume liter Forecast, by Distribution Channel 2019 & 2032
- Table 129: Global Protein Water Industry Revenue Million Forecast, by Country 2019 & 2032
- Table 130: Global Protein Water Industry Volume liter Forecast, by Country 2019 & 2032
- Table 131: South Africa Protein Water Industry Revenue (Million) Forecast, by Application 2019 & 2032
- Table 132: South Africa Protein Water Industry Volume (liter ) Forecast, by Application 2019 & 2032
- Table 133: Saudi Arabia Protein Water Industry Revenue (Million) Forecast, by Application 2019 & 2032
- Table 134: Saudi Arabia Protein Water Industry Volume (liter ) Forecast, by Application 2019 & 2032
- Table 135: Rest of Middle East and Africa Protein Water Industry Revenue (Million) Forecast, by Application 2019 & 2032
- Table 136: Rest of Middle East and Africa Protein Water Industry Volume (liter ) Forecast, by Application 2019 & 2032
Frequently Asked Questions
1. What is the projected Compound Annual Growth Rate (CAGR) of the Protein Water Industry?
The projected CAGR is approximately 5.50%.
2. Which companies are prominent players in the Protein Water Industry?
Key companies in the market include Arla Foods amba, Richmond Enterprises Holdings Limited (Bodiez Protein Water), Vyomax Nutrition Limited, Molecule Beverages Ltd, Miami Bay Beverage LLC (Trimino)*List Not Exhaustive, Aquatein, Fizzique LLC, Protein2o Inc, Agropur Inc (BiPro USA), Glanbia PLC (Optimum Nutrition Inc ).
3. What are the main segments of the Protein Water Industry?
The market segments include Type, Distribution Channel.
4. Can you provide details about the market size?
The market size is estimated to be USD 1187.1 Million as of 2022.
5. What are some drivers contributing to market growth?
Increasing awareness towards fitness among consumers; Demand for convenient fortified foods.
6. What are the notable trends driving market growth?
Increased Participation in the Sports Activities.
7. Are there any restraints impacting market growth?
Increasing vegan culture in the market.
8. Can you provide examples of recent developments in the market?
In July 2022, Mumbai-based Aquatein (Athlex Beverages Private Limited), India's first protein water brand launched three new products. Through its strategic offline partnerships, the brand is all set to roll out 1200 direct points of sales and also launch the brand internationally through strategic local partnerships in the Middle East and North Africa (MENA) region.
9. What pricing options are available for accessing the report?
Pricing options include single-user, multi-user, and enterprise licenses priced at USD 4750, USD 5250, and USD 8750 respectively.
10. Is the market size provided in terms of value or volume?
The market size is provided in terms of value, measured in Million and volume, measured in liter .
11. Are there any specific market keywords associated with the report?
Yes, the market keyword associated with the report is "Protein Water Industry," which aids in identifying and referencing the specific market segment covered.
12. How do I determine which pricing option suits my needs best?
The pricing options vary based on user requirements and access needs. Individual users may opt for single-user licenses, while businesses requiring broader access may choose multi-user or enterprise licenses for cost-effective access to the report.
13. Are there any additional resources or data provided in the Protein Water Industry report?
While the report offers comprehensive insights, it's advisable to review the specific contents or supplementary materials provided to ascertain if additional resources or data are available.
14. How can I stay updated on further developments or reports in the Protein Water Industry?
To stay informed about further developments, trends, and reports in the Protein Water Industry, consider subscribing to industry newsletters, following relevant companies and organizations, or regularly checking reputable industry news sources and publications.
Methodology
Step 1 - Identification of Relevant Samples Size from Population Database


Step 2 - Approaches for Defining Global Market Size (Value, Volume* & Price*)

Note*: In applicable scenarios
Step 3 - Data Sources
Primary Research
- Web Analytics
- Survey Reports
- Research Institute
- Latest Research Reports
- Opinion Leaders
Secondary Research
- Annual Reports
- White Paper
- Latest Press Release
- Industry Association
- Paid Database
- Investor Presentations

Step 4 - Data Triangulation
Involves using different sources of information in order to increase the validity of a study
These sources are likely to be stakeholders in a program - participants, other researchers, program staff, other community members, and so on.
Then we put all data in single framework & apply various statistical tools to find out the dynamic on the market.
During the analysis stage, feedback from the stakeholder groups would be compared to determine areas of agreement as well as areas of divergence
