

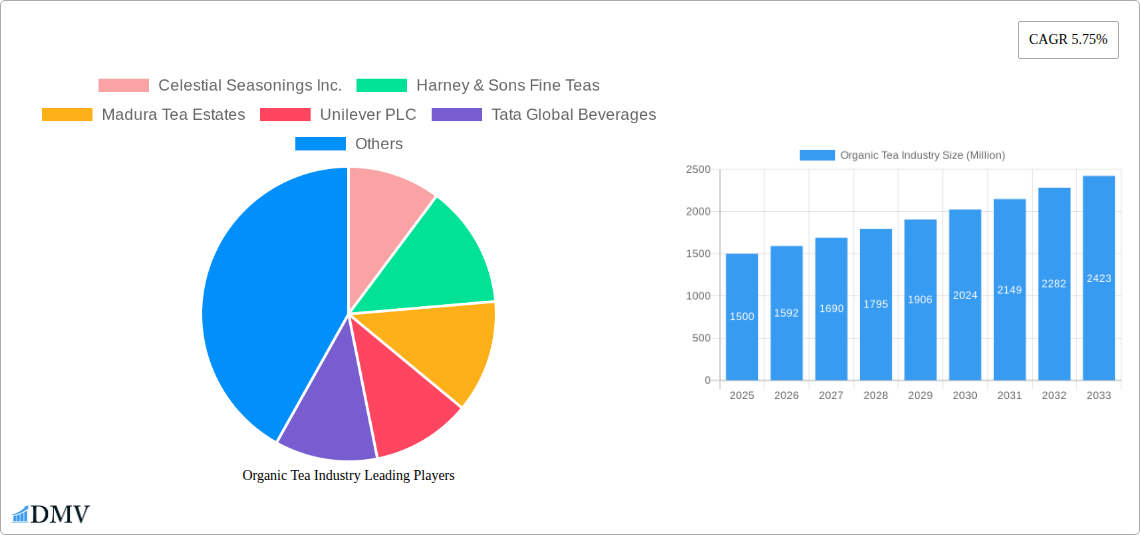
Key Insights
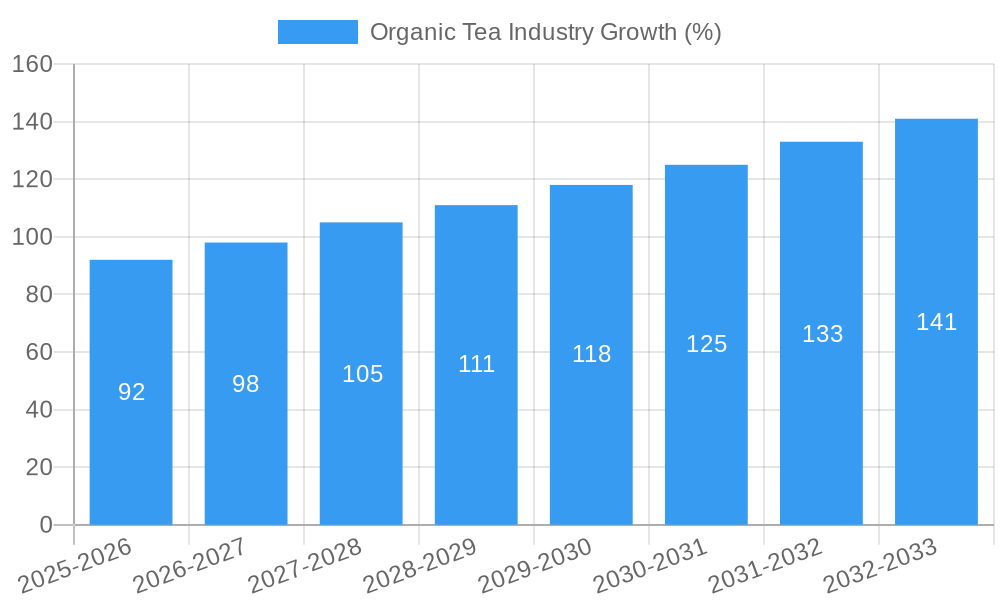
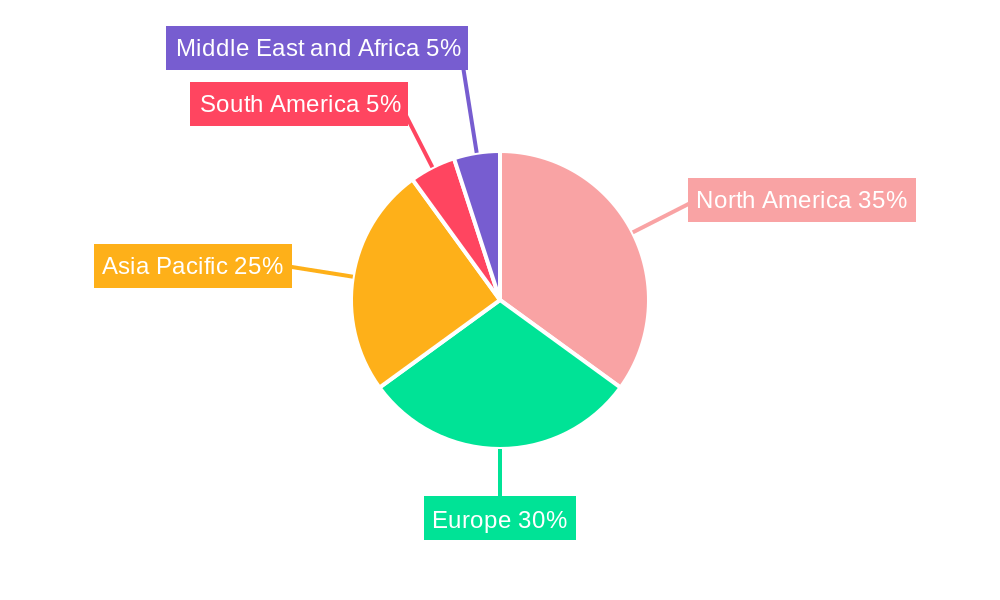
The organic tea market, valued at approximately $XX million in 2025, is projected to experience robust growth, driven by rising health consciousness, increasing disposable incomes in developing economies, and a growing preference for natural and sustainable products. A Compound Annual Growth Rate (CAGR) of 5.75% from 2025 to 2033 indicates a significant expansion of this market. Key drivers include the well-documented health benefits associated with organic tea consumption – antioxidants, improved immunity, and potential benefits for weight management – which are increasingly emphasized in marketing campaigns. Consumer trends are shifting towards convenient packaging formats like tea bags and individual portioned sachets, alongside a growing demand for diverse organic tea varieties beyond traditional black and green teas, such as herbal infusions and fruit-infused blends. While price sensitivity remains a restraint in certain markets, the premium positioning of organic tea is counterbalanced by its perceived higher quality and health benefits. The market segmentation reveals a strong presence across various distribution channels, with supermarkets and online retail platforms competing for market share. Leading companies are investing heavily in product innovation, sustainable sourcing practices, and brand building to gain a competitive edge. Regional variations in market penetration exist, with North America and Europe currently holding significant shares, while Asia-Pacific presents substantial growth potential due to its large population and increasing adoption of Western lifestyle trends.
The segmentation of the organic tea market offers further insight into growth opportunities. Black organic tea maintains a significant market share, but the "Other Types" segment, encompassing herbal and fruit infusions, is predicted to see above-average growth fueled by evolving consumer preferences. Similarly, convenient packaging like tea bags is dominant, but the "Other Packaging Types," particularly those emphasizing sustainability (e.g., biodegradable materials), are poised for expansion. Online retail channels are showing the fastest growth, reflecting the increasing consumer reliance on e-commerce for grocery purchases. Competitive dynamics are shaped by established international brands and regional players, each leveraging different strategies to cater to specific consumer segments and geographic markets. Future growth will likely be driven by effective marketing highlighting the health and sustainability aspects of organic tea, coupled with innovation in product offerings and packaging to meet evolving consumer demands.
Organic Tea Industry: A Comprehensive Market Report (2019-2033)
This insightful report provides a detailed analysis of the global organic tea market, encompassing historical data (2019-2024), current estimates (2025), and future forecasts (2025-2033). It offers invaluable insights for stakeholders, investors, and industry professionals seeking a comprehensive understanding of this dynamic sector. The global organic tea market is projected to reach xx Million by 2033, showcasing significant growth potential.
Organic Tea Industry Market Composition & Trends
The organic tea market exhibits a moderately concentrated landscape, with key players like Unilever PLC, Tata Global Beverages, and Celestial Seasonings Inc. holding significant market share. However, smaller, specialized brands like Numi Inc PBC and Equal Exchange are also gaining traction. Market share distribution is influenced by brand recognition, product differentiation (e.g., unique blends, organic certifications), and distribution network reach. Innovation, particularly in product formats (e.g., ready-to-drink teas, sparkling teas) and sustainable packaging, is a key catalyst for growth. The regulatory landscape varies across regions, impacting organic certification standards and labeling requirements. Substitute products, such as herbal infusions and fruit juices, pose a competitive threat, while the increasing health-consciousness among consumers fuels market demand. M&A activity is moderate, with deal values averaging xx Million in recent years. Examples include [Insert Specific M&A Examples if available, or state "Specific M&A details are not currently available"].
- Market Concentration: Moderately concentrated, with a few major players and several niche brands.
- Innovation Catalysts: Product diversification (ready-to-drink, functional teas), sustainable packaging.
- Regulatory Landscape: Varies by region, impacting certification and labeling.
- Substitute Products: Herbal infusions, fruit juices.
- End-User Profiles: Health-conscious consumers, millennials, Gen Z.
- M&A Activity: Moderate, with average deal values of xx Million.
Organic Tea Industry Industry Evolution
The organic tea industry has experienced consistent growth over the historical period (2019-2024), driven by rising consumer awareness of health benefits and a preference for natural products. The market witnessed a Compound Annual Growth Rate (CAGR) of xx% during this period. This growth trajectory is expected to continue, albeit at a slightly moderated pace, during the forecast period (2025-2033), with a projected CAGR of xx%. Technological advancements, such as improved tea processing techniques and innovative packaging solutions, have enhanced product quality and shelf life. Consumer demand is shifting towards convenience formats (ready-to-drink, single-serve tea bags) and functional teas (immunity-boosting, detoxifying). Premiumization is also a significant trend, with consumers willing to pay a premium for high-quality, ethically sourced organic teas. The market is characterized by increasing sophistication in branding and marketing, with companies focusing on storytelling and highlighting sustainability initiatives.
Leading Regions, Countries, or Segments in Organic Tea Industry
The North American market currently dominates the organic tea industry, driven by high consumer demand for health and wellness products and established distribution networks. Within this region, the U.S. holds the largest market share. However, Asia, particularly India and China, remains a significant producer of organic tea, with substantial growth potential. In terms of segments:
- Type: Black organic tea remains the largest segment due to its widespread popularity, followed by green organic tea.
- Packaging: Teabags are the dominant packaging type due to convenience, followed by cartons.
- Distribution Channel: Supermarkets/Hypermarkets hold the largest market share due to their wide reach.
Key Drivers:
- High consumer demand for health and wellness products
- Strong presence of established brands
- Well-developed distribution channels
- Government support for organic farming and certifications
The dominance of North America is attributed to factors such as high disposable incomes, strong consumer awareness regarding health and wellness, and the presence of major players with strong distribution networks.
Organic Tea Industry Product Innovations
Recent innovations in the organic tea market include the rise of ready-to-drink organic iced teas, sparkling organic teas infused with superfoods and fruit juices, and functional teas designed to boost immunity or aid digestion. These innovations focus on convenience, enhanced taste profiles, and added health benefits, catering to evolving consumer preferences. Technological advancements in tea processing, such as improved extraction methods and precision fermentation, have enhanced product quality and consistency. Unique selling propositions often center around certifications (organic, fair trade), sourcing transparency, and unique flavor combinations.
Propelling Factors for Organic Tea Industry Growth
The organic tea market is propelled by several factors: increasing health consciousness among consumers leading to greater demand for natural and healthy beverages, the growing popularity of functional beverages offering specific health benefits, and a rising preference for sustainably produced products, boosting demand for organically grown tea. Government initiatives promoting organic farming and stricter regulations on food labeling create opportunities for organic tea producers. Technological advancements in packaging and processing methods improve quality and extend shelf life, further driving growth.
Obstacles in the Organic Tea Industry Market
The organic tea market faces challenges including fluctuating raw material prices and the potential for supply chain disruptions due to factors such as adverse weather conditions or geopolitical instability. Stricter regulations on organic certification and labeling can increase production costs. Intense competition from conventional tea brands and other beverage categories, such as herbal infusions and fruit juices, also puts pressure on margins.
Future Opportunities in Organic Tea Industry
Significant opportunities exist in expanding into emerging markets with increasing disposable incomes and health-conscious populations. Further innovation in product formats, such as unique tea blends, functional teas, and convenient packaging, will attract new consumers. The growing interest in sustainability and ethical sourcing presents opportunities for companies that prioritize these aspects. Leveraging online retail channels and direct-to-consumer models will enhance reach and brand loyalty.
Major Players in the Organic Tea Industry Ecosystem
- Celestial Seasonings Inc.
- Harney & Sons Fine Teas
- Madura Tea Estates
- Unilever PLC
- Tata Global Beverages
- Equal Exchange Fairly Traded
- Numi Inc PBC
- Halssen & Lyon
- Shangri-la Tea
- Organic India
Key Developments in Organic Tea Industry Industry
- September 2021: Launch of mymuse organic, a line of immunity-supporting enhanced waters and teas.
- November 2022: 8th Wonder Tea launched its line of organic sparkling teas on Amazon.
- March 2023: Eat the Change expanded its ready-to-drink organic iced tea line with three new varieties.
Strategic Organic Tea Industry Market Forecast
The organic tea market is poised for continued growth, driven by persistent consumer demand for healthy and sustainable products. Innovation in product formats, expansion into new markets, and strategic partnerships will shape future market dynamics. The focus on premiumization, functional benefits, and sustainable practices will define the success of players in this competitive landscape. The market is projected to maintain steady growth, reaching xx Million by 2033.
Organic Tea Industry Segmentation
-
1. Type
- 1.1. Black Organic Tea
- 1.2. Green Organic Tea
- 1.3. Oolong Organic Tea
- 1.4. Other Types
-
2. Packaging Type
- 2.1. Cartons
- 2.2. Teabags
- 2.3. Cans
- 2.4. Paper pouches
- 2.5. Other Packaging Types
-
3. Distribution Channel
- 3.1. Supermarkets/Hypermarkets
- 3.2. Convenience/Grocery Stores
- 3.3. Online Retail Stores
- 3.4. Other Distribution Channels
Organic Tea Industry Segmentation By Geography
-
1. North America
- 1.1. United States
- 1.2. Canada
- 1.3. Mexico
- 1.4. Rest of North America
-
2. Europe
- 2.1. United Kingdom
- 2.2. Spain
- 2.3. Germany
- 2.4. France
- 2.5. Italy
- 2.6. Russia
- 2.7. Rest of Europe
-
3. Asia Pacific
- 3.1. China
- 3.2. Japan
- 3.3. India
- 3.4. Australia
- 3.5. Rest of Asia Pacific
-
4. South America
- 4.1. Brazil
- 4.2. Argentina
- 4.3. Rest of South America
-
5. Middle East and Africa
- 5.1. South Africa
- 5.2. Saudi Arabia
- 5.3. Rest of Middle East and Africa
Organic Tea Industry REPORT HIGHLIGHTS
| Aspects | Details |
|---|---|
| Study Period | 2019-2033 |
| Base Year | 2024 |
| Estimated Year | 2025 |
| Forecast Period | 2025-2033 |
| Historical Period | 2019-2024 |
| Growth Rate | CAGR of 5.75% from 2019-2033 |
| Segmentation |
|
Table of Contents
- 1. Introduction
- 1.1. Research Scope
- 1.2. Market Segmentation
- 1.3. Research Methodology
- 1.4. Definitions and Assumptions
- 2. Executive Summary
- 2.1. Introduction
- 3. Market Dynamics
- 3.1. Introduction
- 3.2. Market Drivers
- 3.2.1. Increasing Demand for Herbal Teas; Increasing Consumer Awareness about Health Benefits of Tea
- 3.3. Market Restrains
- 3.3.1. High Cost of Production of Green Tea
- 3.4. Market Trends
- 3.4.1. Consumer Inclination Towards Healthy Beverages
- 4. Market Factor Analysis
- 4.1. Porters Five Forces
- 4.2. Supply/Value Chain
- 4.3. PESTEL analysis
- 4.4. Market Entropy
- 4.5. Patent/Trademark Analysis
- 5. Global Organic Tea Industry Analysis, Insights and Forecast, 2019-2031
- 5.1. Market Analysis, Insights and Forecast - by Type
- 5.1.1. Black Organic Tea
- 5.1.2. Green Organic Tea
- 5.1.3. Oolong Organic Tea
- 5.1.4. Other Types
- 5.2. Market Analysis, Insights and Forecast - by Packaging Type
- 5.2.1. Cartons
- 5.2.2. Teabags
- 5.2.3. Cans
- 5.2.4. Paper pouches
- 5.2.5. Other Packaging Types
- 5.3. Market Analysis, Insights and Forecast - by Distribution Channel
- 5.3.1. Supermarkets/Hypermarkets
- 5.3.2. Convenience/Grocery Stores
- 5.3.3. Online Retail Stores
- 5.3.4. Other Distribution Channels
- 5.4. Market Analysis, Insights and Forecast - by Region
- 5.4.1. North America
- 5.4.2. Europe
- 5.4.3. Asia Pacific
- 5.4.4. South America
- 5.4.5. Middle East and Africa
- 5.1. Market Analysis, Insights and Forecast - by Type
- 6. North America Organic Tea Industry Analysis, Insights and Forecast, 2019-2031
- 6.1. Market Analysis, Insights and Forecast - by Type
- 6.1.1. Black Organic Tea
- 6.1.2. Green Organic Tea
- 6.1.3. Oolong Organic Tea
- 6.1.4. Other Types
- 6.2. Market Analysis, Insights and Forecast - by Packaging Type
- 6.2.1. Cartons
- 6.2.2. Teabags
- 6.2.3. Cans
- 6.2.4. Paper pouches
- 6.2.5. Other Packaging Types
- 6.3. Market Analysis, Insights and Forecast - by Distribution Channel
- 6.3.1. Supermarkets/Hypermarkets
- 6.3.2. Convenience/Grocery Stores
- 6.3.3. Online Retail Stores
- 6.3.4. Other Distribution Channels
- 6.1. Market Analysis, Insights and Forecast - by Type
- 7. Europe Organic Tea Industry Analysis, Insights and Forecast, 2019-2031
- 7.1. Market Analysis, Insights and Forecast - by Type
- 7.1.1. Black Organic Tea
- 7.1.2. Green Organic Tea
- 7.1.3. Oolong Organic Tea
- 7.1.4. Other Types
- 7.2. Market Analysis, Insights and Forecast - by Packaging Type
- 7.2.1. Cartons
- 7.2.2. Teabags
- 7.2.3. Cans
- 7.2.4. Paper pouches
- 7.2.5. Other Packaging Types
- 7.3. Market Analysis, Insights and Forecast - by Distribution Channel
- 7.3.1. Supermarkets/Hypermarkets
- 7.3.2. Convenience/Grocery Stores
- 7.3.3. Online Retail Stores
- 7.3.4. Other Distribution Channels
- 7.1. Market Analysis, Insights and Forecast - by Type
- 8. Asia Pacific Organic Tea Industry Analysis, Insights and Forecast, 2019-2031
- 8.1. Market Analysis, Insights and Forecast - by Type
- 8.1.1. Black Organic Tea
- 8.1.2. Green Organic Tea
- 8.1.3. Oolong Organic Tea
- 8.1.4. Other Types
- 8.2. Market Analysis, Insights and Forecast - by Packaging Type
- 8.2.1. Cartons
- 8.2.2. Teabags
- 8.2.3. Cans
- 8.2.4. Paper pouches
- 8.2.5. Other Packaging Types
- 8.3. Market Analysis, Insights and Forecast - by Distribution Channel
- 8.3.1. Supermarkets/Hypermarkets
- 8.3.2. Convenience/Grocery Stores
- 8.3.3. Online Retail Stores
- 8.3.4. Other Distribution Channels
- 8.1. Market Analysis, Insights and Forecast - by Type
- 9. South America Organic Tea Industry Analysis, Insights and Forecast, 2019-2031
- 9.1. Market Analysis, Insights and Forecast - by Type
- 9.1.1. Black Organic Tea
- 9.1.2. Green Organic Tea
- 9.1.3. Oolong Organic Tea
- 9.1.4. Other Types
- 9.2. Market Analysis, Insights and Forecast - by Packaging Type
- 9.2.1. Cartons
- 9.2.2. Teabags
- 9.2.3. Cans
- 9.2.4. Paper pouches
- 9.2.5. Other Packaging Types
- 9.3. Market Analysis, Insights and Forecast - by Distribution Channel
- 9.3.1. Supermarkets/Hypermarkets
- 9.3.2. Convenience/Grocery Stores
- 9.3.3. Online Retail Stores
- 9.3.4. Other Distribution Channels
- 9.1. Market Analysis, Insights and Forecast - by Type
- 10. Middle East and Africa Organic Tea Industry Analysis, Insights and Forecast, 2019-2031
- 10.1. Market Analysis, Insights and Forecast - by Type
- 10.1.1. Black Organic Tea
- 10.1.2. Green Organic Tea
- 10.1.3. Oolong Organic Tea
- 10.1.4. Other Types
- 10.2. Market Analysis, Insights and Forecast - by Packaging Type
- 10.2.1. Cartons
- 10.2.2. Teabags
- 10.2.3. Cans
- 10.2.4. Paper pouches
- 10.2.5. Other Packaging Types
- 10.3. Market Analysis, Insights and Forecast - by Distribution Channel
- 10.3.1. Supermarkets/Hypermarkets
- 10.3.2. Convenience/Grocery Stores
- 10.3.3. Online Retail Stores
- 10.3.4. Other Distribution Channels
- 10.1. Market Analysis, Insights and Forecast - by Type
- 11. North America Organic Tea Industry Analysis, Insights and Forecast, 2019-2031
- 11.1. Market Analysis, Insights and Forecast - By Country/Sub-region
- 11.1.1 United States
- 11.1.2 Canada
- 11.1.3 Mexico
- 11.1.4 Rest of North America
- 12. Europe Organic Tea Industry Analysis, Insights and Forecast, 2019-2031
- 12.1. Market Analysis, Insights and Forecast - By Country/Sub-region
- 12.1.1 United Kingdom
- 12.1.2 Spain
- 12.1.3 Germany
- 12.1.4 France
- 12.1.5 Italy
- 12.1.6 Russia
- 12.1.7 Rest of Europe
- 13. Asia Pacific Organic Tea Industry Analysis, Insights and Forecast, 2019-2031
- 13.1. Market Analysis, Insights and Forecast - By Country/Sub-region
- 13.1.1 China
- 13.1.2 Japan
- 13.1.3 India
- 13.1.4 Australia
- 13.1.5 Rest of Asia Pacific
- 14. South America Organic Tea Industry Analysis, Insights and Forecast, 2019-2031
- 14.1. Market Analysis, Insights and Forecast - By Country/Sub-region
- 14.1.1 Brazil
- 14.1.2 Argentina
- 14.1.3 Rest of South America
- 15. Middle East and Africa Organic Tea Industry Analysis, Insights and Forecast, 2019-2031
- 15.1. Market Analysis, Insights and Forecast - By Country/Sub-region
- 15.1.1 South Africa
- 15.1.2 Saudi Arabia
- 15.1.3 Rest of Middle East and Africa
- 16. Competitive Analysis
- 16.1. Global Market Share Analysis 2024
- 16.2. Company Profiles
- 16.2.1 Celestial Seasonings Inc.
- 16.2.1.1. Overview
- 16.2.1.2. Products
- 16.2.1.3. SWOT Analysis
- 16.2.1.4. Recent Developments
- 16.2.1.5. Financials (Based on Availability)
- 16.2.2 Harney & Sons Fine Teas
- 16.2.2.1. Overview
- 16.2.2.2. Products
- 16.2.2.3. SWOT Analysis
- 16.2.2.4. Recent Developments
- 16.2.2.5. Financials (Based on Availability)
- 16.2.3 Madura Tea Estates
- 16.2.3.1. Overview
- 16.2.3.2. Products
- 16.2.3.3. SWOT Analysis
- 16.2.3.4. Recent Developments
- 16.2.3.5. Financials (Based on Availability)
- 16.2.4 Unilever PLC
- 16.2.4.1. Overview
- 16.2.4.2. Products
- 16.2.4.3. SWOT Analysis
- 16.2.4.4. Recent Developments
- 16.2.4.5. Financials (Based on Availability)
- 16.2.5 Tata Global Beverages
- 16.2.5.1. Overview
- 16.2.5.2. Products
- 16.2.5.3. SWOT Analysis
- 16.2.5.4. Recent Developments
- 16.2.5.5. Financials (Based on Availability)
- 16.2.6 Equal Exchange Fairly Traded
- 16.2.6.1. Overview
- 16.2.6.2. Products
- 16.2.6.3. SWOT Analysis
- 16.2.6.4. Recent Developments
- 16.2.6.5. Financials (Based on Availability)
- 16.2.7 Numi Inc PBC
- 16.2.7.1. Overview
- 16.2.7.2. Products
- 16.2.7.3. SWOT Analysis
- 16.2.7.4. Recent Developments
- 16.2.7.5. Financials (Based on Availability)
- 16.2.8 Halssen & Lyon
- 16.2.8.1. Overview
- 16.2.8.2. Products
- 16.2.8.3. SWOT Analysis
- 16.2.8.4. Recent Developments
- 16.2.8.5. Financials (Based on Availability)
- 16.2.9 Shangri-la Tea
- 16.2.9.1. Overview
- 16.2.9.2. Products
- 16.2.9.3. SWOT Analysis
- 16.2.9.4. Recent Developments
- 16.2.9.5. Financials (Based on Availability)
- 16.2.10 Organic India
- 16.2.10.1. Overview
- 16.2.10.2. Products
- 16.2.10.3. SWOT Analysis
- 16.2.10.4. Recent Developments
- 16.2.10.5. Financials (Based on Availability)
- 16.2.1 Celestial Seasonings Inc.
List of Figures
- Figure 1: Global Organic Tea Industry Revenue Breakdown (Million, %) by Region 2024 & 2032
- Figure 2: Global Organic Tea Industry Volume Breakdown (K Tons, %) by Region 2024 & 2032
- Figure 3: North America Organic Tea Industry Revenue (Million), by Country 2024 & 2032
- Figure 4: North America Organic Tea Industry Volume (K Tons), by Country 2024 & 2032
- Figure 5: North America Organic Tea Industry Revenue Share (%), by Country 2024 & 2032
- Figure 6: North America Organic Tea Industry Volume Share (%), by Country 2024 & 2032
- Figure 7: Europe Organic Tea Industry Revenue (Million), by Country 2024 & 2032
- Figure 8: Europe Organic Tea Industry Volume (K Tons), by Country 2024 & 2032
- Figure 9: Europe Organic Tea Industry Revenue Share (%), by Country 2024 & 2032
- Figure 10: Europe Organic Tea Industry Volume Share (%), by Country 2024 & 2032
- Figure 11: Asia Pacific Organic Tea Industry Revenue (Million), by Country 2024 & 2032
- Figure 12: Asia Pacific Organic Tea Industry Volume (K Tons), by Country 2024 & 2032
- Figure 13: Asia Pacific Organic Tea Industry Revenue Share (%), by Country 2024 & 2032
- Figure 14: Asia Pacific Organic Tea Industry Volume Share (%), by Country 2024 & 2032
- Figure 15: South America Organic Tea Industry Revenue (Million), by Country 2024 & 2032
- Figure 16: South America Organic Tea Industry Volume (K Tons), by Country 2024 & 2032
- Figure 17: South America Organic Tea Industry Revenue Share (%), by Country 2024 & 2032
- Figure 18: South America Organic Tea Industry Volume Share (%), by Country 2024 & 2032
- Figure 19: Middle East and Africa Organic Tea Industry Revenue (Million), by Country 2024 & 2032
- Figure 20: Middle East and Africa Organic Tea Industry Volume (K Tons), by Country 2024 & 2032
- Figure 21: Middle East and Africa Organic Tea Industry Revenue Share (%), by Country 2024 & 2032
- Figure 22: Middle East and Africa Organic Tea Industry Volume Share (%), by Country 2024 & 2032
- Figure 23: North America Organic Tea Industry Revenue (Million), by Type 2024 & 2032
- Figure 24: North America Organic Tea Industry Volume (K Tons), by Type 2024 & 2032
- Figure 25: North America Organic Tea Industry Revenue Share (%), by Type 2024 & 2032
- Figure 26: North America Organic Tea Industry Volume Share (%), by Type 2024 & 2032
- Figure 27: North America Organic Tea Industry Revenue (Million), by Packaging Type 2024 & 2032
- Figure 28: North America Organic Tea Industry Volume (K Tons), by Packaging Type 2024 & 2032
- Figure 29: North America Organic Tea Industry Revenue Share (%), by Packaging Type 2024 & 2032
- Figure 30: North America Organic Tea Industry Volume Share (%), by Packaging Type 2024 & 2032
- Figure 31: North America Organic Tea Industry Revenue (Million), by Distribution Channel 2024 & 2032
- Figure 32: North America Organic Tea Industry Volume (K Tons), by Distribution Channel 2024 & 2032
- Figure 33: North America Organic Tea Industry Revenue Share (%), by Distribution Channel 2024 & 2032
- Figure 34: North America Organic Tea Industry Volume Share (%), by Distribution Channel 2024 & 2032
- Figure 35: North America Organic Tea Industry Revenue (Million), by Country 2024 & 2032
- Figure 36: North America Organic Tea Industry Volume (K Tons), by Country 2024 & 2032
- Figure 37: North America Organic Tea Industry Revenue Share (%), by Country 2024 & 2032
- Figure 38: North America Organic Tea Industry Volume Share (%), by Country 2024 & 2032
- Figure 39: Europe Organic Tea Industry Revenue (Million), by Type 2024 & 2032
- Figure 40: Europe Organic Tea Industry Volume (K Tons), by Type 2024 & 2032
- Figure 41: Europe Organic Tea Industry Revenue Share (%), by Type 2024 & 2032
- Figure 42: Europe Organic Tea Industry Volume Share (%), by Type 2024 & 2032
- Figure 43: Europe Organic Tea Industry Revenue (Million), by Packaging Type 2024 & 2032
- Figure 44: Europe Organic Tea Industry Volume (K Tons), by Packaging Type 2024 & 2032
- Figure 45: Europe Organic Tea Industry Revenue Share (%), by Packaging Type 2024 & 2032
- Figure 46: Europe Organic Tea Industry Volume Share (%), by Packaging Type 2024 & 2032
- Figure 47: Europe Organic Tea Industry Revenue (Million), by Distribution Channel 2024 & 2032
- Figure 48: Europe Organic Tea Industry Volume (K Tons), by Distribution Channel 2024 & 2032
- Figure 49: Europe Organic Tea Industry Revenue Share (%), by Distribution Channel 2024 & 2032
- Figure 50: Europe Organic Tea Industry Volume Share (%), by Distribution Channel 2024 & 2032
- Figure 51: Europe Organic Tea Industry Revenue (Million), by Country 2024 & 2032
- Figure 52: Europe Organic Tea Industry Volume (K Tons), by Country 2024 & 2032
- Figure 53: Europe Organic Tea Industry Revenue Share (%), by Country 2024 & 2032
- Figure 54: Europe Organic Tea Industry Volume Share (%), by Country 2024 & 2032
- Figure 55: Asia Pacific Organic Tea Industry Revenue (Million), by Type 2024 & 2032
- Figure 56: Asia Pacific Organic Tea Industry Volume (K Tons), by Type 2024 & 2032
- Figure 57: Asia Pacific Organic Tea Industry Revenue Share (%), by Type 2024 & 2032
- Figure 58: Asia Pacific Organic Tea Industry Volume Share (%), by Type 2024 & 2032
- Figure 59: Asia Pacific Organic Tea Industry Revenue (Million), by Packaging Type 2024 & 2032
- Figure 60: Asia Pacific Organic Tea Industry Volume (K Tons), by Packaging Type 2024 & 2032
- Figure 61: Asia Pacific Organic Tea Industry Revenue Share (%), by Packaging Type 2024 & 2032
- Figure 62: Asia Pacific Organic Tea Industry Volume Share (%), by Packaging Type 2024 & 2032
- Figure 63: Asia Pacific Organic Tea Industry Revenue (Million), by Distribution Channel 2024 & 2032
- Figure 64: Asia Pacific Organic Tea Industry Volume (K Tons), by Distribution Channel 2024 & 2032
- Figure 65: Asia Pacific Organic Tea Industry Revenue Share (%), by Distribution Channel 2024 & 2032
- Figure 66: Asia Pacific Organic Tea Industry Volume Share (%), by Distribution Channel 2024 & 2032
- Figure 67: Asia Pacific Organic Tea Industry Revenue (Million), by Country 2024 & 2032
- Figure 68: Asia Pacific Organic Tea Industry Volume (K Tons), by Country 2024 & 2032
- Figure 69: Asia Pacific Organic Tea Industry Revenue Share (%), by Country 2024 & 2032
- Figure 70: Asia Pacific Organic Tea Industry Volume Share (%), by Country 2024 & 2032
- Figure 71: South America Organic Tea Industry Revenue (Million), by Type 2024 & 2032
- Figure 72: South America Organic Tea Industry Volume (K Tons), by Type 2024 & 2032
- Figure 73: South America Organic Tea Industry Revenue Share (%), by Type 2024 & 2032
- Figure 74: South America Organic Tea Industry Volume Share (%), by Type 2024 & 2032
- Figure 75: South America Organic Tea Industry Revenue (Million), by Packaging Type 2024 & 2032
- Figure 76: South America Organic Tea Industry Volume (K Tons), by Packaging Type 2024 & 2032
- Figure 77: South America Organic Tea Industry Revenue Share (%), by Packaging Type 2024 & 2032
- Figure 78: South America Organic Tea Industry Volume Share (%), by Packaging Type 2024 & 2032
- Figure 79: South America Organic Tea Industry Revenue (Million), by Distribution Channel 2024 & 2032
- Figure 80: South America Organic Tea Industry Volume (K Tons), by Distribution Channel 2024 & 2032
- Figure 81: South America Organic Tea Industry Revenue Share (%), by Distribution Channel 2024 & 2032
- Figure 82: South America Organic Tea Industry Volume Share (%), by Distribution Channel 2024 & 2032
- Figure 83: South America Organic Tea Industry Revenue (Million), by Country 2024 & 2032
- Figure 84: South America Organic Tea Industry Volume (K Tons), by Country 2024 & 2032
- Figure 85: South America Organic Tea Industry Revenue Share (%), by Country 2024 & 2032
- Figure 86: South America Organic Tea Industry Volume Share (%), by Country 2024 & 2032
- Figure 87: Middle East and Africa Organic Tea Industry Revenue (Million), by Type 2024 & 2032
- Figure 88: Middle East and Africa Organic Tea Industry Volume (K Tons), by Type 2024 & 2032
- Figure 89: Middle East and Africa Organic Tea Industry Revenue Share (%), by Type 2024 & 2032
- Figure 90: Middle East and Africa Organic Tea Industry Volume Share (%), by Type 2024 & 2032
- Figure 91: Middle East and Africa Organic Tea Industry Revenue (Million), by Packaging Type 2024 & 2032
- Figure 92: Middle East and Africa Organic Tea Industry Volume (K Tons), by Packaging Type 2024 & 2032
- Figure 93: Middle East and Africa Organic Tea Industry Revenue Share (%), by Packaging Type 2024 & 2032
- Figure 94: Middle East and Africa Organic Tea Industry Volume Share (%), by Packaging Type 2024 & 2032
- Figure 95: Middle East and Africa Organic Tea Industry Revenue (Million), by Distribution Channel 2024 & 2032
- Figure 96: Middle East and Africa Organic Tea Industry Volume (K Tons), by Distribution Channel 2024 & 2032
- Figure 97: Middle East and Africa Organic Tea Industry Revenue Share (%), by Distribution Channel 2024 & 2032
- Figure 98: Middle East and Africa Organic Tea Industry Volume Share (%), by Distribution Channel 2024 & 2032
- Figure 99: Middle East and Africa Organic Tea Industry Revenue (Million), by Country 2024 & 2032
- Figure 100: Middle East and Africa Organic Tea Industry Volume (K Tons), by Country 2024 & 2032
- Figure 101: Middle East and Africa Organic Tea Industry Revenue Share (%), by Country 2024 & 2032
- Figure 102: Middle East and Africa Organic Tea Industry Volume Share (%), by Country 2024 & 2032
List of Tables
- Table 1: Global Organic Tea Industry Revenue Million Forecast, by Region 2019 & 2032
- Table 2: Global Organic Tea Industry Volume K Tons Forecast, by Region 2019 & 2032
- Table 3: Global Organic Tea Industry Revenue Million Forecast, by Type 2019 & 2032
- Table 4: Global Organic Tea Industry Volume K Tons Forecast, by Type 2019 & 2032
- Table 5: Global Organic Tea Industry Revenue Million Forecast, by Packaging Type 2019 & 2032
- Table 6: Global Organic Tea Industry Volume K Tons Forecast, by Packaging Type 2019 & 2032
- Table 7: Global Organic Tea Industry Revenue Million Forecast, by Distribution Channel 2019 & 2032
- Table 8: Global Organic Tea Industry Volume K Tons Forecast, by Distribution Channel 2019 & 2032
- Table 9: Global Organic Tea Industry Revenue Million Forecast, by Region 2019 & 2032
- Table 10: Global Organic Tea Industry Volume K Tons Forecast, by Region 2019 & 2032
- Table 11: Global Organic Tea Industry Revenue Million Forecast, by Country 2019 & 2032
- Table 12: Global Organic Tea Industry Volume K Tons Forecast, by Country 2019 & 2032
- Table 13: United States Organic Tea Industry Revenue (Million) Forecast, by Application 2019 & 2032
- Table 14: United States Organic Tea Industry Volume (K Tons) Forecast, by Application 2019 & 2032
- Table 15: Canada Organic Tea Industry Revenue (Million) Forecast, by Application 2019 & 2032
- Table 16: Canada Organic Tea Industry Volume (K Tons) Forecast, by Application 2019 & 2032
- Table 17: Mexico Organic Tea Industry Revenue (Million) Forecast, by Application 2019 & 2032
- Table 18: Mexico Organic Tea Industry Volume (K Tons) Forecast, by Application 2019 & 2032
- Table 19: Rest of North America Organic Tea Industry Revenue (Million) Forecast, by Application 2019 & 2032
- Table 20: Rest of North America Organic Tea Industry Volume (K Tons) Forecast, by Application 2019 & 2032
- Table 21: Global Organic Tea Industry Revenue Million Forecast, by Country 2019 & 2032
- Table 22: Global Organic Tea Industry Volume K Tons Forecast, by Country 2019 & 2032
- Table 23: United Kingdom Organic Tea Industry Revenue (Million) Forecast, by Application 2019 & 2032
- Table 24: United Kingdom Organic Tea Industry Volume (K Tons) Forecast, by Application 2019 & 2032
- Table 25: Spain Organic Tea Industry Revenue (Million) Forecast, by Application 2019 & 2032
- Table 26: Spain Organic Tea Industry Volume (K Tons) Forecast, by Application 2019 & 2032
- Table 27: Germany Organic Tea Industry Revenue (Million) Forecast, by Application 2019 & 2032
- Table 28: Germany Organic Tea Industry Volume (K Tons) Forecast, by Application 2019 & 2032
- Table 29: France Organic Tea Industry Revenue (Million) Forecast, by Application 2019 & 2032
- Table 30: France Organic Tea Industry Volume (K Tons) Forecast, by Application 2019 & 2032
- Table 31: Italy Organic Tea Industry Revenue (Million) Forecast, by Application 2019 & 2032
- Table 32: Italy Organic Tea Industry Volume (K Tons) Forecast, by Application 2019 & 2032
- Table 33: Russia Organic Tea Industry Revenue (Million) Forecast, by Application 2019 & 2032
- Table 34: Russia Organic Tea Industry Volume (K Tons) Forecast, by Application 2019 & 2032
- Table 35: Rest of Europe Organic Tea Industry Revenue (Million) Forecast, by Application 2019 & 2032
- Table 36: Rest of Europe Organic Tea Industry Volume (K Tons) Forecast, by Application 2019 & 2032
- Table 37: Global Organic Tea Industry Revenue Million Forecast, by Country 2019 & 2032
- Table 38: Global Organic Tea Industry Volume K Tons Forecast, by Country 2019 & 2032
- Table 39: China Organic Tea Industry Revenue (Million) Forecast, by Application 2019 & 2032
- Table 40: China Organic Tea Industry Volume (K Tons) Forecast, by Application 2019 & 2032
- Table 41: Japan Organic Tea Industry Revenue (Million) Forecast, by Application 2019 & 2032
- Table 42: Japan Organic Tea Industry Volume (K Tons) Forecast, by Application 2019 & 2032
- Table 43: India Organic Tea Industry Revenue (Million) Forecast, by Application 2019 & 2032
- Table 44: India Organic Tea Industry Volume (K Tons) Forecast, by Application 2019 & 2032
- Table 45: Australia Organic Tea Industry Revenue (Million) Forecast, by Application 2019 & 2032
- Table 46: Australia Organic Tea Industry Volume (K Tons) Forecast, by Application 2019 & 2032
- Table 47: Rest of Asia Pacific Organic Tea Industry Revenue (Million) Forecast, by Application 2019 & 2032
- Table 48: Rest of Asia Pacific Organic Tea Industry Volume (K Tons) Forecast, by Application 2019 & 2032
- Table 49: Global Organic Tea Industry Revenue Million Forecast, by Country 2019 & 2032
- Table 50: Global Organic Tea Industry Volume K Tons Forecast, by Country 2019 & 2032
- Table 51: Brazil Organic Tea Industry Revenue (Million) Forecast, by Application 2019 & 2032
- Table 52: Brazil Organic Tea Industry Volume (K Tons) Forecast, by Application 2019 & 2032
- Table 53: Argentina Organic Tea Industry Revenue (Million) Forecast, by Application 2019 & 2032
- Table 54: Argentina Organic Tea Industry Volume (K Tons) Forecast, by Application 2019 & 2032
- Table 55: Rest of South America Organic Tea Industry Revenue (Million) Forecast, by Application 2019 & 2032
- Table 56: Rest of South America Organic Tea Industry Volume (K Tons) Forecast, by Application 2019 & 2032
- Table 57: Global Organic Tea Industry Revenue Million Forecast, by Country 2019 & 2032
- Table 58: Global Organic Tea Industry Volume K Tons Forecast, by Country 2019 & 2032
- Table 59: South Africa Organic Tea Industry Revenue (Million) Forecast, by Application 2019 & 2032
- Table 60: South Africa Organic Tea Industry Volume (K Tons) Forecast, by Application 2019 & 2032
- Table 61: Saudi Arabia Organic Tea Industry Revenue (Million) Forecast, by Application 2019 & 2032
- Table 62: Saudi Arabia Organic Tea Industry Volume (K Tons) Forecast, by Application 2019 & 2032
- Table 63: Rest of Middle East and Africa Organic Tea Industry Revenue (Million) Forecast, by Application 2019 & 2032
- Table 64: Rest of Middle East and Africa Organic Tea Industry Volume (K Tons) Forecast, by Application 2019 & 2032
- Table 65: Global Organic Tea Industry Revenue Million Forecast, by Type 2019 & 2032
- Table 66: Global Organic Tea Industry Volume K Tons Forecast, by Type 2019 & 2032
- Table 67: Global Organic Tea Industry Revenue Million Forecast, by Packaging Type 2019 & 2032
- Table 68: Global Organic Tea Industry Volume K Tons Forecast, by Packaging Type 2019 & 2032
- Table 69: Global Organic Tea Industry Revenue Million Forecast, by Distribution Channel 2019 & 2032
- Table 70: Global Organic Tea Industry Volume K Tons Forecast, by Distribution Channel 2019 & 2032
- Table 71: Global Organic Tea Industry Revenue Million Forecast, by Country 2019 & 2032
- Table 72: Global Organic Tea Industry Volume K Tons Forecast, by Country 2019 & 2032
- Table 73: United States Organic Tea Industry Revenue (Million) Forecast, by Application 2019 & 2032
- Table 74: United States Organic Tea Industry Volume (K Tons) Forecast, by Application 2019 & 2032
- Table 75: Canada Organic Tea Industry Revenue (Million) Forecast, by Application 2019 & 2032
- Table 76: Canada Organic Tea Industry Volume (K Tons) Forecast, by Application 2019 & 2032
- Table 77: Mexico Organic Tea Industry Revenue (Million) Forecast, by Application 2019 & 2032
- Table 78: Mexico Organic Tea Industry Volume (K Tons) Forecast, by Application 2019 & 2032
- Table 79: Rest of North America Organic Tea Industry Revenue (Million) Forecast, by Application 2019 & 2032
- Table 80: Rest of North America Organic Tea Industry Volume (K Tons) Forecast, by Application 2019 & 2032
- Table 81: Global Organic Tea Industry Revenue Million Forecast, by Type 2019 & 2032
- Table 82: Global Organic Tea Industry Volume K Tons Forecast, by Type 2019 & 2032
- Table 83: Global Organic Tea Industry Revenue Million Forecast, by Packaging Type 2019 & 2032
- Table 84: Global Organic Tea Industry Volume K Tons Forecast, by Packaging Type 2019 & 2032
- Table 85: Global Organic Tea Industry Revenue Million Forecast, by Distribution Channel 2019 & 2032
- Table 86: Global Organic Tea Industry Volume K Tons Forecast, by Distribution Channel 2019 & 2032
- Table 87: Global Organic Tea Industry Revenue Million Forecast, by Country 2019 & 2032
- Table 88: Global Organic Tea Industry Volume K Tons Forecast, by Country 2019 & 2032
- Table 89: United Kingdom Organic Tea Industry Revenue (Million) Forecast, by Application 2019 & 2032
- Table 90: United Kingdom Organic Tea Industry Volume (K Tons) Forecast, by Application 2019 & 2032
- Table 91: Spain Organic Tea Industry Revenue (Million) Forecast, by Application 2019 & 2032
- Table 92: Spain Organic Tea Industry Volume (K Tons) Forecast, by Application 2019 & 2032
- Table 93: Germany Organic Tea Industry Revenue (Million) Forecast, by Application 2019 & 2032
- Table 94: Germany Organic Tea Industry Volume (K Tons) Forecast, by Application 2019 & 2032
- Table 95: France Organic Tea Industry Revenue (Million) Forecast, by Application 2019 & 2032
- Table 96: France Organic Tea Industry Volume (K Tons) Forecast, by Application 2019 & 2032
- Table 97: Italy Organic Tea Industry Revenue (Million) Forecast, by Application 2019 & 2032
- Table 98: Italy Organic Tea Industry Volume (K Tons) Forecast, by Application 2019 & 2032
- Table 99: Russia Organic Tea Industry Revenue (Million) Forecast, by Application 2019 & 2032
- Table 100: Russia Organic Tea Industry Volume (K Tons) Forecast, by Application 2019 & 2032
- Table 101: Rest of Europe Organic Tea Industry Revenue (Million) Forecast, by Application 2019 & 2032
- Table 102: Rest of Europe Organic Tea Industry Volume (K Tons) Forecast, by Application 2019 & 2032
- Table 103: Global Organic Tea Industry Revenue Million Forecast, by Type 2019 & 2032
- Table 104: Global Organic Tea Industry Volume K Tons Forecast, by Type 2019 & 2032
- Table 105: Global Organic Tea Industry Revenue Million Forecast, by Packaging Type 2019 & 2032
- Table 106: Global Organic Tea Industry Volume K Tons Forecast, by Packaging Type 2019 & 2032
- Table 107: Global Organic Tea Industry Revenue Million Forecast, by Distribution Channel 2019 & 2032
- Table 108: Global Organic Tea Industry Volume K Tons Forecast, by Distribution Channel 2019 & 2032
- Table 109: Global Organic Tea Industry Revenue Million Forecast, by Country 2019 & 2032
- Table 110: Global Organic Tea Industry Volume K Tons Forecast, by Country 2019 & 2032
- Table 111: China Organic Tea Industry Revenue (Million) Forecast, by Application 2019 & 2032
- Table 112: China Organic Tea Industry Volume (K Tons) Forecast, by Application 2019 & 2032
- Table 113: Japan Organic Tea Industry Revenue (Million) Forecast, by Application 2019 & 2032
- Table 114: Japan Organic Tea Industry Volume (K Tons) Forecast, by Application 2019 & 2032
- Table 115: India Organic Tea Industry Revenue (Million) Forecast, by Application 2019 & 2032
- Table 116: India Organic Tea Industry Volume (K Tons) Forecast, by Application 2019 & 2032
- Table 117: Australia Organic Tea Industry Revenue (Million) Forecast, by Application 2019 & 2032
- Table 118: Australia Organic Tea Industry Volume (K Tons) Forecast, by Application 2019 & 2032
- Table 119: Rest of Asia Pacific Organic Tea Industry Revenue (Million) Forecast, by Application 2019 & 2032
- Table 120: Rest of Asia Pacific Organic Tea Industry Volume (K Tons) Forecast, by Application 2019 & 2032
- Table 121: Global Organic Tea Industry Revenue Million Forecast, by Type 2019 & 2032
- Table 122: Global Organic Tea Industry Volume K Tons Forecast, by Type 2019 & 2032
- Table 123: Global Organic Tea Industry Revenue Million Forecast, by Packaging Type 2019 & 2032
- Table 124: Global Organic Tea Industry Volume K Tons Forecast, by Packaging Type 2019 & 2032
- Table 125: Global Organic Tea Industry Revenue Million Forecast, by Distribution Channel 2019 & 2032
- Table 126: Global Organic Tea Industry Volume K Tons Forecast, by Distribution Channel 2019 & 2032
- Table 127: Global Organic Tea Industry Revenue Million Forecast, by Country 2019 & 2032
- Table 128: Global Organic Tea Industry Volume K Tons Forecast, by Country 2019 & 2032
- Table 129: Brazil Organic Tea Industry Revenue (Million) Forecast, by Application 2019 & 2032
- Table 130: Brazil Organic Tea Industry Volume (K Tons) Forecast, by Application 2019 & 2032
- Table 131: Argentina Organic Tea Industry Revenue (Million) Forecast, by Application 2019 & 2032
- Table 132: Argentina Organic Tea Industry Volume (K Tons) Forecast, by Application 2019 & 2032
- Table 133: Rest of South America Organic Tea Industry Revenue (Million) Forecast, by Application 2019 & 2032
- Table 134: Rest of South America Organic Tea Industry Volume (K Tons) Forecast, by Application 2019 & 2032
- Table 135: Global Organic Tea Industry Revenue Million Forecast, by Type 2019 & 2032
- Table 136: Global Organic Tea Industry Volume K Tons Forecast, by Type 2019 & 2032
- Table 137: Global Organic Tea Industry Revenue Million Forecast, by Packaging Type 2019 & 2032
- Table 138: Global Organic Tea Industry Volume K Tons Forecast, by Packaging Type 2019 & 2032
- Table 139: Global Organic Tea Industry Revenue Million Forecast, by Distribution Channel 2019 & 2032
- Table 140: Global Organic Tea Industry Volume K Tons Forecast, by Distribution Channel 2019 & 2032
- Table 141: Global Organic Tea Industry Revenue Million Forecast, by Country 2019 & 2032
- Table 142: Global Organic Tea Industry Volume K Tons Forecast, by Country 2019 & 2032
- Table 143: South Africa Organic Tea Industry Revenue (Million) Forecast, by Application 2019 & 2032
- Table 144: South Africa Organic Tea Industry Volume (K Tons) Forecast, by Application 2019 & 2032
- Table 145: Saudi Arabia Organic Tea Industry Revenue (Million) Forecast, by Application 2019 & 2032
- Table 146: Saudi Arabia Organic Tea Industry Volume (K Tons) Forecast, by Application 2019 & 2032
- Table 147: Rest of Middle East and Africa Organic Tea Industry Revenue (Million) Forecast, by Application 2019 & 2032
- Table 148: Rest of Middle East and Africa Organic Tea Industry Volume (K Tons) Forecast, by Application 2019 & 2032
Frequently Asked Questions
1. What is the projected Compound Annual Growth Rate (CAGR) of the Organic Tea Industry?
The projected CAGR is approximately 5.75%.
2. Which companies are prominent players in the Organic Tea Industry?
Key companies in the market include Celestial Seasonings Inc., Harney & Sons Fine Teas, Madura Tea Estates, Unilever PLC, Tata Global Beverages, Equal Exchange Fairly Traded, Numi Inc PBC, Halssen & Lyon, Shangri-la Tea, Organic India.
3. What are the main segments of the Organic Tea Industry?
The market segments include Type, Packaging Type, Distribution Channel.
4. Can you provide details about the market size?
The market size is estimated to be USD XX Million as of 2022.
5. What are some drivers contributing to market growth?
Increasing Demand for Herbal Teas; Increasing Consumer Awareness about Health Benefits of Tea.
6. What are the notable trends driving market growth?
Consumer Inclination Towards Healthy Beverages.
7. Are there any restraints impacting market growth?
High Cost of Production of Green Tea.
8. Can you provide examples of recent developments in the market?
March 2023: Eat the Change, a snack company, launched an extension of its ready-to-drink organic iced tea line, Just Ice Tea, in three new varieties: Mango White Tea, Original Black Tea, and Lemon Ginger Herbal Tea.
9. What pricing options are available for accessing the report?
Pricing options include single-user, multi-user, and enterprise licenses priced at USD 4750, USD 5250, and USD 8750 respectively.
10. Is the market size provided in terms of value or volume?
The market size is provided in terms of value, measured in Million and volume, measured in K Tons.
11. Are there any specific market keywords associated with the report?
Yes, the market keyword associated with the report is "Organic Tea Industry," which aids in identifying and referencing the specific market segment covered.
12. How do I determine which pricing option suits my needs best?
The pricing options vary based on user requirements and access needs. Individual users may opt for single-user licenses, while businesses requiring broader access may choose multi-user or enterprise licenses for cost-effective access to the report.
13. Are there any additional resources or data provided in the Organic Tea Industry report?
While the report offers comprehensive insights, it's advisable to review the specific contents or supplementary materials provided to ascertain if additional resources or data are available.
14. How can I stay updated on further developments or reports in the Organic Tea Industry?
To stay informed about further developments, trends, and reports in the Organic Tea Industry, consider subscribing to industry newsletters, following relevant companies and organizations, or regularly checking reputable industry news sources and publications.
Methodology
Step 1 - Identification of Relevant Samples Size from Population Database


Step 2 - Approaches for Defining Global Market Size (Value, Volume* & Price*)

Note*: In applicable scenarios
Step 3 - Data Sources
Primary Research
- Web Analytics
- Survey Reports
- Research Institute
- Latest Research Reports
- Opinion Leaders
Secondary Research
- Annual Reports
- White Paper
- Latest Press Release
- Industry Association
- Paid Database
- Investor Presentations

Step 4 - Data Triangulation
Involves using different sources of information in order to increase the validity of a study
These sources are likely to be stakeholders in a program - participants, other researchers, program staff, other community members, and so on.
Then we put all data in single framework & apply various statistical tools to find out the dynamic on the market.
During the analysis stage, feedback from the stakeholder groups would be compared to determine areas of agreement as well as areas of divergence
