

Key Insights
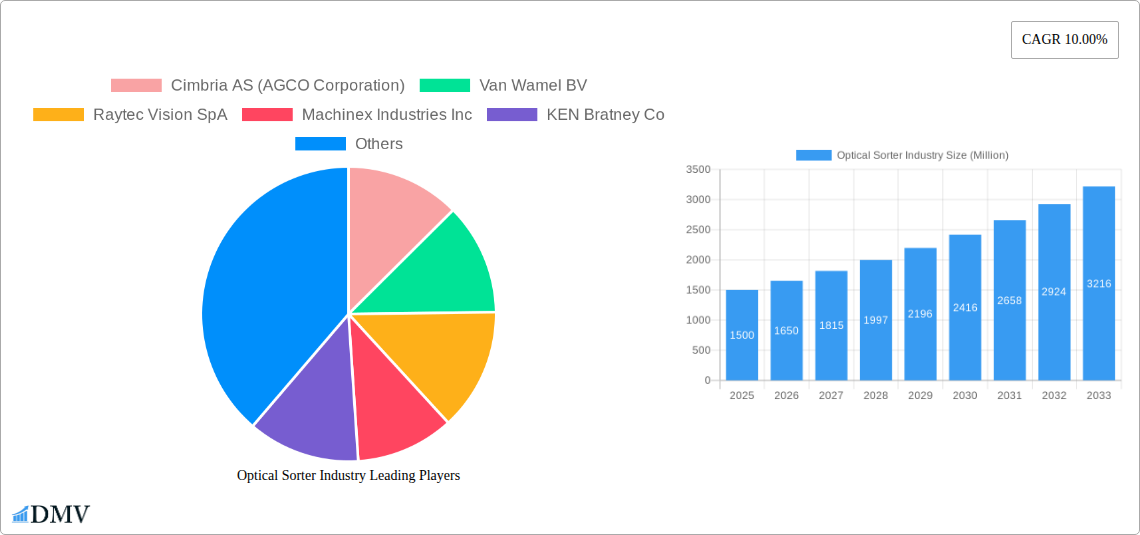
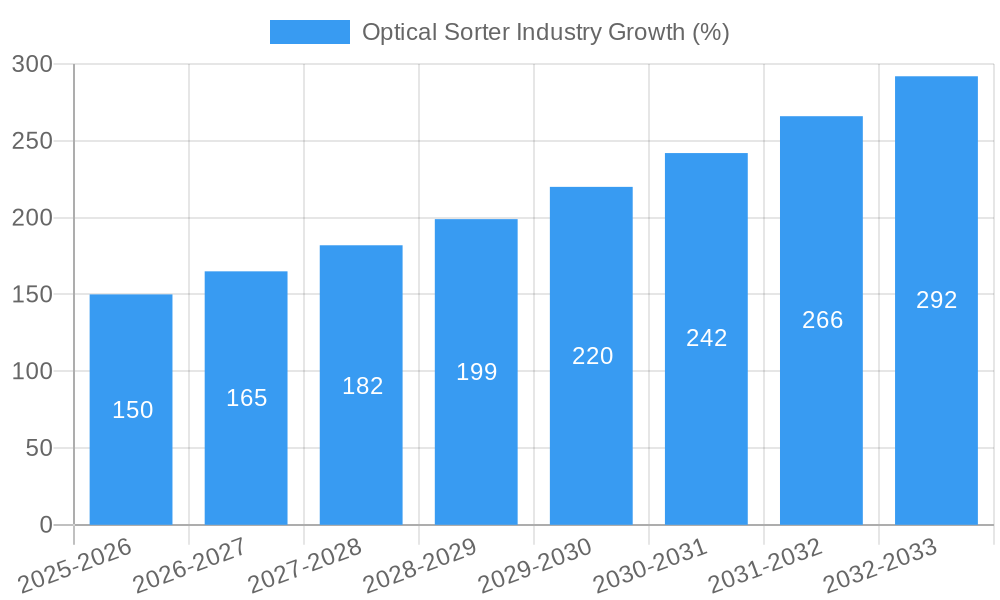
The optical sorter market is experiencing robust growth, driven by increasing demand for efficient and precise material sorting across diverse industries. The market's Compound Annual Growth Rate (CAGR) of 10% from 2019-2033 indicates a significant expansion, projected from an estimated market size of $1.5 billion in 2025 to over $4 billion by 2033. This growth is fueled by several key factors. Firstly, the food and beverage industry's stringent quality control standards and the need for efficient foreign material removal are driving significant adoption. Secondly, the recycling sector's focus on maximizing resource recovery and improving material purity is boosting demand for advanced optical sorters capable of handling diverse waste streams. Mining and other industrial sectors are also contributing to market expansion as they seek to optimize material processing and enhance product quality. Technological advancements, such as improved sensor technology and AI-powered sorting algorithms, are further enhancing the capabilities of optical sorters, leading to higher accuracy and throughput. While high initial investment costs can act as a restraint for some businesses, the long-term return on investment driven by increased efficiency and reduced waste is proving compelling. Market segmentation shows a relatively even split between hardware and software components, reflecting the integrated nature of the technology. Geographic distribution suggests strong growth across North America and Europe, but the Asia-Pacific region presents significant untapped potential due to rapid industrialization and growing environmental awareness.
The competitive landscape is characterized by a mix of established players and emerging innovative companies. Key players such as TOMRA Systems ASA, Key Technology Inc, and Bhler Holding AG are leveraging their extensive experience and technological expertise to maintain market leadership. However, smaller companies are also gaining traction, offering specialized solutions or focusing on niche applications. Future growth will likely be driven by continuous technological improvements, including the integration of hyperspectral imaging and machine learning to enhance sorting capabilities. The market will also see a growing emphasis on sustainable design and environmentally friendly materials used in the sorters themselves, aligning with the global push for environmental responsibility. Expanding into developing economies and further penetration into existing markets are critical strategies for companies looking to capitalize on the long-term growth potential of this dynamic sector.
Optical Sorter Industry Market Report: 2019-2033
This comprehensive report provides an in-depth analysis of the Optical Sorter Industry, offering valuable insights for stakeholders seeking to understand market dynamics, future trends, and investment opportunities. The study period covers 2019-2033, with 2025 as the base and estimated year. The report projects a market valued at xx Million in 2025, with a forecast period spanning 2025-2033. This detailed analysis covers key players, technological advancements, and regional variations within this rapidly evolving sector.
Optical Sorter Industry Market Composition & Trends
The Optical Sorter market, valued at xx Million in 2025, exhibits a moderately concentrated landscape with several major players vying for market share. While precise market share distribution for each company requires further analysis, key players like TOMRA Systems ASA, Key Technology Inc. (Duravant LLC), and Satake Corporation hold significant positions. Innovation is driven by advancements in sensor technology, AI-powered image processing, and the increasing demand for high-throughput sorting solutions. The regulatory landscape varies significantly across regions, influencing both adoption rates and product specifications. Substitute products, primarily manual sorting methods, are largely being replaced due to increased efficiency and accuracy demands. End-user profiles are diverse, encompassing food processing, recycling, and mining industries, each with unique sorting requirements. M&A activities have been relatively modest in recent years, with deal values generally below xx Million, reflecting a preference for organic growth and strategic partnerships.
- Market Concentration: Moderately concentrated, dominated by a handful of global players.
- Innovation Catalysts: Advancements in sensor technology, AI, and high-throughput demands.
- Regulatory Landscape: Varies significantly across regions, impacting adoption and product specs.
- Substitute Products: Manual sorting, gradually being replaced by automated optical sorters.
- M&A Activity: Relatively low volume, with deal values generally below xx Million.
Optical Sorter Industry Industry Evolution
The Optical Sorter industry has witnessed substantial growth over the historical period (2019-2024), driven by increasing demand across diverse end-user sectors. The food industry, particularly in processed fruits, vegetables, and nuts, has been a significant driver, with adoption rates growing at an estimated annual rate of xx% during the historical period. Technological advancements, such as the integration of hyperspectral imaging and improved software algorithms, have boosted sorting accuracy and efficiency. Simultaneously, shifting consumer demands for higher quality and consistent products further fuel market expansion. The forecast period (2025-2033) anticipates continued growth, driven by factors like automation in the recycling and mining sectors, coupled with technological innovations that enable the sorting of increasingly complex materials. Increased demand for traceability and quality control across multiple industries will further contribute to the market's expansion. The market is expected to see a Compound Annual Growth Rate (CAGR) of xx% during the forecast period, reaching a value of xx Million by 2033.
Leading Regions, Countries, or Segments in Optical Sorter Industry
The Optical Sorter industry demonstrates robust growth across several regions and segments. While precise data is needed for conclusive rankings, North America and Europe currently lead in market share, primarily driven by established food processing and recycling sectors. Within the "By Type" segment, hardware constitutes the largest portion, reflecting the core technology of optical sorting systems. The "By End-user Industries" segment shows strong growth across Food, Recycling, and Mining sectors.
- Key Drivers – North America & Europe:
- High adoption rates in food processing and recycling industries.
- Stringent quality control regulations.
- Significant investments in automation technologies.
- Key Drivers – Food Segment:
- Rising demand for high-quality, processed food products.
- Increased focus on food safety and traceability.
- Growth of the processed food industry globally.
- Key Drivers – Recycling Segment:
- Growing awareness of environmental sustainability.
- Increasing regulations on waste management.
- Need for efficient and cost-effective material recovery.
Optical Sorter Industry Product Innovations
Recent innovations in optical sorters emphasize improved accuracy, speed, and versatility. The integration of advanced sensors, including hyperspectral imaging and multispectral cameras, enhances the detection of subtle defects and foreign materials. Software advancements, such as AI-powered algorithms, enable real-time adaptation and optimization of sorting parameters. These improvements deliver enhanced performance metrics, including higher throughput, reduced waste, and improved product quality. Key selling propositions include increased efficiency, reduced labor costs, and improved product consistency, resulting in higher profitability for end-users.
Propelling Factors for Optical Sorter Industry Growth
Several factors propel the growth of the Optical Sorter industry. Technological advancements, such as the development of more sensitive and faster sensors, are key drivers. Economic factors, including the rising cost of labor and the increasing demand for high-quality products, encourage automation and the adoption of optical sorters. Stricter regulations regarding food safety and waste management in various regions also contribute to increased demand. For example, stricter regulations regarding food contamination are driving adoption in food processing.
Obstacles in the Optical Sorter Industry Market
The Optical Sorter industry faces challenges, including regulatory hurdles in certain regions, which create barriers to entry and affect product specifications. Supply chain disruptions and fluctuating raw material prices impact production costs and profitability. Intense competition among established players and new entrants creates pricing pressures. These factors may cause some degree of market slowdown, though innovation and expansion into new markets are likely to offset these challenges.
Future Opportunities in Optical Sorter Industry
Significant opportunities exist in expanding into new markets, particularly in developing economies with growing food processing and recycling sectors. The development of more versatile and adaptable sorters capable of handling a wider range of materials presents further growth potential. Emerging technologies, such as the integration of robotics and automation systems, offer scope for further improvements in efficiency and accuracy.
Major Players in the Optical Sorter Industry Ecosystem
- Cimbria AS (AGCO Corporation)
- Van Wamel BV
- Raytec Vision SpA
- Machinex Industries Inc
- KEN Bratney Co
- TOMRA Systems ASA
- Eagle Vizion Inc
- Satake Corporation
- Key Technology Inc ( Duravant LLC)
- Bhler Holding AG
- National Recovery Technologies LLC
- Hefei Meyer Optoelectronic Technology Inc
- MSS Inc (CP Manufacturing Inc )
- Sesotec GmbH
Key Developments in Optical Sorter Industry Industry
- November 2022: Key Technology Inc. launched its Herbert OCULUS whole potato optical sorter, showcasing its high-performance solutions for fresh and processed potatoes and vegetables. This launch enhances their market position and provides advanced sorting capabilities to food processors.
- June 2022: Inaba peanuts co ltd implemented the TOMRA 5B sorter, boosting production volume and consistency for various snacks. This highlights the effectiveness of TOMRA's solutions in the food industry.
Strategic Optical Sorter Industry Market Forecast
The Optical Sorter market is poised for continued growth, driven by technological innovation, increasing demand across diverse sectors, and supportive regulatory environments. The expansion into new markets, particularly in developing economies, and the development of more sophisticated and versatile sorting systems will contribute significantly to future market potential. The forecast indicates a robust growth trajectory, creating attractive investment opportunities within this dynamic industry.
Optical Sorter Industry Segmentation
-
1. Technology
- 1.1. X-ray Transmission
- 1.2. Camera Solutions
- 1.3. NIR-Sensors
- 1.4. Other Technologies (Hyperspectral, Laser, etc.)
-
2. End-user Industries
- 2.1. Food Processing
- 2.2. Recycling
- 2.3. Mining
- 2.4. Other End-user Industries
Optical Sorter Industry Segmentation By Geography
- 1. North America
- 2. Europe
- 3. Asia
- 4. Australia and New Zealand
- 5. Latin America
- 6. Middle East and Africa

Optical Sorter Industry REPORT HIGHLIGHTS
| Aspects | Details |
|---|---|
| Study Period | 2019-2033 |
| Base Year | 2024 |
| Estimated Year | 2025 |
| Forecast Period | 2025-2033 |
| Historical Period | 2019-2024 |
| Growth Rate | CAGR of 10.00% from 2019-2033 |
| Segmentation |
|
Table of Contents
- 1. Introduction
- 1.1. Research Scope
- 1.2. Market Segmentation
- 1.3. Research Methodology
- 1.4. Definitions and Assumptions
- 2. Executive Summary
- 2.1. Introduction
- 3. Market Dynamics
- 3.1. Introduction
- 3.2. Market Drivers
- 3.2.1. Increasing Demand for Reducing the Delivery and Processing Time; Stringent Regulations Regarding the Food Quality and Labor Costs
- 3.3. Market Restrains
- 3.3.1. High Deployment and Maintenance Costs; Real-time Technical Challenges and the Need for Skilled Workforce
- 3.4. Market Trends
- 3.4.1. Food Industry is Expected to Gain Demand Momentum Owing to Evolving Regulations
- 4. Market Factor Analysis
- 4.1. Porters Five Forces
- 4.2. Supply/Value Chain
- 4.3. PESTEL analysis
- 4.4. Market Entropy
- 4.5. Patent/Trademark Analysis
- 5. Global Optical Sorter Industry Analysis, Insights and Forecast, 2019-2031
- 5.1. Market Analysis, Insights and Forecast - by Technology
- 5.1.1. X-ray Transmission
- 5.1.2. Camera Solutions
- 5.1.3. NIR-Sensors
- 5.1.4. Other Technologies (Hyperspectral, Laser, etc.)
- 5.2. Market Analysis, Insights and Forecast - by End-user Industries
- 5.2.1. Food Processing
- 5.2.2. Recycling
- 5.2.3. Mining
- 5.2.4. Other End-user Industries
- 5.3. Market Analysis, Insights and Forecast - by Region
- 5.3.1. North America
- 5.3.2. Europe
- 5.3.3. Asia
- 5.3.4. Australia and New Zealand
- 5.3.5. Latin America
- 5.3.6. Middle East and Africa
- 5.1. Market Analysis, Insights and Forecast - by Technology
- 6. North America Optical Sorter Industry Analysis, Insights and Forecast, 2019-2031
- 6.1. Market Analysis, Insights and Forecast - by Technology
- 6.1.1. X-ray Transmission
- 6.1.2. Camera Solutions
- 6.1.3. NIR-Sensors
- 6.1.4. Other Technologies (Hyperspectral, Laser, etc.)
- 6.2. Market Analysis, Insights and Forecast - by End-user Industries
- 6.2.1. Food Processing
- 6.2.2. Recycling
- 6.2.3. Mining
- 6.2.4. Other End-user Industries
- 6.1. Market Analysis, Insights and Forecast - by Technology
- 7. Europe Optical Sorter Industry Analysis, Insights and Forecast, 2019-2031
- 7.1. Market Analysis, Insights and Forecast - by Technology
- 7.1.1. X-ray Transmission
- 7.1.2. Camera Solutions
- 7.1.3. NIR-Sensors
- 7.1.4. Other Technologies (Hyperspectral, Laser, etc.)
- 7.2. Market Analysis, Insights and Forecast - by End-user Industries
- 7.2.1. Food Processing
- 7.2.2. Recycling
- 7.2.3. Mining
- 7.2.4. Other End-user Industries
- 7.1. Market Analysis, Insights and Forecast - by Technology
- 8. Asia Optical Sorter Industry Analysis, Insights and Forecast, 2019-2031
- 8.1. Market Analysis, Insights and Forecast - by Technology
- 8.1.1. X-ray Transmission
- 8.1.2. Camera Solutions
- 8.1.3. NIR-Sensors
- 8.1.4. Other Technologies (Hyperspectral, Laser, etc.)
- 8.2. Market Analysis, Insights and Forecast - by End-user Industries
- 8.2.1. Food Processing
- 8.2.2. Recycling
- 8.2.3. Mining
- 8.2.4. Other End-user Industries
- 8.1. Market Analysis, Insights and Forecast - by Technology
- 9. Australia and New Zealand Optical Sorter Industry Analysis, Insights and Forecast, 2019-2031
- 9.1. Market Analysis, Insights and Forecast - by Technology
- 9.1.1. X-ray Transmission
- 9.1.2. Camera Solutions
- 9.1.3. NIR-Sensors
- 9.1.4. Other Technologies (Hyperspectral, Laser, etc.)
- 9.2. Market Analysis, Insights and Forecast - by End-user Industries
- 9.2.1. Food Processing
- 9.2.2. Recycling
- 9.2.3. Mining
- 9.2.4. Other End-user Industries
- 9.1. Market Analysis, Insights and Forecast - by Technology
- 10. Latin America Optical Sorter Industry Analysis, Insights and Forecast, 2019-2031
- 10.1. Market Analysis, Insights and Forecast - by Technology
- 10.1.1. X-ray Transmission
- 10.1.2. Camera Solutions
- 10.1.3. NIR-Sensors
- 10.1.4. Other Technologies (Hyperspectral, Laser, etc.)
- 10.2. Market Analysis, Insights and Forecast - by End-user Industries
- 10.2.1. Food Processing
- 10.2.2. Recycling
- 10.2.3. Mining
- 10.2.4. Other End-user Industries
- 10.1. Market Analysis, Insights and Forecast - by Technology
- 11. Middle East and Africa Optical Sorter Industry Analysis, Insights and Forecast, 2019-2031
- 11.1. Market Analysis, Insights and Forecast - by Technology
- 11.1.1. X-ray Transmission
- 11.1.2. Camera Solutions
- 11.1.3. NIR-Sensors
- 11.1.4. Other Technologies (Hyperspectral, Laser, etc.)
- 11.2. Market Analysis, Insights and Forecast - by End-user Industries
- 11.2.1. Food Processing
- 11.2.2. Recycling
- 11.2.3. Mining
- 11.2.4. Other End-user Industries
- 11.1. Market Analysis, Insights and Forecast - by Technology
- 12. North America Optical Sorter Industry Analysis, Insights and Forecast, 2019-2031
- 12.1. Market Analysis, Insights and Forecast - By Country/Sub-region
- 12.1.1.
- 13. Europe Optical Sorter Industry Analysis, Insights and Forecast, 2019-2031
- 13.1. Market Analysis, Insights and Forecast - By Country/Sub-region
- 13.1.1.
- 14. Asia Pacific Optical Sorter Industry Analysis, Insights and Forecast, 2019-2031
- 14.1. Market Analysis, Insights and Forecast - By Country/Sub-region
- 14.1.1.
- 15. Rest of the World Optical Sorter Industry Analysis, Insights and Forecast, 2019-2031
- 15.1. Market Analysis, Insights and Forecast - By Country/Sub-region
- 15.1.1.
- 16. Competitive Analysis
- 16.1. Global Market Share Analysis 2024
- 16.2. Company Profiles
- 16.2.1 Cimbria AS (AGCO Corporation)
- 16.2.1.1. Overview
- 16.2.1.2. Products
- 16.2.1.3. SWOT Analysis
- 16.2.1.4. Recent Developments
- 16.2.1.5. Financials (Based on Availability)
- 16.2.2 Van Wamel BV
- 16.2.2.1. Overview
- 16.2.2.2. Products
- 16.2.2.3. SWOT Analysis
- 16.2.2.4. Recent Developments
- 16.2.2.5. Financials (Based on Availability)
- 16.2.3 Raytec Vision SpA
- 16.2.3.1. Overview
- 16.2.3.2. Products
- 16.2.3.3. SWOT Analysis
- 16.2.3.4. Recent Developments
- 16.2.3.5. Financials (Based on Availability)
- 16.2.4 Machinex Industries Inc
- 16.2.4.1. Overview
- 16.2.4.2. Products
- 16.2.4.3. SWOT Analysis
- 16.2.4.4. Recent Developments
- 16.2.4.5. Financials (Based on Availability)
- 16.2.5 KEN Bratney Co
- 16.2.5.1. Overview
- 16.2.5.2. Products
- 16.2.5.3. SWOT Analysis
- 16.2.5.4. Recent Developments
- 16.2.5.5. Financials (Based on Availability)
- 16.2.6 TOMRA Systems ASA
- 16.2.6.1. Overview
- 16.2.6.2. Products
- 16.2.6.3. SWOT Analysis
- 16.2.6.4. Recent Developments
- 16.2.6.5. Financials (Based on Availability)
- 16.2.7 Eagle Vizion Inc
- 16.2.7.1. Overview
- 16.2.7.2. Products
- 16.2.7.3. SWOT Analysis
- 16.2.7.4. Recent Developments
- 16.2.7.5. Financials (Based on Availability)
- 16.2.8 Satake Corporation
- 16.2.8.1. Overview
- 16.2.8.2. Products
- 16.2.8.3. SWOT Analysis
- 16.2.8.4. Recent Developments
- 16.2.8.5. Financials (Based on Availability)
- 16.2.9 Key Technology Inc ( Duravant LLC)
- 16.2.9.1. Overview
- 16.2.9.2. Products
- 16.2.9.3. SWOT Analysis
- 16.2.9.4. Recent Developments
- 16.2.9.5. Financials (Based on Availability)
- 16.2.10 Bhler Holding AG
- 16.2.10.1. Overview
- 16.2.10.2. Products
- 16.2.10.3. SWOT Analysis
- 16.2.10.4. Recent Developments
- 16.2.10.5. Financials (Based on Availability)
- 16.2.11 National Recovery Technologies LLC
- 16.2.11.1. Overview
- 16.2.11.2. Products
- 16.2.11.3. SWOT Analysis
- 16.2.11.4. Recent Developments
- 16.2.11.5. Financials (Based on Availability)
- 16.2.12 Hefei Meyer Optoelectronic Technology Inc
- 16.2.12.1. Overview
- 16.2.12.2. Products
- 16.2.12.3. SWOT Analysis
- 16.2.12.4. Recent Developments
- 16.2.12.5. Financials (Based on Availability)
- 16.2.13 MSS Inc (CP Manufacturing Inc )
- 16.2.13.1. Overview
- 16.2.13.2. Products
- 16.2.13.3. SWOT Analysis
- 16.2.13.4. Recent Developments
- 16.2.13.5. Financials (Based on Availability)
- 16.2.14 Sesotec GmbH*List Not Exhaustive
- 16.2.14.1. Overview
- 16.2.14.2. Products
- 16.2.14.3. SWOT Analysis
- 16.2.14.4. Recent Developments
- 16.2.14.5. Financials (Based on Availability)
- 16.2.1 Cimbria AS (AGCO Corporation)
List of Figures
- Figure 1: Global Optical Sorter Industry Revenue Breakdown (Million, %) by Region 2024 & 2032
- Figure 2: North America Optical Sorter Industry Revenue (Million), by Country 2024 & 2032
- Figure 3: North America Optical Sorter Industry Revenue Share (%), by Country 2024 & 2032
- Figure 4: Europe Optical Sorter Industry Revenue (Million), by Country 2024 & 2032
- Figure 5: Europe Optical Sorter Industry Revenue Share (%), by Country 2024 & 2032
- Figure 6: Asia Pacific Optical Sorter Industry Revenue (Million), by Country 2024 & 2032
- Figure 7: Asia Pacific Optical Sorter Industry Revenue Share (%), by Country 2024 & 2032
- Figure 8: Rest of the World Optical Sorter Industry Revenue (Million), by Country 2024 & 2032
- Figure 9: Rest of the World Optical Sorter Industry Revenue Share (%), by Country 2024 & 2032
- Figure 10: North America Optical Sorter Industry Revenue (Million), by Technology 2024 & 2032
- Figure 11: North America Optical Sorter Industry Revenue Share (%), by Technology 2024 & 2032
- Figure 12: North America Optical Sorter Industry Revenue (Million), by End-user Industries 2024 & 2032
- Figure 13: North America Optical Sorter Industry Revenue Share (%), by End-user Industries 2024 & 2032
- Figure 14: North America Optical Sorter Industry Revenue (Million), by Country 2024 & 2032
- Figure 15: North America Optical Sorter Industry Revenue Share (%), by Country 2024 & 2032
- Figure 16: Europe Optical Sorter Industry Revenue (Million), by Technology 2024 & 2032
- Figure 17: Europe Optical Sorter Industry Revenue Share (%), by Technology 2024 & 2032
- Figure 18: Europe Optical Sorter Industry Revenue (Million), by End-user Industries 2024 & 2032
- Figure 19: Europe Optical Sorter Industry Revenue Share (%), by End-user Industries 2024 & 2032
- Figure 20: Europe Optical Sorter Industry Revenue (Million), by Country 2024 & 2032
- Figure 21: Europe Optical Sorter Industry Revenue Share (%), by Country 2024 & 2032
- Figure 22: Asia Optical Sorter Industry Revenue (Million), by Technology 2024 & 2032
- Figure 23: Asia Optical Sorter Industry Revenue Share (%), by Technology 2024 & 2032
- Figure 24: Asia Optical Sorter Industry Revenue (Million), by End-user Industries 2024 & 2032
- Figure 25: Asia Optical Sorter Industry Revenue Share (%), by End-user Industries 2024 & 2032
- Figure 26: Asia Optical Sorter Industry Revenue (Million), by Country 2024 & 2032
- Figure 27: Asia Optical Sorter Industry Revenue Share (%), by Country 2024 & 2032
- Figure 28: Australia and New Zealand Optical Sorter Industry Revenue (Million), by Technology 2024 & 2032
- Figure 29: Australia and New Zealand Optical Sorter Industry Revenue Share (%), by Technology 2024 & 2032
- Figure 30: Australia and New Zealand Optical Sorter Industry Revenue (Million), by End-user Industries 2024 & 2032
- Figure 31: Australia and New Zealand Optical Sorter Industry Revenue Share (%), by End-user Industries 2024 & 2032
- Figure 32: Australia and New Zealand Optical Sorter Industry Revenue (Million), by Country 2024 & 2032
- Figure 33: Australia and New Zealand Optical Sorter Industry Revenue Share (%), by Country 2024 & 2032
- Figure 34: Latin America Optical Sorter Industry Revenue (Million), by Technology 2024 & 2032
- Figure 35: Latin America Optical Sorter Industry Revenue Share (%), by Technology 2024 & 2032
- Figure 36: Latin America Optical Sorter Industry Revenue (Million), by End-user Industries 2024 & 2032
- Figure 37: Latin America Optical Sorter Industry Revenue Share (%), by End-user Industries 2024 & 2032
- Figure 38: Latin America Optical Sorter Industry Revenue (Million), by Country 2024 & 2032
- Figure 39: Latin America Optical Sorter Industry Revenue Share (%), by Country 2024 & 2032
- Figure 40: Middle East and Africa Optical Sorter Industry Revenue (Million), by Technology 2024 & 2032
- Figure 41: Middle East and Africa Optical Sorter Industry Revenue Share (%), by Technology 2024 & 2032
- Figure 42: Middle East and Africa Optical Sorter Industry Revenue (Million), by End-user Industries 2024 & 2032
- Figure 43: Middle East and Africa Optical Sorter Industry Revenue Share (%), by End-user Industries 2024 & 2032
- Figure 44: Middle East and Africa Optical Sorter Industry Revenue (Million), by Country 2024 & 2032
- Figure 45: Middle East and Africa Optical Sorter Industry Revenue Share (%), by Country 2024 & 2032
List of Tables
- Table 1: Global Optical Sorter Industry Revenue Million Forecast, by Region 2019 & 2032
- Table 2: Global Optical Sorter Industry Revenue Million Forecast, by Technology 2019 & 2032
- Table 3: Global Optical Sorter Industry Revenue Million Forecast, by End-user Industries 2019 & 2032
- Table 4: Global Optical Sorter Industry Revenue Million Forecast, by Region 2019 & 2032
- Table 5: Global Optical Sorter Industry Revenue Million Forecast, by Country 2019 & 2032
- Table 6: Optical Sorter Industry Revenue (Million) Forecast, by Application 2019 & 2032
- Table 7: Global Optical Sorter Industry Revenue Million Forecast, by Country 2019 & 2032
- Table 8: Optical Sorter Industry Revenue (Million) Forecast, by Application 2019 & 2032
- Table 9: Global Optical Sorter Industry Revenue Million Forecast, by Country 2019 & 2032
- Table 10: Optical Sorter Industry Revenue (Million) Forecast, by Application 2019 & 2032
- Table 11: Global Optical Sorter Industry Revenue Million Forecast, by Country 2019 & 2032
- Table 12: Optical Sorter Industry Revenue (Million) Forecast, by Application 2019 & 2032
- Table 13: Global Optical Sorter Industry Revenue Million Forecast, by Technology 2019 & 2032
- Table 14: Global Optical Sorter Industry Revenue Million Forecast, by End-user Industries 2019 & 2032
- Table 15: Global Optical Sorter Industry Revenue Million Forecast, by Country 2019 & 2032
- Table 16: Global Optical Sorter Industry Revenue Million Forecast, by Technology 2019 & 2032
- Table 17: Global Optical Sorter Industry Revenue Million Forecast, by End-user Industries 2019 & 2032
- Table 18: Global Optical Sorter Industry Revenue Million Forecast, by Country 2019 & 2032
- Table 19: Global Optical Sorter Industry Revenue Million Forecast, by Technology 2019 & 2032
- Table 20: Global Optical Sorter Industry Revenue Million Forecast, by End-user Industries 2019 & 2032
- Table 21: Global Optical Sorter Industry Revenue Million Forecast, by Country 2019 & 2032
- Table 22: Global Optical Sorter Industry Revenue Million Forecast, by Technology 2019 & 2032
- Table 23: Global Optical Sorter Industry Revenue Million Forecast, by End-user Industries 2019 & 2032
- Table 24: Global Optical Sorter Industry Revenue Million Forecast, by Country 2019 & 2032
- Table 25: Global Optical Sorter Industry Revenue Million Forecast, by Technology 2019 & 2032
- Table 26: Global Optical Sorter Industry Revenue Million Forecast, by End-user Industries 2019 & 2032
- Table 27: Global Optical Sorter Industry Revenue Million Forecast, by Country 2019 & 2032
- Table 28: Global Optical Sorter Industry Revenue Million Forecast, by Technology 2019 & 2032
- Table 29: Global Optical Sorter Industry Revenue Million Forecast, by End-user Industries 2019 & 2032
- Table 30: Global Optical Sorter Industry Revenue Million Forecast, by Country 2019 & 2032
Frequently Asked Questions
1. What is the projected Compound Annual Growth Rate (CAGR) of the Optical Sorter Industry?
The projected CAGR is approximately 10.00%.
2. Which companies are prominent players in the Optical Sorter Industry?
Key companies in the market include Cimbria AS (AGCO Corporation), Van Wamel BV, Raytec Vision SpA, Machinex Industries Inc, KEN Bratney Co, TOMRA Systems ASA, Eagle Vizion Inc, Satake Corporation, Key Technology Inc ( Duravant LLC), Bhler Holding AG, National Recovery Technologies LLC, Hefei Meyer Optoelectronic Technology Inc, MSS Inc (CP Manufacturing Inc ), Sesotec GmbH*List Not Exhaustive.
3. What are the main segments of the Optical Sorter Industry?
The market segments include Technology, End-user Industries.
4. Can you provide details about the market size?
The market size is estimated to be USD XX Million as of 2022.
5. What are some drivers contributing to market growth?
Increasing Demand for Reducing the Delivery and Processing Time; Stringent Regulations Regarding the Food Quality and Labor Costs.
6. What are the notable trends driving market growth?
Food Industry is Expected to Gain Demand Momentum Owing to Evolving Regulations.
7. Are there any restraints impacting market growth?
High Deployment and Maintenance Costs; Real-time Technical Challenges and the Need for Skilled Workforce.
8. Can you provide examples of recent developments in the market?
November 2022: Key Technology Inc. launched its Herbert OCULUS whole potato optical sorter and showcased its range of other high-performance solutions for fresh and processed potatoes and vegetables. These sorters identify and remove potatoes with defects and diseases, as well as potatoes outside the specified length and width profile if desired.
9. What pricing options are available for accessing the report?
Pricing options include single-user, multi-user, and enterprise licenses priced at USD 4750, USD 5250, and USD 8750 respectively.
10. Is the market size provided in terms of value or volume?
The market size is provided in terms of value, measured in Million.
11. Are there any specific market keywords associated with the report?
Yes, the market keyword associated with the report is "Optical Sorter Industry," which aids in identifying and referencing the specific market segment covered.
12. How do I determine which pricing option suits my needs best?
The pricing options vary based on user requirements and access needs. Individual users may opt for single-user licenses, while businesses requiring broader access may choose multi-user or enterprise licenses for cost-effective access to the report.
13. Are there any additional resources or data provided in the Optical Sorter Industry report?
While the report offers comprehensive insights, it's advisable to review the specific contents or supplementary materials provided to ascertain if additional resources or data are available.
14. How can I stay updated on further developments or reports in the Optical Sorter Industry?
To stay informed about further developments, trends, and reports in the Optical Sorter Industry, consider subscribing to industry newsletters, following relevant companies and organizations, or regularly checking reputable industry news sources and publications.
Methodology
Step 1 - Identification of Relevant Samples Size from Population Database


Step 2 - Approaches for Defining Global Market Size (Value, Volume* & Price*)

Note*: In applicable scenarios
Step 3 - Data Sources
Primary Research
- Web Analytics
- Survey Reports
- Research Institute
- Latest Research Reports
- Opinion Leaders
Secondary Research
- Annual Reports
- White Paper
- Latest Press Release
- Industry Association
- Paid Database
- Investor Presentations

Step 4 - Data Triangulation
Involves using different sources of information in order to increase the validity of a study
These sources are likely to be stakeholders in a program - participants, other researchers, program staff, other community members, and so on.
Then we put all data in single framework & apply various statistical tools to find out the dynamic on the market.
During the analysis stage, feedback from the stakeholder groups would be compared to determine areas of agreement as well as areas of divergence
