

Key Insights
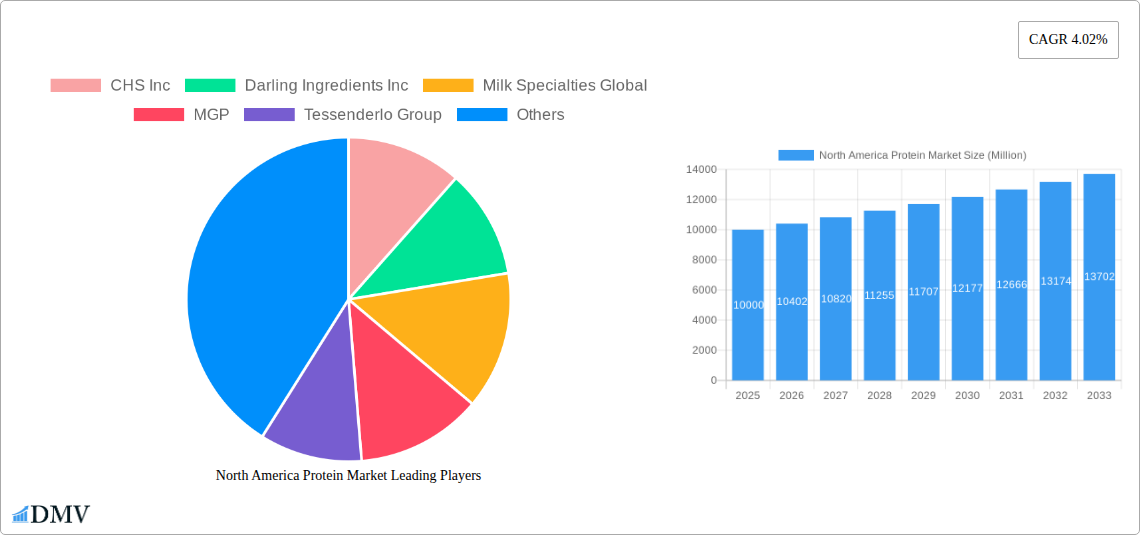
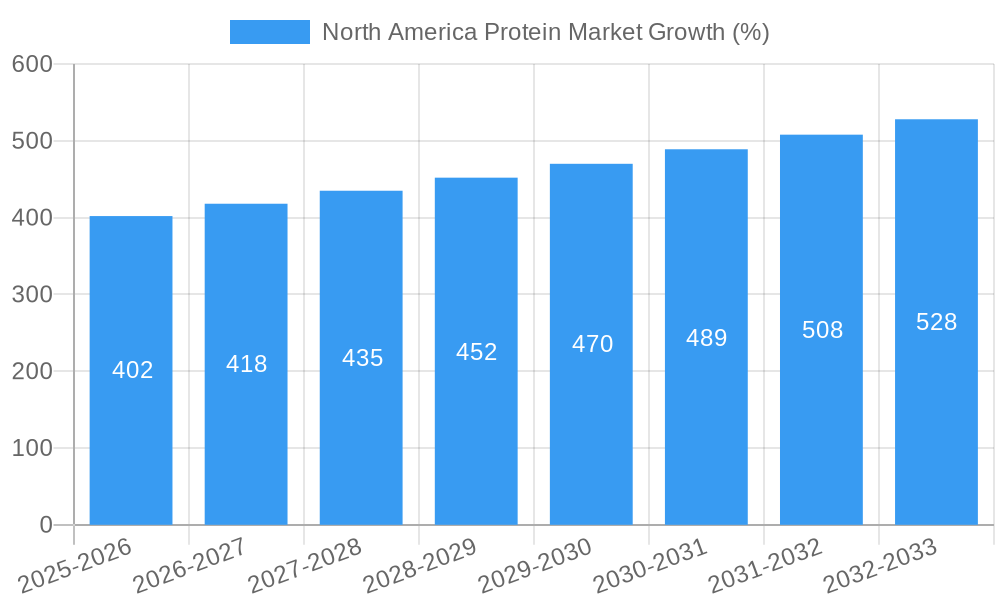
The North American protein market, valued at approximately $XX million in 2025, is projected to experience robust growth, driven by a CAGR of 4.02% from 2025 to 2033. This expansion is fueled by several key factors. The burgeoning health and wellness sector, with increased consumer demand for high-protein diets and functional foods, significantly contributes to market growth. The rise of plant-based protein alternatives, catering to both vegetarian/vegan consumers and those seeking sustainable protein sources, is another significant driver. Furthermore, the growing animal feed industry, particularly in the United States and Canada, necessitates a substantial supply of protein-rich ingredients, fueling market expansion. Increased demand for protein in the food and beverage sector, encompassing everything from protein bars and shakes to fortified dairy products, further bolsters market growth. The competitive landscape is marked by both established players like Archer Daniels Midland Company and Glanbia PLC, and innovative startups focusing on novel protein sources and processing technologies. Geographic segmentation reveals the United States as the dominant market within North America, followed by Canada and Mexico.
However, the market faces some challenges. Fluctuations in raw material prices, particularly for animal-derived proteins, can impact profitability and overall market growth. Stringent regulations concerning food safety and labeling also impose compliance costs on manufacturers. Furthermore, maintaining a consistent supply chain, particularly with the increasing demand for sustainable and ethically sourced protein, poses a challenge for market players. Despite these constraints, the long-term outlook for the North American protein market remains positive, driven by continued consumer demand, technological advancements, and the growing awareness of protein's crucial role in human health and well-being. The market is expected to see further diversification in protein sources and increased focus on product innovation to meet evolving consumer preferences and dietary needs. Specific segments like sports nutrition and animal feed are poised for particularly strong growth within this timeframe.
North America Protein Market: A Comprehensive Report (2019-2033)
This insightful report provides a detailed analysis of the North America protein market, encompassing the historical period (2019-2024), base year (2025), and forecast period (2025-2033). The study covers key segments including animal feed, food and beverages, and sport/performance nutrition, across major North American countries: the United States, Canada, Mexico, and the Rest of North America. With a focus on market size, growth trajectories, competitive dynamics, and future opportunities, this report is an essential resource for stakeholders seeking to navigate this dynamic market. The market is estimated to be valued at xx Million in 2025 and is projected to reach xx Million by 2033, exhibiting a CAGR of xx% during the forecast period.
North America Protein Market Composition & Trends
The North America protein market is characterized by a moderately concentrated landscape with several major players holding significant market share. Market share distribution among the top five players is estimated at approximately xx%, with CHS Inc., Darling Ingredients Inc., and Archer Daniels Midland Company among the leading companies. Innovation is a key driver, fueled by the rising demand for functional and sustainable protein sources. Regulatory landscapes vary across countries, impacting labeling requirements and ingredient approvals. Substitute products, such as plant-based proteins, are gaining traction, influencing market dynamics. End-user profiles are diverse, ranging from large food and beverage manufacturers to smaller specialized sports nutrition companies. Mergers and acquisitions (M&A) activity has been significant, with deal values totaling xx Million in the past five years, reflecting consolidation and expansion efforts by major players.
- Market Concentration: Moderately concentrated, with top 5 players holding approximately xx% market share.
- Innovation Catalysts: Growing demand for functional and sustainable protein sources, technological advancements in protein extraction and processing.
- Regulatory Landscape: Varied across countries, impacting labeling and ingredient approval processes.
- Substitute Products: Plant-based proteins are gaining market share.
- M&A Activity: Significant activity in recent years, with total deal values estimated at xx Million.
North America Protein Market Industry Evolution
The North America protein market has witnessed robust growth over the past decade, driven by several factors. Increasing health consciousness and the rising popularity of protein-rich diets have fueled demand across various segments. Technological advancements in protein extraction and processing have enhanced efficiency and enabled the development of novel protein products. The shift towards healthier and more convenient food choices is further impacting consumer preferences, creating opportunities for innovative protein formulations. The market's growth trajectory is expected to remain positive throughout the forecast period, with growth rates varying across segments and countries. The adoption of sustainable protein sourcing practices is also increasing, driven by environmental concerns. Further, the burgeoning sports nutrition segment, with increasing participation in fitness activities and awareness of performance enhancement, significantly contributes to the overall market growth. Growth rate in the forecast period is predicted to be xx%.
Leading Regions, Countries, or Segments in North America Protein Market
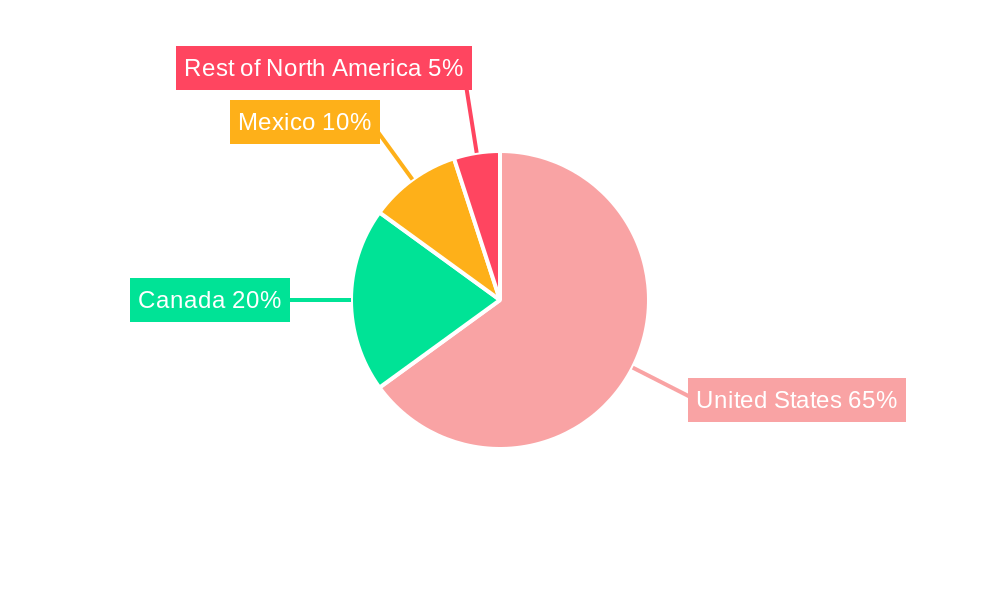
The United States dominates the North America protein market, owing to its large population, robust food and beverage industry, and significant animal feed sector.
United States: Largest market, driven by high consumption, strong food and beverage industry, and substantial animal feed sector.
Canada: Significant market, with growth propelled by increasing health consciousness and the demand for functional protein products.
Mexico: Growing market, with potential for expansion fueled by rising disposable incomes and increasing protein consumption.
Animal Feed: Largest segment by volume, driven by high demand from the livestock industry.
Food and Beverages: Significant segment, with growth fueled by the popularity of protein-enhanced food and beverages.
Sport/Performance Nutrition: Fastest-growing segment, driven by increasing health consciousness and fitness trends.
Key Drivers (United States): High per capita protein consumption, well-established food and beverage industry, large livestock sector, substantial investment in protein processing technologies.
Key Drivers (Canada): Growing health consciousness, rising demand for functional protein products, government support for the agricultural sector.
Key Drivers (Mexico): Increasing disposable incomes, rising protein consumption rates, growing demand for convenient protein sources.
North America Protein Market Product Innovations
Recent years have witnessed significant product innovations within the North America protein market. Companies are focusing on developing novel protein sources, such as insect protein and single-cell proteins, to cater to consumer demand for sustainable alternatives. Formulations are increasingly tailored to meet specific nutritional needs, including products targeting specific demographics or dietary requirements (e.g., vegan, ketogenic). Technological advancements in protein processing, such as microencapsulation and enzymatic hydrolysis, are enhancing the functionality and bioavailability of protein ingredients. Ready-to-drink (RTD) protein shakes, like Optimum Nutrition's Gold Standard Protein Shake, exemplifies the innovation trend in convenience and enhanced taste.
Propelling Factors for North America Protein Market Growth
Several factors are driving the growth of the North America protein market. These include increasing consumer awareness of the importance of protein in a balanced diet, rising health consciousness, the increasing popularity of fitness activities, and technological advancements that improve protein production and extraction efficiency. Furthermore, favorable government regulations promoting the development and use of sustainable protein sources in food and beverages and the robust growth of the animal feed industry are all significant contributors to market expansion. The burgeoning sports nutrition sector, driven by fitness trends, adds another layer to this robust growth story.
Obstacles in the North America Protein Market
The North America protein market faces several challenges. Regulatory hurdles, such as labeling requirements and ingredient approvals, can create complexities for manufacturers. Supply chain disruptions, exacerbated by factors like weather events and geopolitical instability, can impact ingredient availability and pricing. Intense competition among established and emerging players adds to the pressure on profit margins. Fluctuations in raw material prices also create price volatility, affecting the overall market stability. These challenges can influence the availability and cost of protein products.
Future Opportunities in North America Protein Market
Future opportunities in the North America protein market include the expansion into new markets, such as plant-based protein alternatives and insect-based protein products. The development of novel protein sources and innovative formulations to cater to specific dietary needs and preferences creates significant opportunities. Technological advancements, such as precision fermentation and cell-based proteins, will continue to open new avenues for sustainable and efficient protein production. Furthermore, exploiting emerging consumer trends toward clean label products and personalized nutrition will be key to unlocking further market potential.
Major Players in the North America Protein Market Ecosystem
- CHS Inc.
- Darling Ingredients Inc.
- Milk Specialties Global
- MGP
- Tessenderlo Group
- Arla Foods amba
- Gelita AG
- The Scoular Company
- International Flavors & Fragrances Inc.
- Archer Daniels Midland Company
- Glanbia PLC
- Bunge Limited
- Roquette Frères
- Agropur Dairy Cooperative
- Kerry Group PLC
- Farbest-Tallman Foods Corporation
- Fonterra Co-operative Group Limited
- Südzucker Group
- Groupe Lactalis
Key Developments in North America Protein Market Industry
- August 2022: Optimum Nutrition launched its new Gold Standard Protein Shake, an RTD product available in chocolate and vanilla flavors, containing 24 grams of protein per serving. This launch reflects the ongoing demand for convenient and high-protein products.
- June 2022: Fonterra JV formed a joint venture with Tillamook Country Creamery Association and Three-Mile Canyon Farm to launch Pro-Optima™, a Grade A functional whey protein concentrate (fWPC). This strategic partnership showcases the collaboration within the industry for innovative whey protein products.
- August 2021: Darling Ingredients expanded its manufacturing facility in Nebraska, adding a unit dedicated to poultry conversion, signifying investment in protein processing and diversification within the industry.
Strategic North America Protein Market Forecast
The North America protein market is poised for continued growth driven by increasing health consciousness, innovation in protein sources and formulations, and expansion into new market segments. The demand for convenient, high-quality, and sustainable protein products will remain a key growth catalyst. Emerging technologies, such as cell-based and precision fermentation proteins, hold the potential to disrupt the market further, offering new avenues for sustainable and scalable production. The overall market outlook is positive, with significant potential for continued expansion in the coming years.
North America Protein Market Segmentation
-
1. Source
-
1.1. Animal
-
1.1.1. By Protein Type
- 1.1.1.1. Casein and Caseinates
- 1.1.1.2. Collagen
- 1.1.1.3. Egg Protein
- 1.1.1.4. Gelatin
- 1.1.1.5. Insect Protein
- 1.1.1.6. Milk Protein
- 1.1.1.7. Whey Protein
- 1.1.1.8. Other Animal Protein
-
1.1.1. By Protein Type
-
1.2. Microbial
- 1.2.1. Algae Protein
- 1.2.2. Mycoprotein
-
1.3. Plant
- 1.3.1. Hemp Protein
- 1.3.2. Pea Protein
- 1.3.3. Potato Protein
- 1.3.4. Rice Protein
- 1.3.5. Soy Protein
- 1.3.6. Wheat Protein
- 1.3.7. Other Plant Protein
-
1.1. Animal
-
2. End User
- 2.1. Animal Feed
-
2.2. Food and Beverages
-
2.2.1. By Sub End User
- 2.2.1.1. Bakery
- 2.2.1.2. Breakfast Cereals
- 2.2.1.3. Condiments/Sauces
- 2.2.1.4. Confectionery
- 2.2.1.5. Dairy and Dairy Alternative Products
- 2.2.1.6. Meat/Poultry/Seafood and Meat Alternative Products
- 2.2.1.7. RTE/RTC Food Products
- 2.2.1.8. Snacks
-
2.2.1. By Sub End User
- 2.3. Personal Care and Cosmetics
-
2.4. Supplements
- 2.4.1. Baby Food and Infant Formula
- 2.4.2. Elderly Nutrition and Medical Nutrition
- 2.4.3. Sport/Performance Nutrition
North America Protein Market Segmentation By Geography
-
1. North America
- 1.1. United States
- 1.2. Canada
- 1.3. Mexico
North America Protein Market REPORT HIGHLIGHTS
| Aspects | Details |
|---|---|
| Study Period | 2019-2033 |
| Base Year | 2024 |
| Estimated Year | 2025 |
| Forecast Period | 2025-2033 |
| Historical Period | 2019-2024 |
| Growth Rate | CAGR of 4.02% from 2019-2033 |
| Segmentation |
|
Table of Contents
- 1. Introduction
- 1.1. Research Scope
- 1.2. Market Segmentation
- 1.3. Research Methodology
- 1.4. Definitions and Assumptions
- 2. Executive Summary
- 2.1. Introduction
- 3. Market Dynamics
- 3.1. Introduction
- 3.2. Market Drivers
- 3.2.1. Increasing awareness towards fitness among consumers; Demand for convenient fortified foods
- 3.3. Market Restrains
- 3.3.1. Prevalence of allergen intolerance among the consumers
- 3.4. Market Trends
- 3.4.1. OTHER KEY INDUSTRY TRENDS COVERED IN THE REPORT
- 4. Market Factor Analysis
- 4.1. Porters Five Forces
- 4.2. Supply/Value Chain
- 4.3. PESTEL analysis
- 4.4. Market Entropy
- 4.5. Patent/Trademark Analysis
- 5. North America Protein Market Analysis, Insights and Forecast, 2019-2031
- 5.1. Market Analysis, Insights and Forecast - by Source
- 5.1.1. Animal
- 5.1.1.1. By Protein Type
- 5.1.1.1.1. Casein and Caseinates
- 5.1.1.1.2. Collagen
- 5.1.1.1.3. Egg Protein
- 5.1.1.1.4. Gelatin
- 5.1.1.1.5. Insect Protein
- 5.1.1.1.6. Milk Protein
- 5.1.1.1.7. Whey Protein
- 5.1.1.1.8. Other Animal Protein
- 5.1.1.1. By Protein Type
- 5.1.2. Microbial
- 5.1.2.1. Algae Protein
- 5.1.2.2. Mycoprotein
- 5.1.3. Plant
- 5.1.3.1. Hemp Protein
- 5.1.3.2. Pea Protein
- 5.1.3.3. Potato Protein
- 5.1.3.4. Rice Protein
- 5.1.3.5. Soy Protein
- 5.1.3.6. Wheat Protein
- 5.1.3.7. Other Plant Protein
- 5.1.1. Animal
- 5.2. Market Analysis, Insights and Forecast - by End User
- 5.2.1. Animal Feed
- 5.2.2. Food and Beverages
- 5.2.2.1. By Sub End User
- 5.2.2.1.1. Bakery
- 5.2.2.1.2. Breakfast Cereals
- 5.2.2.1.3. Condiments/Sauces
- 5.2.2.1.4. Confectionery
- 5.2.2.1.5. Dairy and Dairy Alternative Products
- 5.2.2.1.6. Meat/Poultry/Seafood and Meat Alternative Products
- 5.2.2.1.7. RTE/RTC Food Products
- 5.2.2.1.8. Snacks
- 5.2.2.1. By Sub End User
- 5.2.3. Personal Care and Cosmetics
- 5.2.4. Supplements
- 5.2.4.1. Baby Food and Infant Formula
- 5.2.4.2. Elderly Nutrition and Medical Nutrition
- 5.2.4.3. Sport/Performance Nutrition
- 5.3. Market Analysis, Insights and Forecast - by Region
- 5.3.1. North America
- 5.1. Market Analysis, Insights and Forecast - by Source
- 6. United States North America Protein Market Analysis, Insights and Forecast, 2019-2031
- 7. Canada North America Protein Market Analysis, Insights and Forecast, 2019-2031
- 8. Mexico North America Protein Market Analysis, Insights and Forecast, 2019-2031
- 9. Rest of North America North America Protein Market Analysis, Insights and Forecast, 2019-2031
- 10. Competitive Analysis
- 10.1. Market Share Analysis 2024
- 10.2. Company Profiles
- 10.2.1 CHS Inc
- 10.2.1.1. Overview
- 10.2.1.2. Products
- 10.2.1.3. SWOT Analysis
- 10.2.1.4. Recent Developments
- 10.2.1.5. Financials (Based on Availability)
- 10.2.2 Darling Ingredients Inc
- 10.2.2.1. Overview
- 10.2.2.2. Products
- 10.2.2.3. SWOT Analysis
- 10.2.2.4. Recent Developments
- 10.2.2.5. Financials (Based on Availability)
- 10.2.3 Milk Specialties Global
- 10.2.3.1. Overview
- 10.2.3.2. Products
- 10.2.3.3. SWOT Analysis
- 10.2.3.4. Recent Developments
- 10.2.3.5. Financials (Based on Availability)
- 10.2.4 MGP
- 10.2.4.1. Overview
- 10.2.4.2. Products
- 10.2.4.3. SWOT Analysis
- 10.2.4.4. Recent Developments
- 10.2.4.5. Financials (Based on Availability)
- 10.2.5 Tessenderlo Group
- 10.2.5.1. Overview
- 10.2.5.2. Products
- 10.2.5.3. SWOT Analysis
- 10.2.5.4. Recent Developments
- 10.2.5.5. Financials (Based on Availability)
- 10.2.6 Arla Foods amba
- 10.2.6.1. Overview
- 10.2.6.2. Products
- 10.2.6.3. SWOT Analysis
- 10.2.6.4. Recent Developments
- 10.2.6.5. Financials (Based on Availability)
- 10.2.7 Gelita AG
- 10.2.7.1. Overview
- 10.2.7.2. Products
- 10.2.7.3. SWOT Analysis
- 10.2.7.4. Recent Developments
- 10.2.7.5. Financials (Based on Availability)
- 10.2.8 The Scoular Compan
- 10.2.8.1. Overview
- 10.2.8.2. Products
- 10.2.8.3. SWOT Analysis
- 10.2.8.4. Recent Developments
- 10.2.8.5. Financials (Based on Availability)
- 10.2.9 International Flavors & Fragrances Inc
- 10.2.9.1. Overview
- 10.2.9.2. Products
- 10.2.9.3. SWOT Analysis
- 10.2.9.4. Recent Developments
- 10.2.9.5. Financials (Based on Availability)
- 10.2.10 Archer Daniels Midland Company
- 10.2.10.1. Overview
- 10.2.10.2. Products
- 10.2.10.3. SWOT Analysis
- 10.2.10.4. Recent Developments
- 10.2.10.5. Financials (Based on Availability)
- 10.2.11 Glanbia PLC
- 10.2.11.1. Overview
- 10.2.11.2. Products
- 10.2.11.3. SWOT Analysis
- 10.2.11.4. Recent Developments
- 10.2.11.5. Financials (Based on Availability)
- 10.2.12 Bunge Limited
- 10.2.12.1. Overview
- 10.2.12.2. Products
- 10.2.12.3. SWOT Analysis
- 10.2.12.4. Recent Developments
- 10.2.12.5. Financials (Based on Availability)
- 10.2.13 Roquette Frères
- 10.2.13.1. Overview
- 10.2.13.2. Products
- 10.2.13.3. SWOT Analysis
- 10.2.13.4. Recent Developments
- 10.2.13.5. Financials (Based on Availability)
- 10.2.14 Agropur Dairy Cooperative
- 10.2.14.1. Overview
- 10.2.14.2. Products
- 10.2.14.3. SWOT Analysis
- 10.2.14.4. Recent Developments
- 10.2.14.5. Financials (Based on Availability)
- 10.2.15 Kerry Group PLC
- 10.2.15.1. Overview
- 10.2.15.2. Products
- 10.2.15.3. SWOT Analysis
- 10.2.15.4. Recent Developments
- 10.2.15.5. Financials (Based on Availability)
- 10.2.16 Farbest-Tallman Foods Corporation
- 10.2.16.1. Overview
- 10.2.16.2. Products
- 10.2.16.3. SWOT Analysis
- 10.2.16.4. Recent Developments
- 10.2.16.5. Financials (Based on Availability)
- 10.2.17 Fonterra Co-operative Group Limited
- 10.2.17.1. Overview
- 10.2.17.2. Products
- 10.2.17.3. SWOT Analysis
- 10.2.17.4. Recent Developments
- 10.2.17.5. Financials (Based on Availability)
- 10.2.18 Südzucker Group
- 10.2.18.1. Overview
- 10.2.18.2. Products
- 10.2.18.3. SWOT Analysis
- 10.2.18.4. Recent Developments
- 10.2.18.5. Financials (Based on Availability)
- 10.2.19 Groupe Lactalis
- 10.2.19.1. Overview
- 10.2.19.2. Products
- 10.2.19.3. SWOT Analysis
- 10.2.19.4. Recent Developments
- 10.2.19.5. Financials (Based on Availability)
- 10.2.1 CHS Inc
List of Figures
- Figure 1: North America Protein Market Revenue Breakdown (Million, %) by Product 2024 & 2032
- Figure 2: North America Protein Market Share (%) by Company 2024
List of Tables
- Table 1: North America Protein Market Revenue Million Forecast, by Region 2019 & 2032
- Table 2: North America Protein Market Volume K Tons Forecast, by Region 2019 & 2032
- Table 3: North America Protein Market Revenue Million Forecast, by Source 2019 & 2032
- Table 4: North America Protein Market Volume K Tons Forecast, by Source 2019 & 2032
- Table 5: North America Protein Market Revenue Million Forecast, by End User 2019 & 2032
- Table 6: North America Protein Market Volume K Tons Forecast, by End User 2019 & 2032
- Table 7: North America Protein Market Revenue Million Forecast, by Region 2019 & 2032
- Table 8: North America Protein Market Volume K Tons Forecast, by Region 2019 & 2032
- Table 9: North America Protein Market Revenue Million Forecast, by Country 2019 & 2032
- Table 10: North America Protein Market Volume K Tons Forecast, by Country 2019 & 2032
- Table 11: United States North America Protein Market Revenue (Million) Forecast, by Application 2019 & 2032
- Table 12: United States North America Protein Market Volume (K Tons) Forecast, by Application 2019 & 2032
- Table 13: Canada North America Protein Market Revenue (Million) Forecast, by Application 2019 & 2032
- Table 14: Canada North America Protein Market Volume (K Tons) Forecast, by Application 2019 & 2032
- Table 15: Mexico North America Protein Market Revenue (Million) Forecast, by Application 2019 & 2032
- Table 16: Mexico North America Protein Market Volume (K Tons) Forecast, by Application 2019 & 2032
- Table 17: Rest of North America North America Protein Market Revenue (Million) Forecast, by Application 2019 & 2032
- Table 18: Rest of North America North America Protein Market Volume (K Tons) Forecast, by Application 2019 & 2032
- Table 19: North America Protein Market Revenue Million Forecast, by Source 2019 & 2032
- Table 20: North America Protein Market Volume K Tons Forecast, by Source 2019 & 2032
- Table 21: North America Protein Market Revenue Million Forecast, by End User 2019 & 2032
- Table 22: North America Protein Market Volume K Tons Forecast, by End User 2019 & 2032
- Table 23: North America Protein Market Revenue Million Forecast, by Country 2019 & 2032
- Table 24: North America Protein Market Volume K Tons Forecast, by Country 2019 & 2032
- Table 25: United States North America Protein Market Revenue (Million) Forecast, by Application 2019 & 2032
- Table 26: United States North America Protein Market Volume (K Tons) Forecast, by Application 2019 & 2032
- Table 27: Canada North America Protein Market Revenue (Million) Forecast, by Application 2019 & 2032
- Table 28: Canada North America Protein Market Volume (K Tons) Forecast, by Application 2019 & 2032
- Table 29: Mexico North America Protein Market Revenue (Million) Forecast, by Application 2019 & 2032
- Table 30: Mexico North America Protein Market Volume (K Tons) Forecast, by Application 2019 & 2032
Frequently Asked Questions
1. What is the projected Compound Annual Growth Rate (CAGR) of the North America Protein Market?
The projected CAGR is approximately 4.02%.
2. Which companies are prominent players in the North America Protein Market?
Key companies in the market include CHS Inc, Darling Ingredients Inc, Milk Specialties Global, MGP, Tessenderlo Group, Arla Foods amba, Gelita AG, The Scoular Compan, International Flavors & Fragrances Inc, Archer Daniels Midland Company, Glanbia PLC, Bunge Limited, Roquette Frères, Agropur Dairy Cooperative, Kerry Group PLC, Farbest-Tallman Foods Corporation, Fonterra Co-operative Group Limited, Südzucker Group, Groupe Lactalis.
3. What are the main segments of the North America Protein Market?
The market segments include Source, End User.
4. Can you provide details about the market size?
The market size is estimated to be USD XX Million as of 2022.
5. What are some drivers contributing to market growth?
Increasing awareness towards fitness among consumers; Demand for convenient fortified foods.
6. What are the notable trends driving market growth?
OTHER KEY INDUSTRY TRENDS COVERED IN THE REPORT.
7. Are there any restraints impacting market growth?
Prevalence of allergen intolerance among the consumers.
8. Can you provide examples of recent developments in the market?
August 2022: Optimum Nutrition announced the launch of its new Gold Standard Protein Shake. The RTD is available in chocolate and vanilla flavors, and formulated with 24 grams of protein per serving.June 2022: Fonterra JV has entered into a joint venture with Tillamook country creamery association(TCCA) and a three-mile canyon farm in the United States to launch Pro-Optima TM, a grade A functional whey protein concentrate (fWPC).August 2021: Darling Ingredients expanded its existing manufacturing facility that includes Nebraska’s first operation dedicated solely to poultry conversion. This expanded manufacturing unit may also facilitate protein conversion.
9. What pricing options are available for accessing the report?
Pricing options include single-user, multi-user, and enterprise licenses priced at USD 3800, USD 4500, and USD 5800 respectively.
10. Is the market size provided in terms of value or volume?
The market size is provided in terms of value, measured in Million and volume, measured in K Tons.
11. Are there any specific market keywords associated with the report?
Yes, the market keyword associated with the report is "North America Protein Market," which aids in identifying and referencing the specific market segment covered.
12. How do I determine which pricing option suits my needs best?
The pricing options vary based on user requirements and access needs. Individual users may opt for single-user licenses, while businesses requiring broader access may choose multi-user or enterprise licenses for cost-effective access to the report.
13. Are there any additional resources or data provided in the North America Protein Market report?
While the report offers comprehensive insights, it's advisable to review the specific contents or supplementary materials provided to ascertain if additional resources or data are available.
14. How can I stay updated on further developments or reports in the North America Protein Market?
To stay informed about further developments, trends, and reports in the North America Protein Market, consider subscribing to industry newsletters, following relevant companies and organizations, or regularly checking reputable industry news sources and publications.
Methodology
Step 1 - Identification of Relevant Samples Size from Population Database


Step 2 - Approaches for Defining Global Market Size (Value, Volume* & Price*)

Note*: In applicable scenarios
Step 3 - Data Sources
Primary Research
- Web Analytics
- Survey Reports
- Research Institute
- Latest Research Reports
- Opinion Leaders
Secondary Research
- Annual Reports
- White Paper
- Latest Press Release
- Industry Association
- Paid Database
- Investor Presentations

Step 4 - Data Triangulation
Involves using different sources of information in order to increase the validity of a study
These sources are likely to be stakeholders in a program - participants, other researchers, program staff, other community members, and so on.
Then we put all data in single framework & apply various statistical tools to find out the dynamic on the market.
During the analysis stage, feedback from the stakeholder groups would be compared to determine areas of agreement as well as areas of divergence
