

Key Insights
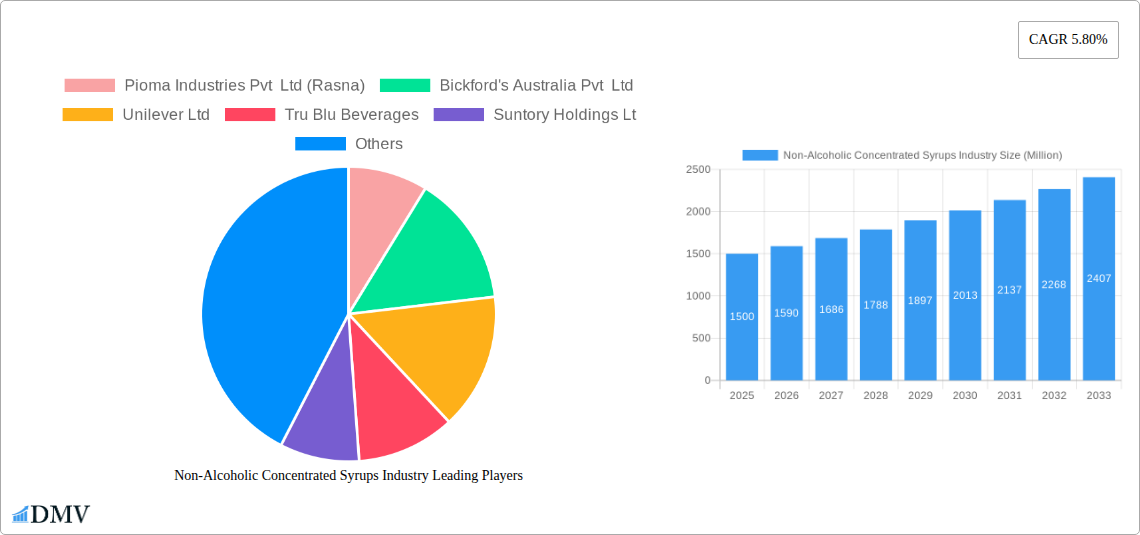
The non-alcoholic concentrated syrups market, valued at approximately $XX million in 2025, is projected to experience robust growth, exhibiting a compound annual growth rate (CAGR) of 5.80% from 2025 to 2033. This expansion is fueled by several key drivers. The rising popularity of health-conscious beverages, coupled with the convenience and cost-effectiveness of concentrated syrups, are significant factors. Consumers are increasingly seeking healthier alternatives to sugary sodas and juices, leading to a surge in demand for fruit and vegetable-based syrups. Furthermore, the expanding food service industry, including cafes, restaurants, and bars, contributes to market growth by increasing the demand for high-quality syrups for creating a diverse range of beverages. Innovation in flavors and the introduction of organic and natural options further cater to evolving consumer preferences, bolstering market expansion. However, factors such as fluctuating raw material prices and intense competition from established players can act as restraints.
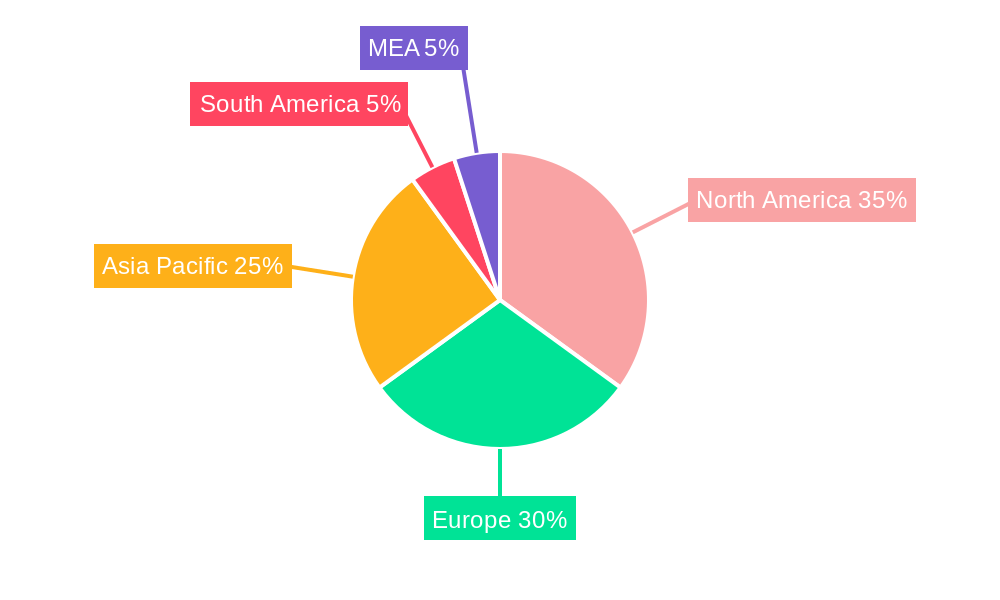
The market segmentation reveals considerable opportunities. Fruit squashes currently dominate the type segment, followed by vegetable-based options. The off-trade channel (retail sales) likely holds a larger share compared to the on-trade (food service) channel, although the latter is expected to witness faster growth due to increasing out-of-home consumption. Geographically, North America and Europe are presently mature markets, but Asia-Pacific is anticipated to show the most significant growth potential, driven by rising disposable incomes and changing consumption patterns in rapidly developing economies like India and China. Key players like Rasna, Bickford's, Unilever, and Suntory are vying for market share through product diversification, strategic partnerships, and expansion into new regions. The forecast period (2025-2033) presents significant potential for both established and emerging players to capitalize on the rising demand for healthier, convenient, and diverse non-alcoholic concentrated syrups.
Non-Alcoholic Concentrated Syrups Industry: A Comprehensive Market Report (2019-2033)
This insightful report provides a comprehensive analysis of the Non-Alcoholic Concentrated Syrups industry, offering a detailed overview of market dynamics, key players, and future growth prospects. With a study period spanning 2019-2033, a base year of 2025, and an estimated year of 2025, this report is an invaluable resource for stakeholders seeking to understand and navigate this evolving market. The global market size in 2025 is estimated to be at xx Million.
Non-Alcoholic Concentrated Syrups Industry Market Composition & Trends
This section delves into the competitive landscape of the non-alcoholic concentrated syrups market, analyzing market concentration, innovation drivers, regulatory frameworks, substitute products, end-user profiles, and mergers & acquisitions (M&A) activities. The market is characterized by a moderately concentrated structure, with key players like Pioma Industries Pvt Ltd (Rasna), Bickford's Australia Pvt Ltd, Unilever Ltd, and Suntory Holdings Ltd holding significant market share. However, the presence of numerous smaller regional players and the emergence of innovative startups contribute to a dynamic market environment.
- Market Share Distribution (2025): Pioma Industries Pvt Ltd (Rasna): xx%; Unilever Ltd: xx%; Bickford's Australia Pvt Ltd: xx%; Others: xx%. (Note: These figures are estimations)
- Innovation Catalysts: Growing consumer demand for healthier and more convenient beverage options is driving innovation in natural sweeteners, functional ingredients, and diverse flavor profiles.
- Regulatory Landscape: Regulations concerning sugar content, labeling, and food safety vary across regions, impacting market dynamics and influencing product formulation.
- Substitute Products: Ready-to-drink beverages, fruit juices, and other sweetened drinks pose a competitive threat.
- End-User Profiles: The primary end-users are food service establishments (on-trade), retailers (off-trade), and home consumers.
- M&A Activities (2019-2024): A total of xx M&A deals were recorded during this period, with an estimated total value of xx Million. These transactions primarily involved smaller companies being acquired by larger players to expand product portfolios and geographic reach.
Non-Alcoholic Concentrated Syrups Industry Industry Evolution
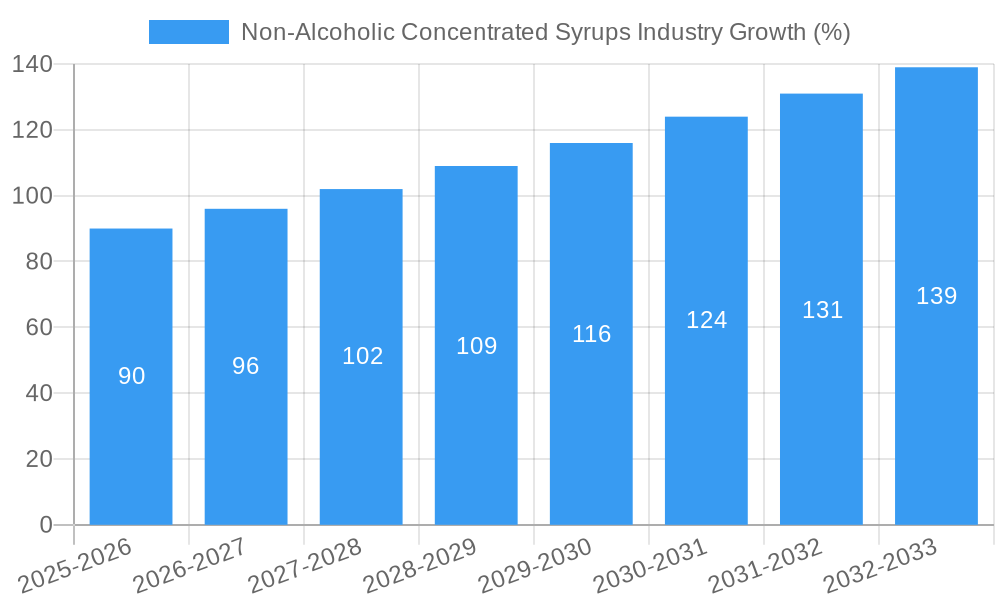
This section analyzes the historical and projected growth trajectories of the non-alcoholic concentrated syrups market, exploring technological advancements and shifting consumer preferences. The market has witnessed a steady growth trajectory over the historical period (2019-2024), driven by rising disposable incomes, changing lifestyles, and increasing urbanization. Technological advancements in processing and packaging have enhanced product quality, shelf life, and convenience. The demand for healthier options, such as reduced sugar and natural ingredients, is also shaping market trends. The market is expected to maintain a healthy Compound Annual Growth Rate (CAGR) of xx% during the forecast period (2025-2033), reaching an estimated value of xx Million by 2033. Specific data on growth rates and adoption of natural sweeteners will be provided.
Leading Regions, Countries, or Segments in Non-Alcoholic Concentrated Syrups Industry
This section identifies the leading regions, countries, and segments within the non-alcoholic concentrated syrups market.
Dominant Segments:
- Type: Fruit squashes currently hold the largest market share, driven by strong consumer preference and widespread availability.
- Sales Channel: The off-trade channel (retail sales) dominates, with supermarkets and hypermarkets being major distribution points.
Key Drivers for Dominance:
- Fruit Squashes: High consumer preference for familiar fruity flavors, wide availability, and relatively lower pricing compared to other segments.
- Off-trade Channel: Established distribution networks, convenience for consumers, and broader reach compared to on-trade channels.
In-depth analysis: The dominance of fruit squashes is attributed to their established market presence, diverse flavor profiles catering to various preferences, and relatively lower production costs. Similarly, the off-trade channel’s dominance stems from its extensive reach and consumer convenience. Further details on regional market penetration and country-wise consumption patterns will be detailed in the report.
Non-Alcoholic Concentrated Syrups Industry Product Innovations
Recent innovations focus on creating healthier, more convenient, and diverse product offerings. This includes the development of low-sugar or sugar-free options using natural sweeteners like stevia or monk fruit. Companies are also focusing on enhancing flavor profiles using natural fruit extracts and developing convenient packaging formats, such as single-serve pouches and ready-to-mix concentrates. These innovations are aimed at catering to health-conscious consumers and modern lifestyles, enhancing consumer appeal. We will analyze the performance of these innovations using specific data points like market share and consumer feedback.
Propelling Factors for Non-Alcoholic Concentrated Syrups Industry Growth
Several factors contribute to the growth of the non-alcoholic concentrated syrups market. Rising disposable incomes in developing economies are driving increased consumption. Technological advancements in flavor enhancement and packaging have resulted in high-quality, convenient products. Favorable regulatory environments in some regions are stimulating market expansion, particularly with respect to labeling and safety standards. Furthermore, the increasing popularity of customized beverages and the rise of health-conscious consumption trends are pushing the industry towards innovation.
Obstacles in the Non-Alcoholic Concentrated Syrups Industry Market
The industry faces several challenges. Fluctuations in the prices of raw materials, especially fruits and sugar, significantly impact profitability. Stringent regulatory frameworks related to sugar content and labeling can restrict product formulation and increase compliance costs. Intense competition among established players and new entrants presents a constant pressure on pricing and market share. Supply chain disruptions, especially those caused by geopolitical instability or natural disasters, can also affect production and distribution.
Future Opportunities in Non-Alcoholic Concentrated Syrups Industry
Future growth opportunities lie in expanding into emerging markets, particularly in developing economies with rising disposable incomes and a growing preference for convenient beverages. The development of innovative flavors and functional ingredients, such as those with added vitamins or antioxidants, offers considerable potential. Catering to the increasing demand for healthier options with reduced sugar and natural ingredients will be crucial for market success. Exploring sustainable and environmentally friendly packaging solutions will be important to align with growing consumer concerns.
Major Players in the Non-Alcoholic Concentrated Syrups Industry Ecosystem
- Pioma Industries Pvt Ltd (Rasna)
- Bickford's Australia Pvt Ltd
- Unilever Ltd
- Tru Blu Beverages
- Suntory Holdings Ltd
- Britvic PLC
- Golden Circle Ltd
Key Developments in Non-Alcoholic Concentrated Syrups Industry Industry
- 2022-Q4: Unilever launches a new range of low-sugar fruit squashes.
- 2023-Q1: Britvic PLC acquires a smaller regional player, expanding its market presence.
- 2023-Q3: Rasna introduces a line of organic fruit concentrates. (Note: Specific dates and details will be provided in the full report)
Strategic Non-Alcoholic Concentrated Syrups Industry Market Forecast
The non-alcoholic concentrated syrups market is poised for continued growth, driven by factors like rising disposable incomes, changing lifestyles, and health-conscious consumption trends. The focus on innovation, particularly in healthy and convenient product formats, will be critical for success. Expanding into new markets and exploring sustainable packaging options will create further growth opportunities. This market is expected to maintain a healthy growth trajectory, with substantial market expansion in the coming years.
Non-Alcoholic Concentrated Syrups Industry Segmentation
-
1. Type
- 1.1. Fruit Squashes
- 1.2. Vegetable Squashes
- 1.3. Other Types
-
2. Sales Channel
- 2.1. Off-trade
- 2.2. On-trade
Non-Alcoholic Concentrated Syrups Industry Segmentation By Geography
-
1. North America
- 1.1. United States
- 1.2. Canada
- 1.3. Mexico
- 1.4. Rest of North America
-
2. Europe
- 2.1. Spain
- 2.2. United Kingdom
- 2.3. Germany
- 2.4. France
- 2.5. Italy
- 2.6. Russia
- 2.7. Rest of Europe
-
3. Asia Pacific
- 3.1. China
- 3.2. Japan
- 3.3. India
- 3.4. Australia
- 3.5. Rest of Asia Pacific
-
4. Rest of the World
- 4.1. South America
- 4.2. Middle East
Non-Alcoholic Concentrated Syrups Industry REPORT HIGHLIGHTS
| Aspects | Details |
|---|---|
| Study Period | 2019-2033 |
| Base Year | 2024 |
| Estimated Year | 2025 |
| Forecast Period | 2025-2033 |
| Historical Period | 2019-2024 |
| Growth Rate | CAGR of 5.80% from 2019-2033 |
| Segmentation |
|
Table of Contents
- 1. Introduction
- 1.1. Research Scope
- 1.2. Market Segmentation
- 1.3. Research Methodology
- 1.4. Definitions and Assumptions
- 2. Executive Summary
- 2.1. Introduction
- 3. Market Dynamics
- 3.1. Introduction
- 3.2. Market Drivers
- 3.2.1. The ease of use and long shelf life of concentrated syrups make them popular for both commercial use and at-home preparation of beverages.
- 3.3. Market Restrains
- 3.3.1 Some consumers may be wary of concentrated syrups due to concerns about high sugar content and artificial ingredients
- 3.3.2 which can affect market growth
- 3.4. Market Trends
- 3.4.1 Increasing interest in syrups made with natural ingredients
- 3.4.2 reduced sugar content
- 3.4.3 and organic certifications to cater to health-conscious consumers
- 4. Market Factor Analysis
- 4.1. Porters Five Forces
- 4.2. Supply/Value Chain
- 4.3. PESTEL analysis
- 4.4. Market Entropy
- 4.5. Patent/Trademark Analysis
- 5. Global Non-Alcoholic Concentrated Syrups Industry Analysis, Insights and Forecast, 2019-2031
- 5.1. Market Analysis, Insights and Forecast - by Type
- 5.1.1. Fruit Squashes
- 5.1.2. Vegetable Squashes
- 5.1.3. Other Types
- 5.2. Market Analysis, Insights and Forecast - by Sales Channel
- 5.2.1. Off-trade
- 5.2.2. On-trade
- 5.3. Market Analysis, Insights and Forecast - by Region
- 5.3.1. North America
- 5.3.2. Europe
- 5.3.3. Asia Pacific
- 5.3.4. Rest of the World
- 5.1. Market Analysis, Insights and Forecast - by Type
- 6. North America Non-Alcoholic Concentrated Syrups Industry Analysis, Insights and Forecast, 2019-2031
- 6.1. Market Analysis, Insights and Forecast - by Type
- 6.1.1. Fruit Squashes
- 6.1.2. Vegetable Squashes
- 6.1.3. Other Types
- 6.2. Market Analysis, Insights and Forecast - by Sales Channel
- 6.2.1. Off-trade
- 6.2.2. On-trade
- 6.1. Market Analysis, Insights and Forecast - by Type
- 7. Europe Non-Alcoholic Concentrated Syrups Industry Analysis, Insights and Forecast, 2019-2031
- 7.1. Market Analysis, Insights and Forecast - by Type
- 7.1.1. Fruit Squashes
- 7.1.2. Vegetable Squashes
- 7.1.3. Other Types
- 7.2. Market Analysis, Insights and Forecast - by Sales Channel
- 7.2.1. Off-trade
- 7.2.2. On-trade
- 7.1. Market Analysis, Insights and Forecast - by Type
- 8. Asia Pacific Non-Alcoholic Concentrated Syrups Industry Analysis, Insights and Forecast, 2019-2031
- 8.1. Market Analysis, Insights and Forecast - by Type
- 8.1.1. Fruit Squashes
- 8.1.2. Vegetable Squashes
- 8.1.3. Other Types
- 8.2. Market Analysis, Insights and Forecast - by Sales Channel
- 8.2.1. Off-trade
- 8.2.2. On-trade
- 8.1. Market Analysis, Insights and Forecast - by Type
- 9. Rest of the World Non-Alcoholic Concentrated Syrups Industry Analysis, Insights and Forecast, 2019-2031
- 9.1. Market Analysis, Insights and Forecast - by Type
- 9.1.1. Fruit Squashes
- 9.1.2. Vegetable Squashes
- 9.1.3. Other Types
- 9.2. Market Analysis, Insights and Forecast - by Sales Channel
- 9.2.1. Off-trade
- 9.2.2. On-trade
- 9.1. Market Analysis, Insights and Forecast - by Type
- 10. North America Non-Alcoholic Concentrated Syrups Industry Analysis, Insights and Forecast, 2019-2031
- 10.1. Market Analysis, Insights and Forecast - By Country/Sub-region
- 10.1.1 United States
- 10.1.2 Canada
- 10.1.3 Mexico
- 11. Europe Non-Alcoholic Concentrated Syrups Industry Analysis, Insights and Forecast, 2019-2031
- 11.1. Market Analysis, Insights and Forecast - By Country/Sub-region
- 11.1.1 Germany
- 11.1.2 United Kingdom
- 11.1.3 France
- 11.1.4 Spain
- 11.1.5 Italy
- 11.1.6 Spain
- 11.1.7 Belgium
- 11.1.8 Netherland
- 11.1.9 Nordics
- 11.1.10 Rest of Europe
- 12. Asia Pacific Non-Alcoholic Concentrated Syrups Industry Analysis, Insights and Forecast, 2019-2031
- 12.1. Market Analysis, Insights and Forecast - By Country/Sub-region
- 12.1.1 China
- 12.1.2 Japan
- 12.1.3 India
- 12.1.4 South Korea
- 12.1.5 Southeast Asia
- 12.1.6 Australia
- 12.1.7 Indonesia
- 12.1.8 Phillipes
- 12.1.9 Singapore
- 12.1.10 Thailandc
- 12.1.11 Rest of Asia Pacific
- 13. South America Non-Alcoholic Concentrated Syrups Industry Analysis, Insights and Forecast, 2019-2031
- 13.1. Market Analysis, Insights and Forecast - By Country/Sub-region
- 13.1.1 Brazil
- 13.1.2 Argentina
- 13.1.3 Peru
- 13.1.4 Chile
- 13.1.5 Colombia
- 13.1.6 Ecuador
- 13.1.7 Venezuela
- 13.1.8 Rest of South America
- 14. North America Non-Alcoholic Concentrated Syrups Industry Analysis, Insights and Forecast, 2019-2031
- 14.1. Market Analysis, Insights and Forecast - By Country/Sub-region
- 14.1.1 United States
- 14.1.2 Canada
- 14.1.3 Mexico
- 15. MEA Non-Alcoholic Concentrated Syrups Industry Analysis, Insights and Forecast, 2019-2031
- 15.1. Market Analysis, Insights and Forecast - By Country/Sub-region
- 15.1.1 United Arab Emirates
- 15.1.2 Saudi Arabia
- 15.1.3 South Africa
- 15.1.4 Rest of Middle East and Africa
- 16. Competitive Analysis
- 16.1. Global Market Share Analysis 2024
- 16.2. Company Profiles
- 16.2.1 Pioma Industries Pvt Ltd (Rasna)
- 16.2.1.1. Overview
- 16.2.1.2. Products
- 16.2.1.3. SWOT Analysis
- 16.2.1.4. Recent Developments
- 16.2.1.5. Financials (Based on Availability)
- 16.2.2 Bickford's Australia Pvt Ltd
- 16.2.2.1. Overview
- 16.2.2.2. Products
- 16.2.2.3. SWOT Analysis
- 16.2.2.4. Recent Developments
- 16.2.2.5. Financials (Based on Availability)
- 16.2.3 Unilever Ltd
- 16.2.3.1. Overview
- 16.2.3.2. Products
- 16.2.3.3. SWOT Analysis
- 16.2.3.4. Recent Developments
- 16.2.3.5. Financials (Based on Availability)
- 16.2.4 Tru Blu Beverages
- 16.2.4.1. Overview
- 16.2.4.2. Products
- 16.2.4.3. SWOT Analysis
- 16.2.4.4. Recent Developments
- 16.2.4.5. Financials (Based on Availability)
- 16.2.5 Suntory Holdings Lt
- 16.2.5.1. Overview
- 16.2.5.2. Products
- 16.2.5.3. SWOT Analysis
- 16.2.5.4. Recent Developments
- 16.2.5.5. Financials (Based on Availability)
- 16.2.6 Britvic PLC
- 16.2.6.1. Overview
- 16.2.6.2. Products
- 16.2.6.3. SWOT Analysis
- 16.2.6.4. Recent Developments
- 16.2.6.5. Financials (Based on Availability)
- 16.2.7 Golden Circle Ltd
- 16.2.7.1. Overview
- 16.2.7.2. Products
- 16.2.7.3. SWOT Analysis
- 16.2.7.4. Recent Developments
- 16.2.7.5. Financials (Based on Availability)
- 16.2.1 Pioma Industries Pvt Ltd (Rasna)
List of Figures
- Figure 1: Global Non-Alcoholic Concentrated Syrups Industry Revenue Breakdown (Million, %) by Region 2024 & 2032
- Figure 2: North America Non-Alcoholic Concentrated Syrups Industry Revenue (Million), by Country 2024 & 2032
- Figure 3: North America Non-Alcoholic Concentrated Syrups Industry Revenue Share (%), by Country 2024 & 2032
- Figure 4: Europe Non-Alcoholic Concentrated Syrups Industry Revenue (Million), by Country 2024 & 2032
- Figure 5: Europe Non-Alcoholic Concentrated Syrups Industry Revenue Share (%), by Country 2024 & 2032
- Figure 6: Asia Pacific Non-Alcoholic Concentrated Syrups Industry Revenue (Million), by Country 2024 & 2032
- Figure 7: Asia Pacific Non-Alcoholic Concentrated Syrups Industry Revenue Share (%), by Country 2024 & 2032
- Figure 8: South America Non-Alcoholic Concentrated Syrups Industry Revenue (Million), by Country 2024 & 2032
- Figure 9: South America Non-Alcoholic Concentrated Syrups Industry Revenue Share (%), by Country 2024 & 2032
- Figure 10: North America Non-Alcoholic Concentrated Syrups Industry Revenue (Million), by Country 2024 & 2032
- Figure 11: North America Non-Alcoholic Concentrated Syrups Industry Revenue Share (%), by Country 2024 & 2032
- Figure 12: MEA Non-Alcoholic Concentrated Syrups Industry Revenue (Million), by Country 2024 & 2032
- Figure 13: MEA Non-Alcoholic Concentrated Syrups Industry Revenue Share (%), by Country 2024 & 2032
- Figure 14: North America Non-Alcoholic Concentrated Syrups Industry Revenue (Million), by Type 2024 & 2032
- Figure 15: North America Non-Alcoholic Concentrated Syrups Industry Revenue Share (%), by Type 2024 & 2032
- Figure 16: North America Non-Alcoholic Concentrated Syrups Industry Revenue (Million), by Sales Channel 2024 & 2032
- Figure 17: North America Non-Alcoholic Concentrated Syrups Industry Revenue Share (%), by Sales Channel 2024 & 2032
- Figure 18: North America Non-Alcoholic Concentrated Syrups Industry Revenue (Million), by Country 2024 & 2032
- Figure 19: North America Non-Alcoholic Concentrated Syrups Industry Revenue Share (%), by Country 2024 & 2032
- Figure 20: Europe Non-Alcoholic Concentrated Syrups Industry Revenue (Million), by Type 2024 & 2032
- Figure 21: Europe Non-Alcoholic Concentrated Syrups Industry Revenue Share (%), by Type 2024 & 2032
- Figure 22: Europe Non-Alcoholic Concentrated Syrups Industry Revenue (Million), by Sales Channel 2024 & 2032
- Figure 23: Europe Non-Alcoholic Concentrated Syrups Industry Revenue Share (%), by Sales Channel 2024 & 2032
- Figure 24: Europe Non-Alcoholic Concentrated Syrups Industry Revenue (Million), by Country 2024 & 2032
- Figure 25: Europe Non-Alcoholic Concentrated Syrups Industry Revenue Share (%), by Country 2024 & 2032
- Figure 26: Asia Pacific Non-Alcoholic Concentrated Syrups Industry Revenue (Million), by Type 2024 & 2032
- Figure 27: Asia Pacific Non-Alcoholic Concentrated Syrups Industry Revenue Share (%), by Type 2024 & 2032
- Figure 28: Asia Pacific Non-Alcoholic Concentrated Syrups Industry Revenue (Million), by Sales Channel 2024 & 2032
- Figure 29: Asia Pacific Non-Alcoholic Concentrated Syrups Industry Revenue Share (%), by Sales Channel 2024 & 2032
- Figure 30: Asia Pacific Non-Alcoholic Concentrated Syrups Industry Revenue (Million), by Country 2024 & 2032
- Figure 31: Asia Pacific Non-Alcoholic Concentrated Syrups Industry Revenue Share (%), by Country 2024 & 2032
- Figure 32: Rest of the World Non-Alcoholic Concentrated Syrups Industry Revenue (Million), by Type 2024 & 2032
- Figure 33: Rest of the World Non-Alcoholic Concentrated Syrups Industry Revenue Share (%), by Type 2024 & 2032
- Figure 34: Rest of the World Non-Alcoholic Concentrated Syrups Industry Revenue (Million), by Sales Channel 2024 & 2032
- Figure 35: Rest of the World Non-Alcoholic Concentrated Syrups Industry Revenue Share (%), by Sales Channel 2024 & 2032
- Figure 36: Rest of the World Non-Alcoholic Concentrated Syrups Industry Revenue (Million), by Country 2024 & 2032
- Figure 37: Rest of the World Non-Alcoholic Concentrated Syrups Industry Revenue Share (%), by Country 2024 & 2032
List of Tables
- Table 1: Global Non-Alcoholic Concentrated Syrups Industry Revenue Million Forecast, by Region 2019 & 2032
- Table 2: Global Non-Alcoholic Concentrated Syrups Industry Revenue Million Forecast, by Type 2019 & 2032
- Table 3: Global Non-Alcoholic Concentrated Syrups Industry Revenue Million Forecast, by Sales Channel 2019 & 2032
- Table 4: Global Non-Alcoholic Concentrated Syrups Industry Revenue Million Forecast, by Region 2019 & 2032
- Table 5: Global Non-Alcoholic Concentrated Syrups Industry Revenue Million Forecast, by Country 2019 & 2032
- Table 6: United States Non-Alcoholic Concentrated Syrups Industry Revenue (Million) Forecast, by Application 2019 & 2032
- Table 7: Canada Non-Alcoholic Concentrated Syrups Industry Revenue (Million) Forecast, by Application 2019 & 2032
- Table 8: Mexico Non-Alcoholic Concentrated Syrups Industry Revenue (Million) Forecast, by Application 2019 & 2032
- Table 9: Global Non-Alcoholic Concentrated Syrups Industry Revenue Million Forecast, by Country 2019 & 2032
- Table 10: Germany Non-Alcoholic Concentrated Syrups Industry Revenue (Million) Forecast, by Application 2019 & 2032
- Table 11: United Kingdom Non-Alcoholic Concentrated Syrups Industry Revenue (Million) Forecast, by Application 2019 & 2032
- Table 12: France Non-Alcoholic Concentrated Syrups Industry Revenue (Million) Forecast, by Application 2019 & 2032
- Table 13: Spain Non-Alcoholic Concentrated Syrups Industry Revenue (Million) Forecast, by Application 2019 & 2032
- Table 14: Italy Non-Alcoholic Concentrated Syrups Industry Revenue (Million) Forecast, by Application 2019 & 2032
- Table 15: Spain Non-Alcoholic Concentrated Syrups Industry Revenue (Million) Forecast, by Application 2019 & 2032
- Table 16: Belgium Non-Alcoholic Concentrated Syrups Industry Revenue (Million) Forecast, by Application 2019 & 2032
- Table 17: Netherland Non-Alcoholic Concentrated Syrups Industry Revenue (Million) Forecast, by Application 2019 & 2032
- Table 18: Nordics Non-Alcoholic Concentrated Syrups Industry Revenue (Million) Forecast, by Application 2019 & 2032
- Table 19: Rest of Europe Non-Alcoholic Concentrated Syrups Industry Revenue (Million) Forecast, by Application 2019 & 2032
- Table 20: Global Non-Alcoholic Concentrated Syrups Industry Revenue Million Forecast, by Country 2019 & 2032
- Table 21: China Non-Alcoholic Concentrated Syrups Industry Revenue (Million) Forecast, by Application 2019 & 2032
- Table 22: Japan Non-Alcoholic Concentrated Syrups Industry Revenue (Million) Forecast, by Application 2019 & 2032
- Table 23: India Non-Alcoholic Concentrated Syrups Industry Revenue (Million) Forecast, by Application 2019 & 2032
- Table 24: South Korea Non-Alcoholic Concentrated Syrups Industry Revenue (Million) Forecast, by Application 2019 & 2032
- Table 25: Southeast Asia Non-Alcoholic Concentrated Syrups Industry Revenue (Million) Forecast, by Application 2019 & 2032
- Table 26: Australia Non-Alcoholic Concentrated Syrups Industry Revenue (Million) Forecast, by Application 2019 & 2032
- Table 27: Indonesia Non-Alcoholic Concentrated Syrups Industry Revenue (Million) Forecast, by Application 2019 & 2032
- Table 28: Phillipes Non-Alcoholic Concentrated Syrups Industry Revenue (Million) Forecast, by Application 2019 & 2032
- Table 29: Singapore Non-Alcoholic Concentrated Syrups Industry Revenue (Million) Forecast, by Application 2019 & 2032
- Table 30: Thailandc Non-Alcoholic Concentrated Syrups Industry Revenue (Million) Forecast, by Application 2019 & 2032
- Table 31: Rest of Asia Pacific Non-Alcoholic Concentrated Syrups Industry Revenue (Million) Forecast, by Application 2019 & 2032
- Table 32: Global Non-Alcoholic Concentrated Syrups Industry Revenue Million Forecast, by Country 2019 & 2032
- Table 33: Brazil Non-Alcoholic Concentrated Syrups Industry Revenue (Million) Forecast, by Application 2019 & 2032
- Table 34: Argentina Non-Alcoholic Concentrated Syrups Industry Revenue (Million) Forecast, by Application 2019 & 2032
- Table 35: Peru Non-Alcoholic Concentrated Syrups Industry Revenue (Million) Forecast, by Application 2019 & 2032
- Table 36: Chile Non-Alcoholic Concentrated Syrups Industry Revenue (Million) Forecast, by Application 2019 & 2032
- Table 37: Colombia Non-Alcoholic Concentrated Syrups Industry Revenue (Million) Forecast, by Application 2019 & 2032
- Table 38: Ecuador Non-Alcoholic Concentrated Syrups Industry Revenue (Million) Forecast, by Application 2019 & 2032
- Table 39: Venezuela Non-Alcoholic Concentrated Syrups Industry Revenue (Million) Forecast, by Application 2019 & 2032
- Table 40: Rest of South America Non-Alcoholic Concentrated Syrups Industry Revenue (Million) Forecast, by Application 2019 & 2032
- Table 41: Global Non-Alcoholic Concentrated Syrups Industry Revenue Million Forecast, by Country 2019 & 2032
- Table 42: United States Non-Alcoholic Concentrated Syrups Industry Revenue (Million) Forecast, by Application 2019 & 2032
- Table 43: Canada Non-Alcoholic Concentrated Syrups Industry Revenue (Million) Forecast, by Application 2019 & 2032
- Table 44: Mexico Non-Alcoholic Concentrated Syrups Industry Revenue (Million) Forecast, by Application 2019 & 2032
- Table 45: Global Non-Alcoholic Concentrated Syrups Industry Revenue Million Forecast, by Country 2019 & 2032
- Table 46: United Arab Emirates Non-Alcoholic Concentrated Syrups Industry Revenue (Million) Forecast, by Application 2019 & 2032
- Table 47: Saudi Arabia Non-Alcoholic Concentrated Syrups Industry Revenue (Million) Forecast, by Application 2019 & 2032
- Table 48: South Africa Non-Alcoholic Concentrated Syrups Industry Revenue (Million) Forecast, by Application 2019 & 2032
- Table 49: Rest of Middle East and Africa Non-Alcoholic Concentrated Syrups Industry Revenue (Million) Forecast, by Application 2019 & 2032
- Table 50: Global Non-Alcoholic Concentrated Syrups Industry Revenue Million Forecast, by Type 2019 & 2032
- Table 51: Global Non-Alcoholic Concentrated Syrups Industry Revenue Million Forecast, by Sales Channel 2019 & 2032
- Table 52: Global Non-Alcoholic Concentrated Syrups Industry Revenue Million Forecast, by Country 2019 & 2032
- Table 53: United States Non-Alcoholic Concentrated Syrups Industry Revenue (Million) Forecast, by Application 2019 & 2032
- Table 54: Canada Non-Alcoholic Concentrated Syrups Industry Revenue (Million) Forecast, by Application 2019 & 2032
- Table 55: Mexico Non-Alcoholic Concentrated Syrups Industry Revenue (Million) Forecast, by Application 2019 & 2032
- Table 56: Rest of North America Non-Alcoholic Concentrated Syrups Industry Revenue (Million) Forecast, by Application 2019 & 2032
- Table 57: Global Non-Alcoholic Concentrated Syrups Industry Revenue Million Forecast, by Type 2019 & 2032
- Table 58: Global Non-Alcoholic Concentrated Syrups Industry Revenue Million Forecast, by Sales Channel 2019 & 2032
- Table 59: Global Non-Alcoholic Concentrated Syrups Industry Revenue Million Forecast, by Country 2019 & 2032
- Table 60: Spain Non-Alcoholic Concentrated Syrups Industry Revenue (Million) Forecast, by Application 2019 & 2032
- Table 61: United Kingdom Non-Alcoholic Concentrated Syrups Industry Revenue (Million) Forecast, by Application 2019 & 2032
- Table 62: Germany Non-Alcoholic Concentrated Syrups Industry Revenue (Million) Forecast, by Application 2019 & 2032
- Table 63: France Non-Alcoholic Concentrated Syrups Industry Revenue (Million) Forecast, by Application 2019 & 2032
- Table 64: Italy Non-Alcoholic Concentrated Syrups Industry Revenue (Million) Forecast, by Application 2019 & 2032
- Table 65: Russia Non-Alcoholic Concentrated Syrups Industry Revenue (Million) Forecast, by Application 2019 & 2032
- Table 66: Rest of Europe Non-Alcoholic Concentrated Syrups Industry Revenue (Million) Forecast, by Application 2019 & 2032
- Table 67: Global Non-Alcoholic Concentrated Syrups Industry Revenue Million Forecast, by Type 2019 & 2032
- Table 68: Global Non-Alcoholic Concentrated Syrups Industry Revenue Million Forecast, by Sales Channel 2019 & 2032
- Table 69: Global Non-Alcoholic Concentrated Syrups Industry Revenue Million Forecast, by Country 2019 & 2032
- Table 70: China Non-Alcoholic Concentrated Syrups Industry Revenue (Million) Forecast, by Application 2019 & 2032
- Table 71: Japan Non-Alcoholic Concentrated Syrups Industry Revenue (Million) Forecast, by Application 2019 & 2032
- Table 72: India Non-Alcoholic Concentrated Syrups Industry Revenue (Million) Forecast, by Application 2019 & 2032
- Table 73: Australia Non-Alcoholic Concentrated Syrups Industry Revenue (Million) Forecast, by Application 2019 & 2032
- Table 74: Rest of Asia Pacific Non-Alcoholic Concentrated Syrups Industry Revenue (Million) Forecast, by Application 2019 & 2032
- Table 75: Global Non-Alcoholic Concentrated Syrups Industry Revenue Million Forecast, by Type 2019 & 2032
- Table 76: Global Non-Alcoholic Concentrated Syrups Industry Revenue Million Forecast, by Sales Channel 2019 & 2032
- Table 77: Global Non-Alcoholic Concentrated Syrups Industry Revenue Million Forecast, by Country 2019 & 2032
- Table 78: South America Non-Alcoholic Concentrated Syrups Industry Revenue (Million) Forecast, by Application 2019 & 2032
- Table 79: Middle East Non-Alcoholic Concentrated Syrups Industry Revenue (Million) Forecast, by Application 2019 & 2032
Frequently Asked Questions
1. What is the projected Compound Annual Growth Rate (CAGR) of the Non-Alcoholic Concentrated Syrups Industry?
The projected CAGR is approximately 5.80%.
2. Which companies are prominent players in the Non-Alcoholic Concentrated Syrups Industry?
Key companies in the market include Pioma Industries Pvt Ltd (Rasna), Bickford's Australia Pvt Ltd, Unilever Ltd, Tru Blu Beverages, Suntory Holdings Lt, Britvic PLC, Golden Circle Ltd.
3. What are the main segments of the Non-Alcoholic Concentrated Syrups Industry?
The market segments include Type, Sales Channel.
4. Can you provide details about the market size?
The market size is estimated to be USD XX Million as of 2022.
5. What are some drivers contributing to market growth?
The ease of use and long shelf life of concentrated syrups make them popular for both commercial use and at-home preparation of beverages..
6. What are the notable trends driving market growth?
Increasing interest in syrups made with natural ingredients. reduced sugar content. and organic certifications to cater to health-conscious consumers.
7. Are there any restraints impacting market growth?
Some consumers may be wary of concentrated syrups due to concerns about high sugar content and artificial ingredients. which can affect market growth.
8. Can you provide examples of recent developments in the market?
N/A
9. What pricing options are available for accessing the report?
Pricing options include single-user, multi-user, and enterprise licenses priced at USD 4750, USD 5250, and USD 8750 respectively.
10. Is the market size provided in terms of value or volume?
The market size is provided in terms of value, measured in Million.
11. Are there any specific market keywords associated with the report?
Yes, the market keyword associated with the report is "Non-Alcoholic Concentrated Syrups Industry," which aids in identifying and referencing the specific market segment covered.
12. How do I determine which pricing option suits my needs best?
The pricing options vary based on user requirements and access needs. Individual users may opt for single-user licenses, while businesses requiring broader access may choose multi-user or enterprise licenses for cost-effective access to the report.
13. Are there any additional resources or data provided in the Non-Alcoholic Concentrated Syrups Industry report?
While the report offers comprehensive insights, it's advisable to review the specific contents or supplementary materials provided to ascertain if additional resources or data are available.
14. How can I stay updated on further developments or reports in the Non-Alcoholic Concentrated Syrups Industry?
To stay informed about further developments, trends, and reports in the Non-Alcoholic Concentrated Syrups Industry, consider subscribing to industry newsletters, following relevant companies and organizations, or regularly checking reputable industry news sources and publications.
Methodology
Step 1 - Identification of Relevant Samples Size from Population Database


Step 2 - Approaches for Defining Global Market Size (Value, Volume* & Price*)

Note*: In applicable scenarios
Step 3 - Data Sources
Primary Research
- Web Analytics
- Survey Reports
- Research Institute
- Latest Research Reports
- Opinion Leaders
Secondary Research
- Annual Reports
- White Paper
- Latest Press Release
- Industry Association
- Paid Database
- Investor Presentations

Step 4 - Data Triangulation
Involves using different sources of information in order to increase the validity of a study
These sources are likely to be stakeholders in a program - participants, other researchers, program staff, other community members, and so on.
Then we put all data in single framework & apply various statistical tools to find out the dynamic on the market.
During the analysis stage, feedback from the stakeholder groups would be compared to determine areas of agreement as well as areas of divergence
