

Key Insights
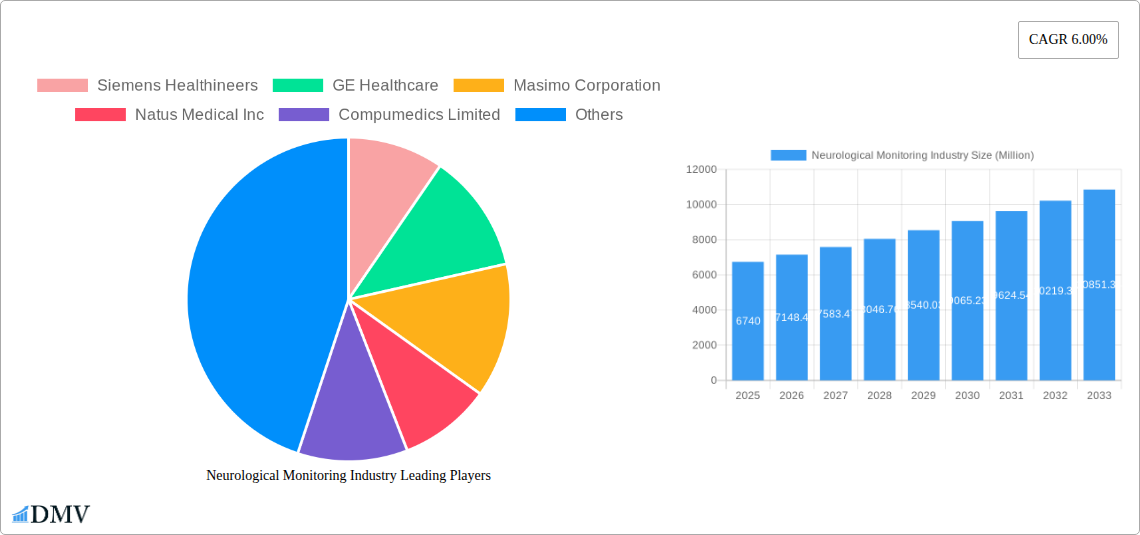
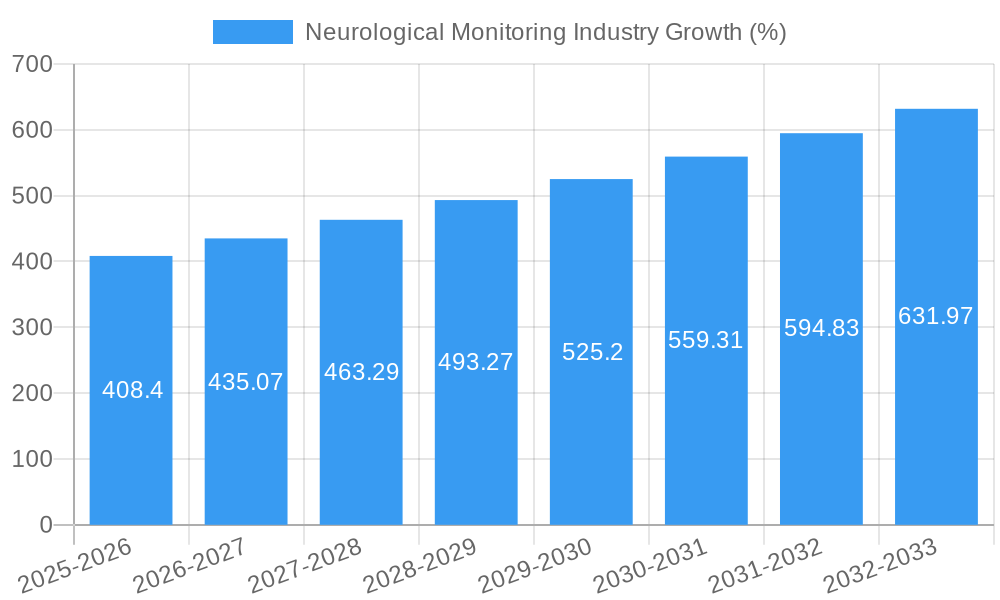
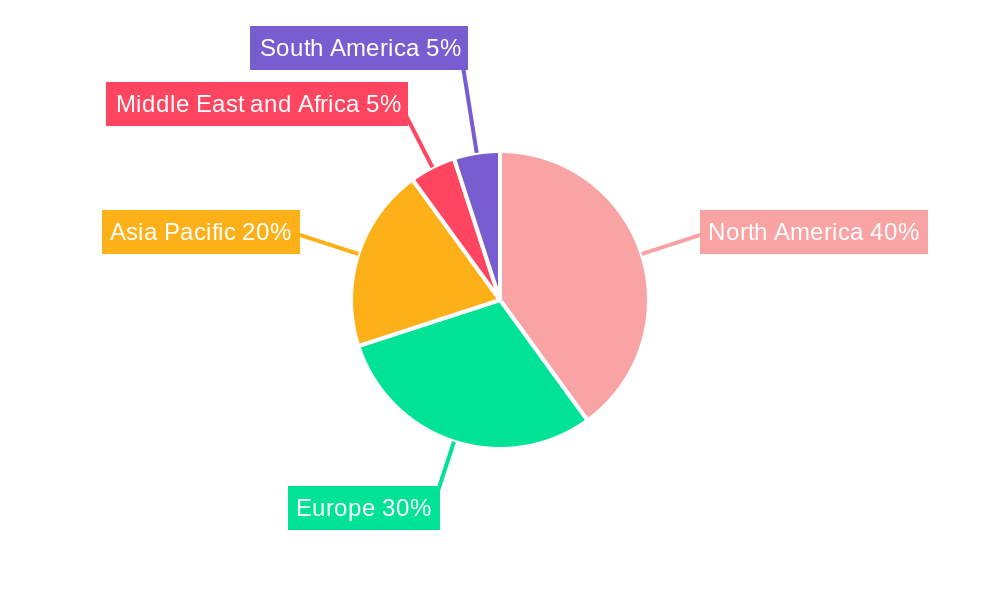
The neurological monitoring market, valued at $6.74 billion in 2025, is projected to experience robust growth, driven by a rising prevalence of neurological disorders like stroke and traumatic brain injury (TBI), an aging global population increasing susceptibility to these conditions, and technological advancements leading to more sophisticated and portable monitoring devices. The market's Compound Annual Growth Rate (CAGR) of 6.00% from 2025 to 2033 indicates a significant expansion over the forecast period. Key growth drivers include the increasing adoption of minimally invasive procedures, the rising demand for improved patient outcomes, and the growing focus on early diagnosis and treatment of neurological conditions. Furthermore, the development of advanced neuro-monitoring technologies such as wireless and wearable devices is expected to fuel market expansion. The market is segmented by product type (MRI, EEG devices, cerebral oximeters, intracranial pressure monitors, and others) and disease type (TBI, stroke, sleep disorders, Parkinson's disease, epilepsy, and others). North America currently holds a substantial market share due to advanced healthcare infrastructure and high adoption rates of sophisticated technologies. However, Asia Pacific is anticipated to exhibit significant growth in the coming years, driven by rising healthcare expenditure and increasing awareness of neurological disorders.
While the market faces restraints such as high costs associated with advanced monitoring equipment and the need for skilled professionals to operate and interpret the data, these challenges are being addressed by technological innovations, such as the development of user-friendly interfaces and cost-effective solutions. The competitive landscape is characterized by the presence of major players like Siemens Healthineers, GE Healthcare, and Masimo Corporation, along with several smaller, specialized companies. These companies are investing heavily in research and development to enhance product features, improve accuracy and reliability, and expand their product portfolios to cater to the evolving needs of the market. The ongoing focus on improving patient care and the development of innovative technologies positions the neurological monitoring market for continued strong growth throughout the forecast period.
Neurological Monitoring Industry Market Report: 2019-2033
This comprehensive report provides an in-depth analysis of the Neurological Monitoring industry, projecting a market value of $XX Million by 2033. It covers market trends, leading players, technological advancements, and future opportunities across various segments and geographies. The study period spans 2019-2033, with a base year of 2025 and a forecast period of 2025-2033. This report is invaluable for stakeholders seeking to understand and capitalize on the growth potential within this dynamic sector.
Neurological Monitoring Industry Market Composition & Trends
The Neurological Monitoring market, valued at $XX Million in 2025, is characterized by a moderately concentrated landscape with key players such as Siemens Healthineers, GE Healthcare, and Masimo Corporation holding significant market share. The market's growth is driven by several factors: increasing prevalence of neurological disorders, advancements in monitoring technologies, and rising healthcare expenditure. Regulatory approvals and stringent safety standards influence market dynamics, while the emergence of substitute products and alternative therapies presents ongoing challenges. Significant M&A activity, with deal values exceeding $XX Million in recent years, reflects the industry's consolidation and expansion efforts.
- Market Share Distribution: Siemens Healthineers (XX%), GE Healthcare (XX%), Masimo Corporation (XX%), Others (XX%).
- Innovation Catalysts: Development of AI-powered diagnostic tools and minimally invasive monitoring devices.
- Regulatory Landscape: Stringent regulatory approvals (e.g., FDA, CE marking) impacting product launches and market entry.
- Substitute Products: Non-invasive imaging techniques and alternative diagnostic methods pose competitive threats.
- End-User Profiles: Hospitals, clinics, research institutions, and ambulatory surgical centers.
- M&A Activity: XX number of deals with a total value exceeding $XX Million in the past five years.
Neurological Monitoring Industry Industry Evolution
The Neurological Monitoring industry has witnessed substantial growth over the historical period (2019-2024), with a Compound Annual Growth Rate (CAGR) of XX%. This growth is attributed to several factors, including an aging global population, increasing prevalence of neurological diseases like stroke and TBI, and technological advancements leading to more accurate and efficient monitoring devices. The market is shifting towards non-invasive and portable monitoring solutions, driven by patient preference and cost-effectiveness. Adoption of advanced technologies, such as AI and cloud computing, is accelerating, enabling remote patient monitoring and improved diagnostic capabilities. Consumer demand is evolving towards personalized and integrated healthcare solutions, prompting manufacturers to develop comprehensive monitoring platforms and data analytics tools.
Leading Regions, Countries, or Segments in Neurological Monitoring Industry
The North American region currently dominates the Neurological Monitoring market, driven by high healthcare expenditure, advanced medical infrastructure, and a large patient pool. Within product types, Electroencephalography (EEG) devices and Intracranial Pressure (ICP) monitors hold significant market share due to their widespread application in critical care settings. By disease type, Traumatic Brain Injury (TBI) and stroke are major drivers, due to their high prevalence and significant need for continuous monitoring.
- Key Drivers (North America):
- High healthcare expenditure and insurance coverage.
- Advanced medical infrastructure and technological adoption.
- Strong regulatory support and research funding.
- Key Drivers (EEG Devices):
- Wide applicability across various neurological conditions.
- Continuous technological improvements enhancing accuracy and ease of use.
- Key Drivers (TBI & Stroke):
- High prevalence of these conditions globally.
- Critical need for continuous monitoring to improve patient outcomes.
Neurological Monitoring Industry Product Innovations
Recent innovations in neurological monitoring focus on miniaturization, wireless connectivity, and improved data analytics capabilities. For instance, new EEG devices offer higher resolution and portability, while advanced ICP monitors incorporate real-time data processing and predictive algorithms. These innovations enhance diagnostic accuracy, improve patient comfort, and facilitate remote monitoring capabilities, creating unique selling propositions within a competitive market. The integration of AI and machine learning further optimizes data interpretation, leading to faster and more accurate diagnoses.
Propelling Factors for Neurological Monitoring Industry Growth
The Neurological Monitoring market is poised for continued growth fueled by several key factors. Technological advancements, particularly in AI and miniaturization, are enhancing diagnostic accuracy and improving patient outcomes. The rising prevalence of neurological disorders, driven by an aging population and changing lifestyles, significantly contributes to increased demand. Government initiatives promoting healthcare infrastructure development and reimbursement policies further accelerate market growth.
Obstacles in the Neurological Monitoring Industry Market
Despite its growth potential, the Neurological Monitoring market faces several challenges. Stringent regulatory approvals for new devices create a barrier to market entry. Supply chain disruptions, particularly related to critical components, can affect production and availability. Intense competition among established players and emerging companies creates pricing pressure. The high cost of advanced monitoring technologies can limit accessibility, particularly in resource-constrained settings.
Future Opportunities in Neurological Monitoring Industry
The future of the Neurological Monitoring market presents several promising opportunities. The expansion into emerging markets with growing healthcare infrastructure represents significant potential for growth. The development of non-invasive and wearable monitoring solutions caters to the increasing demand for convenient and patient-friendly technologies. Integration with telemedicine platforms and the application of AI-powered diagnostic tools will revolutionize patient care and create new business models.
Major Players in the Neurological Monitoring Industry Ecosystem
- Siemens Healthineers
- GE Healthcare
- Masimo Corporation
- Natus Medical Inc
- Compumedics Limited
- Dragerwerk Ag & Co KGaA
- Philips Healthcare
- Medtronic PLC
- Advanced Brain Monitoring Inc
- Nihon Kohden Corporation
Key Developments in Neurological Monitoring Industry Industry
- March 2022: Braintale launched the brainTale-care platform, including brainQuant (white matter quantification) and brainScore-coma (coma recovery prediction). This launch signifies a move towards AI-driven diagnostic tools.
- February 2023: The SafeICP project, funded by the Spanish Research Agency and European Next Generation funds, is developing a low-cost, bedside intracranial pressure monitor. This development highlights efforts to improve accessibility and affordability.
Strategic Neurological Monitoring Industry Market Forecast
The Neurological Monitoring market is projected to experience robust growth over the forecast period (2025-2033), driven by continuous technological advancements, rising healthcare spending, and a growing prevalence of neurological disorders. The increasing adoption of AI and remote monitoring solutions will further propel market expansion. New product launches and strategic partnerships will reshape the competitive landscape, creating opportunities for both established players and emerging companies.
Neurological Monitoring Industry Segmentation
-
1. Product Type
- 1.1. Magnetic Resonance Imaging (MRI) Devices
- 1.2. Electroencephalography devices
- 1.3. Cerebral Oximeters
- 1.4. Intracranial Pressure Monitors
- 1.5. Other Product Types
-
2. Disease Type
- 2.1. Traumatic Brain Injury (TBI)
- 2.2. Stroke
- 2.3. Sleep Disorders
- 2.4. Parkinson's Disease
- 2.5. Epilepsy
- 2.6. Other Disease Types
Neurological Monitoring Industry Segmentation By Geography
-
1. North America
- 1.1. United States
- 1.2. Canada
- 1.3. Mexico
-
2. Europe
- 2.1. Germany
- 2.2. United Kingdom
- 2.3. France
- 2.4. Italy
- 2.5. Spain
- 2.6. Rest of Europe
-
3. Asia Pacific
- 3.1. China
- 3.2. Japan
- 3.3. India
- 3.4. Australia
- 3.5. South Korea
- 3.6. Rest of Asia Pacific
-
4. Middle East and Africa
- 4.1. GCC
- 4.2. South Africa
- 4.3. Rest of Middle East and Africa
-
5. South America
- 5.1. Brazil
- 5.2. Argentina
- 5.3. Rest of South America
Neurological Monitoring Industry REPORT HIGHLIGHTS
| Aspects | Details |
|---|---|
| Study Period | 2019-2033 |
| Base Year | 2024 |
| Estimated Year | 2025 |
| Forecast Period | 2025-2033 |
| Historical Period | 2019-2024 |
| Growth Rate | CAGR of 6.00% from 2019-2033 |
| Segmentation |
|
Table of Contents
- 1. Introduction
- 1.1. Research Scope
- 1.2. Market Segmentation
- 1.3. Research Methodology
- 1.4. Definitions and Assumptions
- 2. Executive Summary
- 2.1. Introduction
- 3. Market Dynamics
- 3.1. Introduction
- 3.2. Market Drivers
- 3.2.1. Increasing Burden of Neurological Disorders; Growing Incidence of Traumatic Brain Injuries; Increasing Number of Product Approvals
- 3.3. Market Restrains
- 3.3.1. High Cost of Monitoring Devices; Shortage of Trained Professionals
- 3.4. Market Trends
- 3.4.1. Sleep Disorder is Expected to Witness Strong Growth Over the Forecast Period
- 4. Market Factor Analysis
- 4.1. Porters Five Forces
- 4.2. Supply/Value Chain
- 4.3. PESTEL analysis
- 4.4. Market Entropy
- 4.5. Patent/Trademark Analysis
- 5. Global Neurological Monitoring Industry Analysis, Insights and Forecast, 2019-2031
- 5.1. Market Analysis, Insights and Forecast - by Product Type
- 5.1.1. Magnetic Resonance Imaging (MRI) Devices
- 5.1.2. Electroencephalography devices
- 5.1.3. Cerebral Oximeters
- 5.1.4. Intracranial Pressure Monitors
- 5.1.5. Other Product Types
- 5.2. Market Analysis, Insights and Forecast - by Disease Type
- 5.2.1. Traumatic Brain Injury (TBI)
- 5.2.2. Stroke
- 5.2.3. Sleep Disorders
- 5.2.4. Parkinson's Disease
- 5.2.5. Epilepsy
- 5.2.6. Other Disease Types
- 5.3. Market Analysis, Insights and Forecast - by Region
- 5.3.1. North America
- 5.3.2. Europe
- 5.3.3. Asia Pacific
- 5.3.4. Middle East and Africa
- 5.3.5. South America
- 5.1. Market Analysis, Insights and Forecast - by Product Type
- 6. North America Neurological Monitoring Industry Analysis, Insights and Forecast, 2019-2031
- 6.1. Market Analysis, Insights and Forecast - by Product Type
- 6.1.1. Magnetic Resonance Imaging (MRI) Devices
- 6.1.2. Electroencephalography devices
- 6.1.3. Cerebral Oximeters
- 6.1.4. Intracranial Pressure Monitors
- 6.1.5. Other Product Types
- 6.2. Market Analysis, Insights and Forecast - by Disease Type
- 6.2.1. Traumatic Brain Injury (TBI)
- 6.2.2. Stroke
- 6.2.3. Sleep Disorders
- 6.2.4. Parkinson's Disease
- 6.2.5. Epilepsy
- 6.2.6. Other Disease Types
- 6.1. Market Analysis, Insights and Forecast - by Product Type
- 7. Europe Neurological Monitoring Industry Analysis, Insights and Forecast, 2019-2031
- 7.1. Market Analysis, Insights and Forecast - by Product Type
- 7.1.1. Magnetic Resonance Imaging (MRI) Devices
- 7.1.2. Electroencephalography devices
- 7.1.3. Cerebral Oximeters
- 7.1.4. Intracranial Pressure Monitors
- 7.1.5. Other Product Types
- 7.2. Market Analysis, Insights and Forecast - by Disease Type
- 7.2.1. Traumatic Brain Injury (TBI)
- 7.2.2. Stroke
- 7.2.3. Sleep Disorders
- 7.2.4. Parkinson's Disease
- 7.2.5. Epilepsy
- 7.2.6. Other Disease Types
- 7.1. Market Analysis, Insights and Forecast - by Product Type
- 8. Asia Pacific Neurological Monitoring Industry Analysis, Insights and Forecast, 2019-2031
- 8.1. Market Analysis, Insights and Forecast - by Product Type
- 8.1.1. Magnetic Resonance Imaging (MRI) Devices
- 8.1.2. Electroencephalography devices
- 8.1.3. Cerebral Oximeters
- 8.1.4. Intracranial Pressure Monitors
- 8.1.5. Other Product Types
- 8.2. Market Analysis, Insights and Forecast - by Disease Type
- 8.2.1. Traumatic Brain Injury (TBI)
- 8.2.2. Stroke
- 8.2.3. Sleep Disorders
- 8.2.4. Parkinson's Disease
- 8.2.5. Epilepsy
- 8.2.6. Other Disease Types
- 8.1. Market Analysis, Insights and Forecast - by Product Type
- 9. Middle East and Africa Neurological Monitoring Industry Analysis, Insights and Forecast, 2019-2031
- 9.1. Market Analysis, Insights and Forecast - by Product Type
- 9.1.1. Magnetic Resonance Imaging (MRI) Devices
- 9.1.2. Electroencephalography devices
- 9.1.3. Cerebral Oximeters
- 9.1.4. Intracranial Pressure Monitors
- 9.1.5. Other Product Types
- 9.2. Market Analysis, Insights and Forecast - by Disease Type
- 9.2.1. Traumatic Brain Injury (TBI)
- 9.2.2. Stroke
- 9.2.3. Sleep Disorders
- 9.2.4. Parkinson's Disease
- 9.2.5. Epilepsy
- 9.2.6. Other Disease Types
- 9.1. Market Analysis, Insights and Forecast - by Product Type
- 10. South America Neurological Monitoring Industry Analysis, Insights and Forecast, 2019-2031
- 10.1. Market Analysis, Insights and Forecast - by Product Type
- 10.1.1. Magnetic Resonance Imaging (MRI) Devices
- 10.1.2. Electroencephalography devices
- 10.1.3. Cerebral Oximeters
- 10.1.4. Intracranial Pressure Monitors
- 10.1.5. Other Product Types
- 10.2. Market Analysis, Insights and Forecast - by Disease Type
- 10.2.1. Traumatic Brain Injury (TBI)
- 10.2.2. Stroke
- 10.2.3. Sleep Disorders
- 10.2.4. Parkinson's Disease
- 10.2.5. Epilepsy
- 10.2.6. Other Disease Types
- 10.1. Market Analysis, Insights and Forecast - by Product Type
- 11. North America Neurological Monitoring Industry Analysis, Insights and Forecast, 2019-2031
- 11.1. Market Analysis, Insights and Forecast - By Country/Sub-region
- 11.1.1 United States
- 11.1.2 Canada
- 11.1.3 Mexico
- 12. Europe Neurological Monitoring Industry Analysis, Insights and Forecast, 2019-2031
- 12.1. Market Analysis, Insights and Forecast - By Country/Sub-region
- 12.1.1 Germany
- 12.1.2 United Kingdom
- 12.1.3 France
- 12.1.4 Italy
- 12.1.5 Spain
- 12.1.6 Rest of Europe
- 13. Asia Pacific Neurological Monitoring Industry Analysis, Insights and Forecast, 2019-2031
- 13.1. Market Analysis, Insights and Forecast - By Country/Sub-region
- 13.1.1 China
- 13.1.2 Japan
- 13.1.3 India
- 13.1.4 Australia
- 13.1.5 South Korea
- 13.1.6 Rest of Asia Pacific
- 14. Middle East and Africa Neurological Monitoring Industry Analysis, Insights and Forecast, 2019-2031
- 14.1. Market Analysis, Insights and Forecast - By Country/Sub-region
- 14.1.1 GCC
- 14.1.2 South Africa
- 14.1.3 Rest of Middle East and Africa
- 15. South America Neurological Monitoring Industry Analysis, Insights and Forecast, 2019-2031
- 15.1. Market Analysis, Insights and Forecast - By Country/Sub-region
- 15.1.1 Brazil
- 15.1.2 Argentina
- 15.1.3 Rest of South America
- 16. Competitive Analysis
- 16.1. Global Market Share Analysis 2024
- 16.2. Company Profiles
- 16.2.1 Siemens Healthineers
- 16.2.1.1. Overview
- 16.2.1.2. Products
- 16.2.1.3. SWOT Analysis
- 16.2.1.4. Recent Developments
- 16.2.1.5. Financials (Based on Availability)
- 16.2.2 GE Healthcare
- 16.2.2.1. Overview
- 16.2.2.2. Products
- 16.2.2.3. SWOT Analysis
- 16.2.2.4. Recent Developments
- 16.2.2.5. Financials (Based on Availability)
- 16.2.3 Masimo Corporation
- 16.2.3.1. Overview
- 16.2.3.2. Products
- 16.2.3.3. SWOT Analysis
- 16.2.3.4. Recent Developments
- 16.2.3.5. Financials (Based on Availability)
- 16.2.4 Natus Medical Inc
- 16.2.4.1. Overview
- 16.2.4.2. Products
- 16.2.4.3. SWOT Analysis
- 16.2.4.4. Recent Developments
- 16.2.4.5. Financials (Based on Availability)
- 16.2.5 Compumedics Limited
- 16.2.5.1. Overview
- 16.2.5.2. Products
- 16.2.5.3. SWOT Analysis
- 16.2.5.4. Recent Developments
- 16.2.5.5. Financials (Based on Availability)
- 16.2.6 Dragerwerk Ag & Co KGaA
- 16.2.6.1. Overview
- 16.2.6.2. Products
- 16.2.6.3. SWOT Analysis
- 16.2.6.4. Recent Developments
- 16.2.6.5. Financials (Based on Availability)
- 16.2.7 Philips Healthcare
- 16.2.7.1. Overview
- 16.2.7.2. Products
- 16.2.7.3. SWOT Analysis
- 16.2.7.4. Recent Developments
- 16.2.7.5. Financials (Based on Availability)
- 16.2.8 Medtronic PLC
- 16.2.8.1. Overview
- 16.2.8.2. Products
- 16.2.8.3. SWOT Analysis
- 16.2.8.4. Recent Developments
- 16.2.8.5. Financials (Based on Availability)
- 16.2.9 Advanced Brain Monitoring Inc
- 16.2.9.1. Overview
- 16.2.9.2. Products
- 16.2.9.3. SWOT Analysis
- 16.2.9.4. Recent Developments
- 16.2.9.5. Financials (Based on Availability)
- 16.2.10 Nihon Kohden Corporation
- 16.2.10.1. Overview
- 16.2.10.2. Products
- 16.2.10.3. SWOT Analysis
- 16.2.10.4. Recent Developments
- 16.2.10.5. Financials (Based on Availability)
- 16.2.1 Siemens Healthineers
List of Figures
- Figure 1: Global Neurological Monitoring Industry Revenue Breakdown (Million, %) by Region 2024 & 2032
- Figure 2: Global Neurological Monitoring Industry Volume Breakdown (K Unit, %) by Region 2024 & 2032
- Figure 3: North America Neurological Monitoring Industry Revenue (Million), by Country 2024 & 2032
- Figure 4: North America Neurological Monitoring Industry Volume (K Unit), by Country 2024 & 2032
- Figure 5: North America Neurological Monitoring Industry Revenue Share (%), by Country 2024 & 2032
- Figure 6: North America Neurological Monitoring Industry Volume Share (%), by Country 2024 & 2032
- Figure 7: Europe Neurological Monitoring Industry Revenue (Million), by Country 2024 & 2032
- Figure 8: Europe Neurological Monitoring Industry Volume (K Unit), by Country 2024 & 2032
- Figure 9: Europe Neurological Monitoring Industry Revenue Share (%), by Country 2024 & 2032
- Figure 10: Europe Neurological Monitoring Industry Volume Share (%), by Country 2024 & 2032
- Figure 11: Asia Pacific Neurological Monitoring Industry Revenue (Million), by Country 2024 & 2032
- Figure 12: Asia Pacific Neurological Monitoring Industry Volume (K Unit), by Country 2024 & 2032
- Figure 13: Asia Pacific Neurological Monitoring Industry Revenue Share (%), by Country 2024 & 2032
- Figure 14: Asia Pacific Neurological Monitoring Industry Volume Share (%), by Country 2024 & 2032
- Figure 15: Middle East and Africa Neurological Monitoring Industry Revenue (Million), by Country 2024 & 2032
- Figure 16: Middle East and Africa Neurological Monitoring Industry Volume (K Unit), by Country 2024 & 2032
- Figure 17: Middle East and Africa Neurological Monitoring Industry Revenue Share (%), by Country 2024 & 2032
- Figure 18: Middle East and Africa Neurological Monitoring Industry Volume Share (%), by Country 2024 & 2032
- Figure 19: South America Neurological Monitoring Industry Revenue (Million), by Country 2024 & 2032
- Figure 20: South America Neurological Monitoring Industry Volume (K Unit), by Country 2024 & 2032
- Figure 21: South America Neurological Monitoring Industry Revenue Share (%), by Country 2024 & 2032
- Figure 22: South America Neurological Monitoring Industry Volume Share (%), by Country 2024 & 2032
- Figure 23: North America Neurological Monitoring Industry Revenue (Million), by Product Type 2024 & 2032
- Figure 24: North America Neurological Monitoring Industry Volume (K Unit), by Product Type 2024 & 2032
- Figure 25: North America Neurological Monitoring Industry Revenue Share (%), by Product Type 2024 & 2032
- Figure 26: North America Neurological Monitoring Industry Volume Share (%), by Product Type 2024 & 2032
- Figure 27: North America Neurological Monitoring Industry Revenue (Million), by Disease Type 2024 & 2032
- Figure 28: North America Neurological Monitoring Industry Volume (K Unit), by Disease Type 2024 & 2032
- Figure 29: North America Neurological Monitoring Industry Revenue Share (%), by Disease Type 2024 & 2032
- Figure 30: North America Neurological Monitoring Industry Volume Share (%), by Disease Type 2024 & 2032
- Figure 31: North America Neurological Monitoring Industry Revenue (Million), by Country 2024 & 2032
- Figure 32: North America Neurological Monitoring Industry Volume (K Unit), by Country 2024 & 2032
- Figure 33: North America Neurological Monitoring Industry Revenue Share (%), by Country 2024 & 2032
- Figure 34: North America Neurological Monitoring Industry Volume Share (%), by Country 2024 & 2032
- Figure 35: Europe Neurological Monitoring Industry Revenue (Million), by Product Type 2024 & 2032
- Figure 36: Europe Neurological Monitoring Industry Volume (K Unit), by Product Type 2024 & 2032
- Figure 37: Europe Neurological Monitoring Industry Revenue Share (%), by Product Type 2024 & 2032
- Figure 38: Europe Neurological Monitoring Industry Volume Share (%), by Product Type 2024 & 2032
- Figure 39: Europe Neurological Monitoring Industry Revenue (Million), by Disease Type 2024 & 2032
- Figure 40: Europe Neurological Monitoring Industry Volume (K Unit), by Disease Type 2024 & 2032
- Figure 41: Europe Neurological Monitoring Industry Revenue Share (%), by Disease Type 2024 & 2032
- Figure 42: Europe Neurological Monitoring Industry Volume Share (%), by Disease Type 2024 & 2032
- Figure 43: Europe Neurological Monitoring Industry Revenue (Million), by Country 2024 & 2032
- Figure 44: Europe Neurological Monitoring Industry Volume (K Unit), by Country 2024 & 2032
- Figure 45: Europe Neurological Monitoring Industry Revenue Share (%), by Country 2024 & 2032
- Figure 46: Europe Neurological Monitoring Industry Volume Share (%), by Country 2024 & 2032
- Figure 47: Asia Pacific Neurological Monitoring Industry Revenue (Million), by Product Type 2024 & 2032
- Figure 48: Asia Pacific Neurological Monitoring Industry Volume (K Unit), by Product Type 2024 & 2032
- Figure 49: Asia Pacific Neurological Monitoring Industry Revenue Share (%), by Product Type 2024 & 2032
- Figure 50: Asia Pacific Neurological Monitoring Industry Volume Share (%), by Product Type 2024 & 2032
- Figure 51: Asia Pacific Neurological Monitoring Industry Revenue (Million), by Disease Type 2024 & 2032
- Figure 52: Asia Pacific Neurological Monitoring Industry Volume (K Unit), by Disease Type 2024 & 2032
- Figure 53: Asia Pacific Neurological Monitoring Industry Revenue Share (%), by Disease Type 2024 & 2032
- Figure 54: Asia Pacific Neurological Monitoring Industry Volume Share (%), by Disease Type 2024 & 2032
- Figure 55: Asia Pacific Neurological Monitoring Industry Revenue (Million), by Country 2024 & 2032
- Figure 56: Asia Pacific Neurological Monitoring Industry Volume (K Unit), by Country 2024 & 2032
- Figure 57: Asia Pacific Neurological Monitoring Industry Revenue Share (%), by Country 2024 & 2032
- Figure 58: Asia Pacific Neurological Monitoring Industry Volume Share (%), by Country 2024 & 2032
- Figure 59: Middle East and Africa Neurological Monitoring Industry Revenue (Million), by Product Type 2024 & 2032
- Figure 60: Middle East and Africa Neurological Monitoring Industry Volume (K Unit), by Product Type 2024 & 2032
- Figure 61: Middle East and Africa Neurological Monitoring Industry Revenue Share (%), by Product Type 2024 & 2032
- Figure 62: Middle East and Africa Neurological Monitoring Industry Volume Share (%), by Product Type 2024 & 2032
- Figure 63: Middle East and Africa Neurological Monitoring Industry Revenue (Million), by Disease Type 2024 & 2032
- Figure 64: Middle East and Africa Neurological Monitoring Industry Volume (K Unit), by Disease Type 2024 & 2032
- Figure 65: Middle East and Africa Neurological Monitoring Industry Revenue Share (%), by Disease Type 2024 & 2032
- Figure 66: Middle East and Africa Neurological Monitoring Industry Volume Share (%), by Disease Type 2024 & 2032
- Figure 67: Middle East and Africa Neurological Monitoring Industry Revenue (Million), by Country 2024 & 2032
- Figure 68: Middle East and Africa Neurological Monitoring Industry Volume (K Unit), by Country 2024 & 2032
- Figure 69: Middle East and Africa Neurological Monitoring Industry Revenue Share (%), by Country 2024 & 2032
- Figure 70: Middle East and Africa Neurological Monitoring Industry Volume Share (%), by Country 2024 & 2032
- Figure 71: South America Neurological Monitoring Industry Revenue (Million), by Product Type 2024 & 2032
- Figure 72: South America Neurological Monitoring Industry Volume (K Unit), by Product Type 2024 & 2032
- Figure 73: South America Neurological Monitoring Industry Revenue Share (%), by Product Type 2024 & 2032
- Figure 74: South America Neurological Monitoring Industry Volume Share (%), by Product Type 2024 & 2032
- Figure 75: South America Neurological Monitoring Industry Revenue (Million), by Disease Type 2024 & 2032
- Figure 76: South America Neurological Monitoring Industry Volume (K Unit), by Disease Type 2024 & 2032
- Figure 77: South America Neurological Monitoring Industry Revenue Share (%), by Disease Type 2024 & 2032
- Figure 78: South America Neurological Monitoring Industry Volume Share (%), by Disease Type 2024 & 2032
- Figure 79: South America Neurological Monitoring Industry Revenue (Million), by Country 2024 & 2032
- Figure 80: South America Neurological Monitoring Industry Volume (K Unit), by Country 2024 & 2032
- Figure 81: South America Neurological Monitoring Industry Revenue Share (%), by Country 2024 & 2032
- Figure 82: South America Neurological Monitoring Industry Volume Share (%), by Country 2024 & 2032
List of Tables
- Table 1: Global Neurological Monitoring Industry Revenue Million Forecast, by Region 2019 & 2032
- Table 2: Global Neurological Monitoring Industry Volume K Unit Forecast, by Region 2019 & 2032
- Table 3: Global Neurological Monitoring Industry Revenue Million Forecast, by Product Type 2019 & 2032
- Table 4: Global Neurological Monitoring Industry Volume K Unit Forecast, by Product Type 2019 & 2032
- Table 5: Global Neurological Monitoring Industry Revenue Million Forecast, by Disease Type 2019 & 2032
- Table 6: Global Neurological Monitoring Industry Volume K Unit Forecast, by Disease Type 2019 & 2032
- Table 7: Global Neurological Monitoring Industry Revenue Million Forecast, by Region 2019 & 2032
- Table 8: Global Neurological Monitoring Industry Volume K Unit Forecast, by Region 2019 & 2032
- Table 9: Global Neurological Monitoring Industry Revenue Million Forecast, by Country 2019 & 2032
- Table 10: Global Neurological Monitoring Industry Volume K Unit Forecast, by Country 2019 & 2032
- Table 11: United States Neurological Monitoring Industry Revenue (Million) Forecast, by Application 2019 & 2032
- Table 12: United States Neurological Monitoring Industry Volume (K Unit) Forecast, by Application 2019 & 2032
- Table 13: Canada Neurological Monitoring Industry Revenue (Million) Forecast, by Application 2019 & 2032
- Table 14: Canada Neurological Monitoring Industry Volume (K Unit) Forecast, by Application 2019 & 2032
- Table 15: Mexico Neurological Monitoring Industry Revenue (Million) Forecast, by Application 2019 & 2032
- Table 16: Mexico Neurological Monitoring Industry Volume (K Unit) Forecast, by Application 2019 & 2032
- Table 17: Global Neurological Monitoring Industry Revenue Million Forecast, by Country 2019 & 2032
- Table 18: Global Neurological Monitoring Industry Volume K Unit Forecast, by Country 2019 & 2032
- Table 19: Germany Neurological Monitoring Industry Revenue (Million) Forecast, by Application 2019 & 2032
- Table 20: Germany Neurological Monitoring Industry Volume (K Unit) Forecast, by Application 2019 & 2032
- Table 21: United Kingdom Neurological Monitoring Industry Revenue (Million) Forecast, by Application 2019 & 2032
- Table 22: United Kingdom Neurological Monitoring Industry Volume (K Unit) Forecast, by Application 2019 & 2032
- Table 23: France Neurological Monitoring Industry Revenue (Million) Forecast, by Application 2019 & 2032
- Table 24: France Neurological Monitoring Industry Volume (K Unit) Forecast, by Application 2019 & 2032
- Table 25: Italy Neurological Monitoring Industry Revenue (Million) Forecast, by Application 2019 & 2032
- Table 26: Italy Neurological Monitoring Industry Volume (K Unit) Forecast, by Application 2019 & 2032
- Table 27: Spain Neurological Monitoring Industry Revenue (Million) Forecast, by Application 2019 & 2032
- Table 28: Spain Neurological Monitoring Industry Volume (K Unit) Forecast, by Application 2019 & 2032
- Table 29: Rest of Europe Neurological Monitoring Industry Revenue (Million) Forecast, by Application 2019 & 2032
- Table 30: Rest of Europe Neurological Monitoring Industry Volume (K Unit) Forecast, by Application 2019 & 2032
- Table 31: Global Neurological Monitoring Industry Revenue Million Forecast, by Country 2019 & 2032
- Table 32: Global Neurological Monitoring Industry Volume K Unit Forecast, by Country 2019 & 2032
- Table 33: China Neurological Monitoring Industry Revenue (Million) Forecast, by Application 2019 & 2032
- Table 34: China Neurological Monitoring Industry Volume (K Unit) Forecast, by Application 2019 & 2032
- Table 35: Japan Neurological Monitoring Industry Revenue (Million) Forecast, by Application 2019 & 2032
- Table 36: Japan Neurological Monitoring Industry Volume (K Unit) Forecast, by Application 2019 & 2032
- Table 37: India Neurological Monitoring Industry Revenue (Million) Forecast, by Application 2019 & 2032
- Table 38: India Neurological Monitoring Industry Volume (K Unit) Forecast, by Application 2019 & 2032
- Table 39: Australia Neurological Monitoring Industry Revenue (Million) Forecast, by Application 2019 & 2032
- Table 40: Australia Neurological Monitoring Industry Volume (K Unit) Forecast, by Application 2019 & 2032
- Table 41: South Korea Neurological Monitoring Industry Revenue (Million) Forecast, by Application 2019 & 2032
- Table 42: South Korea Neurological Monitoring Industry Volume (K Unit) Forecast, by Application 2019 & 2032
- Table 43: Rest of Asia Pacific Neurological Monitoring Industry Revenue (Million) Forecast, by Application 2019 & 2032
- Table 44: Rest of Asia Pacific Neurological Monitoring Industry Volume (K Unit) Forecast, by Application 2019 & 2032
- Table 45: Global Neurological Monitoring Industry Revenue Million Forecast, by Country 2019 & 2032
- Table 46: Global Neurological Monitoring Industry Volume K Unit Forecast, by Country 2019 & 2032
- Table 47: GCC Neurological Monitoring Industry Revenue (Million) Forecast, by Application 2019 & 2032
- Table 48: GCC Neurological Monitoring Industry Volume (K Unit) Forecast, by Application 2019 & 2032
- Table 49: South Africa Neurological Monitoring Industry Revenue (Million) Forecast, by Application 2019 & 2032
- Table 50: South Africa Neurological Monitoring Industry Volume (K Unit) Forecast, by Application 2019 & 2032
- Table 51: Rest of Middle East and Africa Neurological Monitoring Industry Revenue (Million) Forecast, by Application 2019 & 2032
- Table 52: Rest of Middle East and Africa Neurological Monitoring Industry Volume (K Unit) Forecast, by Application 2019 & 2032
- Table 53: Global Neurological Monitoring Industry Revenue Million Forecast, by Country 2019 & 2032
- Table 54: Global Neurological Monitoring Industry Volume K Unit Forecast, by Country 2019 & 2032
- Table 55: Brazil Neurological Monitoring Industry Revenue (Million) Forecast, by Application 2019 & 2032
- Table 56: Brazil Neurological Monitoring Industry Volume (K Unit) Forecast, by Application 2019 & 2032
- Table 57: Argentina Neurological Monitoring Industry Revenue (Million) Forecast, by Application 2019 & 2032
- Table 58: Argentina Neurological Monitoring Industry Volume (K Unit) Forecast, by Application 2019 & 2032
- Table 59: Rest of South America Neurological Monitoring Industry Revenue (Million) Forecast, by Application 2019 & 2032
- Table 60: Rest of South America Neurological Monitoring Industry Volume (K Unit) Forecast, by Application 2019 & 2032
- Table 61: Global Neurological Monitoring Industry Revenue Million Forecast, by Product Type 2019 & 2032
- Table 62: Global Neurological Monitoring Industry Volume K Unit Forecast, by Product Type 2019 & 2032
- Table 63: Global Neurological Monitoring Industry Revenue Million Forecast, by Disease Type 2019 & 2032
- Table 64: Global Neurological Monitoring Industry Volume K Unit Forecast, by Disease Type 2019 & 2032
- Table 65: Global Neurological Monitoring Industry Revenue Million Forecast, by Country 2019 & 2032
- Table 66: Global Neurological Monitoring Industry Volume K Unit Forecast, by Country 2019 & 2032
- Table 67: United States Neurological Monitoring Industry Revenue (Million) Forecast, by Application 2019 & 2032
- Table 68: United States Neurological Monitoring Industry Volume (K Unit) Forecast, by Application 2019 & 2032
- Table 69: Canada Neurological Monitoring Industry Revenue (Million) Forecast, by Application 2019 & 2032
- Table 70: Canada Neurological Monitoring Industry Volume (K Unit) Forecast, by Application 2019 & 2032
- Table 71: Mexico Neurological Monitoring Industry Revenue (Million) Forecast, by Application 2019 & 2032
- Table 72: Mexico Neurological Monitoring Industry Volume (K Unit) Forecast, by Application 2019 & 2032
- Table 73: Global Neurological Monitoring Industry Revenue Million Forecast, by Product Type 2019 & 2032
- Table 74: Global Neurological Monitoring Industry Volume K Unit Forecast, by Product Type 2019 & 2032
- Table 75: Global Neurological Monitoring Industry Revenue Million Forecast, by Disease Type 2019 & 2032
- Table 76: Global Neurological Monitoring Industry Volume K Unit Forecast, by Disease Type 2019 & 2032
- Table 77: Global Neurological Monitoring Industry Revenue Million Forecast, by Country 2019 & 2032
- Table 78: Global Neurological Monitoring Industry Volume K Unit Forecast, by Country 2019 & 2032
- Table 79: Germany Neurological Monitoring Industry Revenue (Million) Forecast, by Application 2019 & 2032
- Table 80: Germany Neurological Monitoring Industry Volume (K Unit) Forecast, by Application 2019 & 2032
- Table 81: United Kingdom Neurological Monitoring Industry Revenue (Million) Forecast, by Application 2019 & 2032
- Table 82: United Kingdom Neurological Monitoring Industry Volume (K Unit) Forecast, by Application 2019 & 2032
- Table 83: France Neurological Monitoring Industry Revenue (Million) Forecast, by Application 2019 & 2032
- Table 84: France Neurological Monitoring Industry Volume (K Unit) Forecast, by Application 2019 & 2032
- Table 85: Italy Neurological Monitoring Industry Revenue (Million) Forecast, by Application 2019 & 2032
- Table 86: Italy Neurological Monitoring Industry Volume (K Unit) Forecast, by Application 2019 & 2032
- Table 87: Spain Neurological Monitoring Industry Revenue (Million) Forecast, by Application 2019 & 2032
- Table 88: Spain Neurological Monitoring Industry Volume (K Unit) Forecast, by Application 2019 & 2032
- Table 89: Rest of Europe Neurological Monitoring Industry Revenue (Million) Forecast, by Application 2019 & 2032
- Table 90: Rest of Europe Neurological Monitoring Industry Volume (K Unit) Forecast, by Application 2019 & 2032
- Table 91: Global Neurological Monitoring Industry Revenue Million Forecast, by Product Type 2019 & 2032
- Table 92: Global Neurological Monitoring Industry Volume K Unit Forecast, by Product Type 2019 & 2032
- Table 93: Global Neurological Monitoring Industry Revenue Million Forecast, by Disease Type 2019 & 2032
- Table 94: Global Neurological Monitoring Industry Volume K Unit Forecast, by Disease Type 2019 & 2032
- Table 95: Global Neurological Monitoring Industry Revenue Million Forecast, by Country 2019 & 2032
- Table 96: Global Neurological Monitoring Industry Volume K Unit Forecast, by Country 2019 & 2032
- Table 97: China Neurological Monitoring Industry Revenue (Million) Forecast, by Application 2019 & 2032
- Table 98: China Neurological Monitoring Industry Volume (K Unit) Forecast, by Application 2019 & 2032
- Table 99: Japan Neurological Monitoring Industry Revenue (Million) Forecast, by Application 2019 & 2032
- Table 100: Japan Neurological Monitoring Industry Volume (K Unit) Forecast, by Application 2019 & 2032
- Table 101: India Neurological Monitoring Industry Revenue (Million) Forecast, by Application 2019 & 2032
- Table 102: India Neurological Monitoring Industry Volume (K Unit) Forecast, by Application 2019 & 2032
- Table 103: Australia Neurological Monitoring Industry Revenue (Million) Forecast, by Application 2019 & 2032
- Table 104: Australia Neurological Monitoring Industry Volume (K Unit) Forecast, by Application 2019 & 2032
- Table 105: South Korea Neurological Monitoring Industry Revenue (Million) Forecast, by Application 2019 & 2032
- Table 106: South Korea Neurological Monitoring Industry Volume (K Unit) Forecast, by Application 2019 & 2032
- Table 107: Rest of Asia Pacific Neurological Monitoring Industry Revenue (Million) Forecast, by Application 2019 & 2032
- Table 108: Rest of Asia Pacific Neurological Monitoring Industry Volume (K Unit) Forecast, by Application 2019 & 2032
- Table 109: Global Neurological Monitoring Industry Revenue Million Forecast, by Product Type 2019 & 2032
- Table 110: Global Neurological Monitoring Industry Volume K Unit Forecast, by Product Type 2019 & 2032
- Table 111: Global Neurological Monitoring Industry Revenue Million Forecast, by Disease Type 2019 & 2032
- Table 112: Global Neurological Monitoring Industry Volume K Unit Forecast, by Disease Type 2019 & 2032
- Table 113: Global Neurological Monitoring Industry Revenue Million Forecast, by Country 2019 & 2032
- Table 114: Global Neurological Monitoring Industry Volume K Unit Forecast, by Country 2019 & 2032
- Table 115: GCC Neurological Monitoring Industry Revenue (Million) Forecast, by Application 2019 & 2032
- Table 116: GCC Neurological Monitoring Industry Volume (K Unit) Forecast, by Application 2019 & 2032
- Table 117: South Africa Neurological Monitoring Industry Revenue (Million) Forecast, by Application 2019 & 2032
- Table 118: South Africa Neurological Monitoring Industry Volume (K Unit) Forecast, by Application 2019 & 2032
- Table 119: Rest of Middle East and Africa Neurological Monitoring Industry Revenue (Million) Forecast, by Application 2019 & 2032
- Table 120: Rest of Middle East and Africa Neurological Monitoring Industry Volume (K Unit) Forecast, by Application 2019 & 2032
- Table 121: Global Neurological Monitoring Industry Revenue Million Forecast, by Product Type 2019 & 2032
- Table 122: Global Neurological Monitoring Industry Volume K Unit Forecast, by Product Type 2019 & 2032
- Table 123: Global Neurological Monitoring Industry Revenue Million Forecast, by Disease Type 2019 & 2032
- Table 124: Global Neurological Monitoring Industry Volume K Unit Forecast, by Disease Type 2019 & 2032
- Table 125: Global Neurological Monitoring Industry Revenue Million Forecast, by Country 2019 & 2032
- Table 126: Global Neurological Monitoring Industry Volume K Unit Forecast, by Country 2019 & 2032
- Table 127: Brazil Neurological Monitoring Industry Revenue (Million) Forecast, by Application 2019 & 2032
- Table 128: Brazil Neurological Monitoring Industry Volume (K Unit) Forecast, by Application 2019 & 2032
- Table 129: Argentina Neurological Monitoring Industry Revenue (Million) Forecast, by Application 2019 & 2032
- Table 130: Argentina Neurological Monitoring Industry Volume (K Unit) Forecast, by Application 2019 & 2032
- Table 131: Rest of South America Neurological Monitoring Industry Revenue (Million) Forecast, by Application 2019 & 2032
- Table 132: Rest of South America Neurological Monitoring Industry Volume (K Unit) Forecast, by Application 2019 & 2032
Frequently Asked Questions
1. What is the projected Compound Annual Growth Rate (CAGR) of the Neurological Monitoring Industry?
The projected CAGR is approximately 6.00%.
2. Which companies are prominent players in the Neurological Monitoring Industry?
Key companies in the market include Siemens Healthineers, GE Healthcare, Masimo Corporation, Natus Medical Inc, Compumedics Limited, Dragerwerk Ag & Co KGaA, Philips Healthcare, Medtronic PLC, Advanced Brain Monitoring Inc, Nihon Kohden Corporation.
3. What are the main segments of the Neurological Monitoring Industry?
The market segments include Product Type, Disease Type.
4. Can you provide details about the market size?
The market size is estimated to be USD 6.74 Million as of 2022.
5. What are some drivers contributing to market growth?
Increasing Burden of Neurological Disorders; Growing Incidence of Traumatic Brain Injuries; Increasing Number of Product Approvals.
6. What are the notable trends driving market growth?
Sleep Disorder is Expected to Witness Strong Growth Over the Forecast Period.
7. Are there any restraints impacting market growth?
High Cost of Monitoring Devices; Shortage of Trained Professionals.
8. Can you provide examples of recent developments in the market?
February 2023: SafeICP, a project funded by the Spanish Research Agency in collaboration with European Next Generation funds, is developing a low-cost, easy-to-use monitor that will be placed at patients' bedside to non-invasively monitor intracranial pressure values.
9. What pricing options are available for accessing the report?
Pricing options include single-user, multi-user, and enterprise licenses priced at USD 4750, USD 5250, and USD 8750 respectively.
10. Is the market size provided in terms of value or volume?
The market size is provided in terms of value, measured in Million and volume, measured in K Unit.
11. Are there any specific market keywords associated with the report?
Yes, the market keyword associated with the report is "Neurological Monitoring Industry," which aids in identifying and referencing the specific market segment covered.
12. How do I determine which pricing option suits my needs best?
The pricing options vary based on user requirements and access needs. Individual users may opt for single-user licenses, while businesses requiring broader access may choose multi-user or enterprise licenses for cost-effective access to the report.
13. Are there any additional resources or data provided in the Neurological Monitoring Industry report?
While the report offers comprehensive insights, it's advisable to review the specific contents or supplementary materials provided to ascertain if additional resources or data are available.
14. How can I stay updated on further developments or reports in the Neurological Monitoring Industry?
To stay informed about further developments, trends, and reports in the Neurological Monitoring Industry, consider subscribing to industry newsletters, following relevant companies and organizations, or regularly checking reputable industry news sources and publications.
Methodology
Step 1 - Identification of Relevant Samples Size from Population Database


Step 2 - Approaches for Defining Global Market Size (Value, Volume* & Price*)

Note*: In applicable scenarios
Step 3 - Data Sources
Primary Research
- Web Analytics
- Survey Reports
- Research Institute
- Latest Research Reports
- Opinion Leaders
Secondary Research
- Annual Reports
- White Paper
- Latest Press Release
- Industry Association
- Paid Database
- Investor Presentations

Step 4 - Data Triangulation
Involves using different sources of information in order to increase the validity of a study
These sources are likely to be stakeholders in a program - participants, other researchers, program staff, other community members, and so on.
Then we put all data in single framework & apply various statistical tools to find out the dynamic on the market.
During the analysis stage, feedback from the stakeholder groups would be compared to determine areas of agreement as well as areas of divergence
