

Key Insights
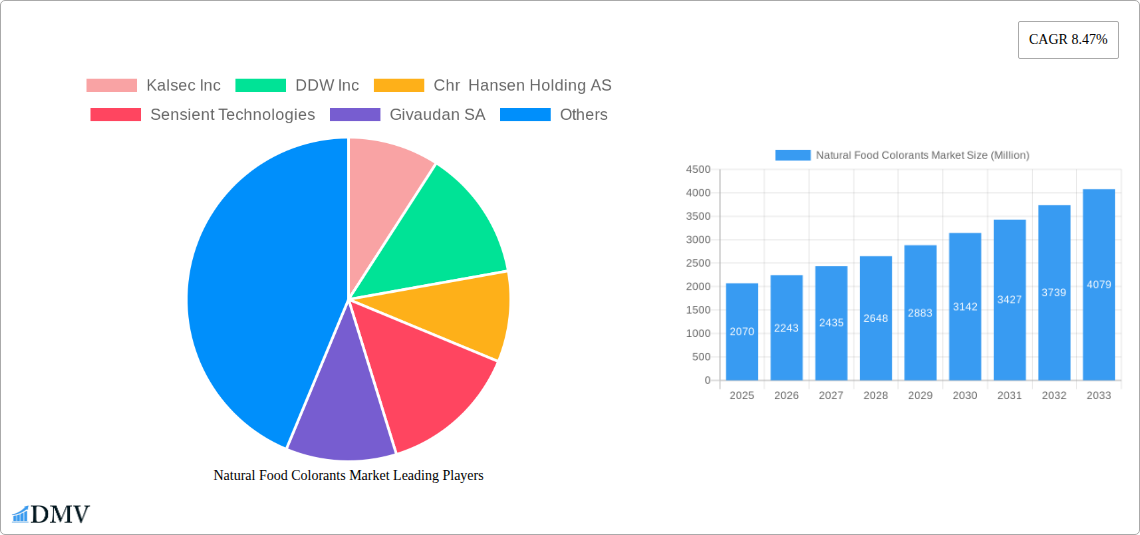
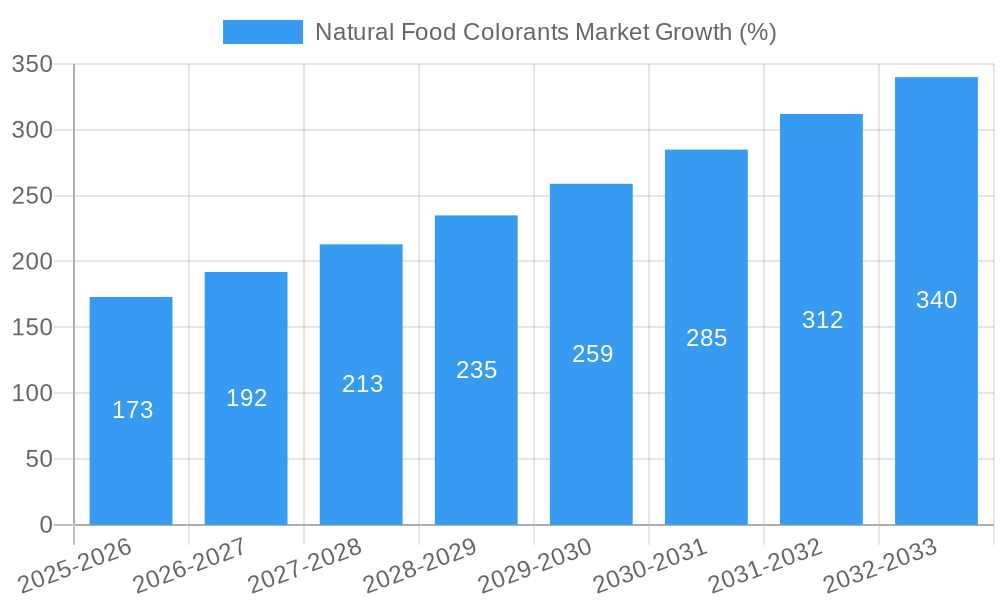
The global natural food colorants market, valued at $2.07 billion in 2025, is projected to experience robust growth, driven by a compound annual growth rate (CAGR) of 8.47% from 2025 to 2033. This expansion is fueled by several key factors. The rising consumer demand for clean-label products, free from artificial additives and preservatives, is a significant driver. Health-conscious consumers are increasingly seeking natural alternatives to synthetic colorings, perceiving them as healthier and safer. This trend is particularly pronounced in developed regions like North America and Europe, where awareness of food ingredient sourcing and processing is high. Furthermore, the growing popularity of plant-based foods and beverages is boosting the market, as natural colorants are essential for enhancing the visual appeal of these products. The bakery, dairy, and confectionery sectors are major application areas, showcasing significant growth potential. Innovation in natural colorant extraction and processing techniques is also contributing to market expansion, leading to improved color stability and cost-effectiveness. However, challenges remain, including price volatility of raw materials and potential supply chain disruptions. Regulatory changes and consumer preference shifts could also influence market dynamics in the coming years.
Despite challenges, the market's future looks promising. The increasing demand for natural food colorants is expected to continue throughout the forecast period. Regional variations exist, with North America and Europe currently dominating the market due to higher consumer awareness and stringent regulations. However, the Asia-Pacific region is anticipated to witness significant growth, driven by increasing disposable incomes and changing dietary habits. Major players like Kalsec Inc, DDW Inc, and Chr. Hansen are investing heavily in research and development to meet the growing demand for innovative and sustainable natural colorants. This strategic focus on innovation, coupled with consumer preferences, is expected to drive the market's expansion beyond the projected CAGR. The market's segmentation by application offers opportunities for specialized product development and targeted marketing strategies, focusing on specific consumer needs within distinct food and beverage categories.
Natural Food Colorants Market: A Comprehensive Report (2019-2033)
This insightful report provides a deep dive into the dynamic Natural Food Colorants Market, offering a comprehensive analysis of market trends, leading players, and future growth prospects. Valued at xx Million in 2025, the market is poised for significant expansion, reaching xx Million by 2033. This study covers the historical period (2019-2024), the base year (2025), and forecasts the market's trajectory until 2033.
Natural Food Colorants Market Composition & Trends
The Natural Food Colorants Market is characterized by moderate concentration, with key players like Kalsec Inc, DDW Inc, Chr. Hansen Holding AS, Sensient Technologies, Givaudan SA, Koninklijke DSM NV, Synthite Industries Private Ltd, Symrise AG, and Archer Daniels Midland Company holding significant market share. However, the market also witnesses the emergence of smaller, specialized players, particularly in niche applications. Market share distribution among the top players is estimated at xx%, reflecting a competitive landscape with ongoing consolidation.
- Innovation Catalysts: Growing consumer demand for clean-label products and the increasing prevalence of health-conscious lifestyles are driving innovation in natural food colorants. The development of new extraction techniques and synthetic alternatives is also shaping the market.
- Regulatory Landscape: Stringent regulations regarding the use of artificial colorants are pushing the adoption of natural alternatives, creating both opportunities and challenges for market players. Variations in regulations across different geographies add complexity.
- Substitute Products: While natural food colorants are gaining traction, synthetic colorants still hold a significant share, posing competitive pressure. However, the growing preference for natural ingredients is steadily eroding this advantage.
- End-User Profiles: The market caters to diverse end-users, including food and beverage manufacturers, confectionery companies, and nutraceutical producers. Understanding the specific needs and preferences of these segments is crucial for effective market penetration.
- M&A Activities: The market has witnessed several significant mergers and acquisitions, with deal values estimated at xx Million in recent years. These activities primarily aim to expand product portfolios, enhance R&D capabilities, and strengthen market presence. For example, Givaudan SA's acquisition of Naturex in 2018 demonstrates this consolidation trend.
Natural Food Colorants Market Industry Evolution
The Natural Food Colorants Market exhibits a steady growth trajectory, driven by several interconnected factors. The market experienced a Compound Annual Growth Rate (CAGR) of xx% during the historical period (2019-2024) and is projected to maintain a CAGR of xx% during the forecast period (2025-2033). This growth is attributed to several key factors, including a rising preference for natural and organic food products, increasing health consciousness among consumers, stringent regulations limiting the use of synthetic colorants, and continuous technological advancements leading to improved color stability, cost-effectiveness, and variety of natural color options. The rising demand from various food segments like bakery, confectionery, and beverages further fuels market expansion. Innovation in extraction methods, particularly for challenging colors like blue and green, plays a critical role in influencing the market's trajectory. Specific adoption metrics, like the increase in the percentage of food products using natural colorants compared to synthetic ones, are continuously increasing and further validating this trend. The increasing investments in research and development of novel natural colorants underscore the market's dynamic nature and promise for future growth.
Leading Regions, Countries, or Segments in Natural Food Colorants Market
The North American and European regions currently dominate the Natural Food Colorants Market, driven by strong regulatory frameworks favoring natural ingredients and high consumer demand for clean-label products. Asia Pacific shows significant potential for growth due to its burgeoning food and beverage industry and rising disposable incomes.
Key Drivers:
- North America: Strong regulatory push for natural ingredients; high consumer awareness of health benefits; well-established food processing industry.
- Europe: Similar to North America, with high demand for clean-label products and strict regulations governing artificial colors.
- Asia Pacific: Rapid growth of the food and beverage industry; increasing disposable incomes; expanding middle class favoring premium food products.
Dominance Factors:
The dominance of North America and Europe is largely attributable to higher consumer awareness of the health implications of artificial colors, stringent government regulations, and the presence of established food processing industries with substantial investments in research and development. The Asia Pacific region is catching up rapidly due to its increasing middle class and growing demand for processed foods with natural colorants.
Natural Food Colorants Market Product Innovations
Recent years have witnessed significant innovations in natural food colorants, focused on achieving improved stability, vibrant colors, and broader application possibilities. Companies are developing novel extraction techniques to obtain more intense colors from natural sources, and creating innovative formulations for improved heat and light stability in various food matrices. For instance, the launch of Sensient's heat-stable SupraRed™ significantly expanded the applications of natural red colorants. The development of new shades, such as GNT Group's EXBERRY® Shade Pink - OD, further enhances the product portfolio for manufacturers. These advancements address key limitations of natural colorants, leading to their increased acceptance among food producers.
Propelling Factors for Natural Food Colorants Market Growth
Several factors contribute to the growth of the Natural Food Colorants Market. These include the increasing consumer preference for natural and clean-label food products; stringent government regulations limiting or banning the use of artificial colorants in various food categories; the growing demand for natural colorants in diverse applications like bakery, confectionery, beverages, and nutraceuticals; and ongoing research and development efforts leading to improved color stability, wider availability, and enhanced color range of natural alternatives. These forces are collectively driving the market towards a sustainable and health-conscious future.
Obstacles in the Natural Food Colorants Market
The Natural Food Colorants Market faces challenges such as the higher cost of production compared to synthetic colorants, the limited availability of certain natural colors, and variations in color stability across different food matrices. Supply chain disruptions and the competitive pressures from synthetic colorant manufacturers also impact market growth. Regulatory inconsistencies across different regions create hurdles for global market expansion. Addressing these issues is critical for the sustainable growth of the market.
Future Opportunities in Natural Food Colorants Market
Future opportunities lie in expanding into emerging markets, developing innovative natural colorants with improved performance and wider applications, and capitalizing on the growing demand for natural colors in functional foods and nutraceuticals. Further research and development into obtaining novel colors from sustainable sources and developing cost-effective extraction processes offer significant potential. Moreover, tailoring products to meet the specific demands of various food segments presents lucrative opportunities for growth.
Major Players in the Natural Food Colorants Market Ecosystem
- Kalsec Inc
- DDW Inc
- Chr. Hansen Holding AS
- Sensient Technologies
- Givaudan SA
- Koninklijke DSM NV
- Synthite Industries Private Ltd
- Symrise AG
- Archer Daniels Midland Company
- List Not Exhaustive
Key Developments in Natural Food Colorants Market Industry
- April 2016: Sensient® Colors launched SupraRed™, a heat-stable natural red color.
- September 2018: Givaudan SA acquired Naturex, expanding its natural ingredient portfolio.
- October 2020: Chr. Hansen Natural Colors established an R&D center in Montpellier, France.
- January 2021: GNT Group added EXBERRY® Shade Pink - OD to its EXBERRY® brand.
Strategic Natural Food Colorants Market Forecast
The Natural Food Colorants Market is poised for substantial growth, driven by increasing consumer preference for natural ingredients and stringent regulations. Emerging markets and ongoing technological advancements are expected to unlock further opportunities. The market's future trajectory will be significantly shaped by innovation, sustainability, and regulatory developments. The demand for natural and healthier food options is expected to continue to rise, further propelling the market's growth throughout the forecast period.
Natural Food Colorants Market Segmentation
-
1. Application
- 1.1. Bakery
-
1.2. Dairy-based Products
- 1.2.1. Ice Cream
- 1.2.2. Other Products
-
1.3. Beverages
- 1.3.1. Alcoholic Beverages
- 1.3.2. Non-alcoholic Beverages
- 1.4. Confectionery
- 1.5. Nutraceuticals
- 1.6. Snacks and Cereals
- 1.7. Other Applications
Natural Food Colorants Market Segmentation By Geography
-
1. North America
- 1.1. United States
- 1.2. Canada
- 1.3. Mexico
- 1.4. Rest of North America
-
2. Europe
- 2.1. United Kingdom
- 2.2. Germany
- 2.3. Italy
- 2.4. Russia
- 2.5. Spain
- 2.6. France
- 2.7. Rest of Europe
-
3. Asia Pacific
- 3.1. China
- 3.2. Japan
- 3.3. India
- 3.4. Australia
- 3.5. Rest of Asia Pacific
-
4. South America
- 4.1. Brazil
- 4.2. Argentina
- 4.3. Rest of South America
- 5. Middle East
-
6. United Arab Emirates
- 6.1. Saudi Arabia
- 6.2. Egypt
- 6.3. South Africa
- 6.4. Rest of Middle East

Natural Food Colorants Market REPORT HIGHLIGHTS
| Aspects | Details |
|---|---|
| Study Period | 2019-2033 |
| Base Year | 2024 |
| Estimated Year | 2025 |
| Forecast Period | 2025-2033 |
| Historical Period | 2019-2024 |
| Growth Rate | CAGR of 8.47% from 2019-2033 |
| Segmentation |
|
Table of Contents
- 1. Introduction
- 1.1. Research Scope
- 1.2. Market Segmentation
- 1.3. Research Methodology
- 1.4. Definitions and Assumptions
- 2. Executive Summary
- 2.1. Introduction
- 3. Market Dynamics
- 3.1. Introduction
- 3.2. Market Drivers
- 3.2.1. Rising Health Consciousness among consumer
- 3.3. Market Restrains
- 3.3.1. High Cost of natural Ingredients
- 3.4. Market Trends
- 3.4.1. Brightening Spotlight on Coloring Foodstuff
- 4. Market Factor Analysis
- 4.1. Porters Five Forces
- 4.2. Supply/Value Chain
- 4.3. PESTEL analysis
- 4.4. Market Entropy
- 4.5. Patent/Trademark Analysis
- 5. Global Natural Food Colorants Market Analysis, Insights and Forecast, 2019-2031
- 5.1. Market Analysis, Insights and Forecast - by Application
- 5.1.1. Bakery
- 5.1.2. Dairy-based Products
- 5.1.2.1. Ice Cream
- 5.1.2.2. Other Products
- 5.1.3. Beverages
- 5.1.3.1. Alcoholic Beverages
- 5.1.3.2. Non-alcoholic Beverages
- 5.1.4. Confectionery
- 5.1.5. Nutraceuticals
- 5.1.6. Snacks and Cereals
- 5.1.7. Other Applications
- 5.2. Market Analysis, Insights and Forecast - by Region
- 5.2.1. North America
- 5.2.2. Europe
- 5.2.3. Asia Pacific
- 5.2.4. South America
- 5.2.5. Middle East
- 5.2.6. United Arab Emirates
- 5.1. Market Analysis, Insights and Forecast - by Application
- 6. North America Natural Food Colorants Market Analysis, Insights and Forecast, 2019-2031
- 6.1. Market Analysis, Insights and Forecast - by Application
- 6.1.1. Bakery
- 6.1.2. Dairy-based Products
- 6.1.2.1. Ice Cream
- 6.1.2.2. Other Products
- 6.1.3. Beverages
- 6.1.3.1. Alcoholic Beverages
- 6.1.3.2. Non-alcoholic Beverages
- 6.1.4. Confectionery
- 6.1.5. Nutraceuticals
- 6.1.6. Snacks and Cereals
- 6.1.7. Other Applications
- 6.1. Market Analysis, Insights and Forecast - by Application
- 7. Europe Natural Food Colorants Market Analysis, Insights and Forecast, 2019-2031
- 7.1. Market Analysis, Insights and Forecast - by Application
- 7.1.1. Bakery
- 7.1.2. Dairy-based Products
- 7.1.2.1. Ice Cream
- 7.1.2.2. Other Products
- 7.1.3. Beverages
- 7.1.3.1. Alcoholic Beverages
- 7.1.3.2. Non-alcoholic Beverages
- 7.1.4. Confectionery
- 7.1.5. Nutraceuticals
- 7.1.6. Snacks and Cereals
- 7.1.7. Other Applications
- 7.1. Market Analysis, Insights and Forecast - by Application
- 8. Asia Pacific Natural Food Colorants Market Analysis, Insights and Forecast, 2019-2031
- 8.1. Market Analysis, Insights and Forecast - by Application
- 8.1.1. Bakery
- 8.1.2. Dairy-based Products
- 8.1.2.1. Ice Cream
- 8.1.2.2. Other Products
- 8.1.3. Beverages
- 8.1.3.1. Alcoholic Beverages
- 8.1.3.2. Non-alcoholic Beverages
- 8.1.4. Confectionery
- 8.1.5. Nutraceuticals
- 8.1.6. Snacks and Cereals
- 8.1.7. Other Applications
- 8.1. Market Analysis, Insights and Forecast - by Application
- 9. South America Natural Food Colorants Market Analysis, Insights and Forecast, 2019-2031
- 9.1. Market Analysis, Insights and Forecast - by Application
- 9.1.1. Bakery
- 9.1.2. Dairy-based Products
- 9.1.2.1. Ice Cream
- 9.1.2.2. Other Products
- 9.1.3. Beverages
- 9.1.3.1. Alcoholic Beverages
- 9.1.3.2. Non-alcoholic Beverages
- 9.1.4. Confectionery
- 9.1.5. Nutraceuticals
- 9.1.6. Snacks and Cereals
- 9.1.7. Other Applications
- 9.1. Market Analysis, Insights and Forecast - by Application
- 10. Middle East Natural Food Colorants Market Analysis, Insights and Forecast, 2019-2031
- 10.1. Market Analysis, Insights and Forecast - by Application
- 10.1.1. Bakery
- 10.1.2. Dairy-based Products
- 10.1.2.1. Ice Cream
- 10.1.2.2. Other Products
- 10.1.3. Beverages
- 10.1.3.1. Alcoholic Beverages
- 10.1.3.2. Non-alcoholic Beverages
- 10.1.4. Confectionery
- 10.1.5. Nutraceuticals
- 10.1.6. Snacks and Cereals
- 10.1.7. Other Applications
- 10.1. Market Analysis, Insights and Forecast - by Application
- 11. United Arab Emirates Natural Food Colorants Market Analysis, Insights and Forecast, 2019-2031
- 11.1. Market Analysis, Insights and Forecast - by Application
- 11.1.1. Bakery
- 11.1.2. Dairy-based Products
- 11.1.2.1. Ice Cream
- 11.1.2.2. Other Products
- 11.1.3. Beverages
- 11.1.3.1. Alcoholic Beverages
- 11.1.3.2. Non-alcoholic Beverages
- 11.1.4. Confectionery
- 11.1.5. Nutraceuticals
- 11.1.6. Snacks and Cereals
- 11.1.7. Other Applications
- 11.1. Market Analysis, Insights and Forecast - by Application
- 12. North America Natural Food Colorants Market Analysis, Insights and Forecast, 2019-2031
- 12.1. Market Analysis, Insights and Forecast - By Country/Sub-region
- 12.1.1 United States
- 12.1.2 Canada
- 12.1.3 Mexico
- 12.1.4 Rest of North America
- 13. Europe Natural Food Colorants Market Analysis, Insights and Forecast, 2019-2031
- 13.1. Market Analysis, Insights and Forecast - By Country/Sub-region
- 13.1.1 United Kingdom
- 13.1.2 Germany
- 13.1.3 Italy
- 13.1.4 Russia
- 13.1.5 Spain
- 13.1.6 France
- 13.1.7 Rest of Europe
- 14. Asia Pacific Natural Food Colorants Market Analysis, Insights and Forecast, 2019-2031
- 14.1. Market Analysis, Insights and Forecast - By Country/Sub-region
- 14.1.1 China
- 14.1.2 Japan
- 14.1.3 India
- 14.1.4 Australia
- 14.1.5 Rest of Asia Pacific
- 15. South America Natural Food Colorants Market Analysis, Insights and Forecast, 2019-2031
- 15.1. Market Analysis, Insights and Forecast - By Country/Sub-region
- 15.1.1 Brazil
- 15.1.2 Argentina
- 15.1.3 Rest of South America
- 16. Middle East Natural Food Colorants Market Analysis, Insights and Forecast, 2019-2031
- 16.1. Market Analysis, Insights and Forecast - By Country/Sub-region
- 16.1.1.
- 17. United Arab Emirates Natural Food Colorants Market Analysis, Insights and Forecast, 2019-2031
- 17.1. Market Analysis, Insights and Forecast - By Country/Sub-region
- 17.1.1 Saudi Arabia
- 17.1.2 Egypt
- 17.1.3 South Africa
- 17.1.4 Rest of Middle East
- 18. Competitive Analysis
- 18.1. Global Market Share Analysis 2024
- 18.2. Company Profiles
- 18.2.1 Kalsec Inc
- 18.2.1.1. Overview
- 18.2.1.2. Products
- 18.2.1.3. SWOT Analysis
- 18.2.1.4. Recent Developments
- 18.2.1.5. Financials (Based on Availability)
- 18.2.2 DDW Inc
- 18.2.2.1. Overview
- 18.2.2.2. Products
- 18.2.2.3. SWOT Analysis
- 18.2.2.4. Recent Developments
- 18.2.2.5. Financials (Based on Availability)
- 18.2.3 Chr Hansen Holding AS
- 18.2.3.1. Overview
- 18.2.3.2. Products
- 18.2.3.3. SWOT Analysis
- 18.2.3.4. Recent Developments
- 18.2.3.5. Financials (Based on Availability)
- 18.2.4 Sensient Technologies
- 18.2.4.1. Overview
- 18.2.4.2. Products
- 18.2.4.3. SWOT Analysis
- 18.2.4.4. Recent Developments
- 18.2.4.5. Financials (Based on Availability)
- 18.2.5 Givaudan SA
- 18.2.5.1. Overview
- 18.2.5.2. Products
- 18.2.5.3. SWOT Analysis
- 18.2.5.4. Recent Developments
- 18.2.5.5. Financials (Based on Availability)
- 18.2.6 Koninklijke DSM NV
- 18.2.6.1. Overview
- 18.2.6.2. Products
- 18.2.6.3. SWOT Analysis
- 18.2.6.4. Recent Developments
- 18.2.6.5. Financials (Based on Availability)
- 18.2.7 Synthite Industries Private Ltd
- 18.2.7.1. Overview
- 18.2.7.2. Products
- 18.2.7.3. SWOT Analysis
- 18.2.7.4. Recent Developments
- 18.2.7.5. Financials (Based on Availability)
- 18.2.8 Symrise AG
- 18.2.8.1. Overview
- 18.2.8.2. Products
- 18.2.8.3. SWOT Analysis
- 18.2.8.4. Recent Developments
- 18.2.8.5. Financials (Based on Availability)
- 18.2.9 Archer Daniels Midland Company*List Not Exhaustive
- 18.2.9.1. Overview
- 18.2.9.2. Products
- 18.2.9.3. SWOT Analysis
- 18.2.9.4. Recent Developments
- 18.2.9.5. Financials (Based on Availability)
- 18.2.1 Kalsec Inc
List of Figures
- Figure 1: Global Natural Food Colorants Market Revenue Breakdown (Million, %) by Region 2024 & 2032
- Figure 2: North America Natural Food Colorants Market Revenue (Million), by Country 2024 & 2032
- Figure 3: North America Natural Food Colorants Market Revenue Share (%), by Country 2024 & 2032
- Figure 4: Europe Natural Food Colorants Market Revenue (Million), by Country 2024 & 2032
- Figure 5: Europe Natural Food Colorants Market Revenue Share (%), by Country 2024 & 2032
- Figure 6: Asia Pacific Natural Food Colorants Market Revenue (Million), by Country 2024 & 2032
- Figure 7: Asia Pacific Natural Food Colorants Market Revenue Share (%), by Country 2024 & 2032
- Figure 8: South America Natural Food Colorants Market Revenue (Million), by Country 2024 & 2032
- Figure 9: South America Natural Food Colorants Market Revenue Share (%), by Country 2024 & 2032
- Figure 10: Middle East Natural Food Colorants Market Revenue (Million), by Country 2024 & 2032
- Figure 11: Middle East Natural Food Colorants Market Revenue Share (%), by Country 2024 & 2032
- Figure 12: United Arab Emirates Natural Food Colorants Market Revenue (Million), by Country 2024 & 2032
- Figure 13: United Arab Emirates Natural Food Colorants Market Revenue Share (%), by Country 2024 & 2032
- Figure 14: North America Natural Food Colorants Market Revenue (Million), by Application 2024 & 2032
- Figure 15: North America Natural Food Colorants Market Revenue Share (%), by Application 2024 & 2032
- Figure 16: North America Natural Food Colorants Market Revenue (Million), by Country 2024 & 2032
- Figure 17: North America Natural Food Colorants Market Revenue Share (%), by Country 2024 & 2032
- Figure 18: Europe Natural Food Colorants Market Revenue (Million), by Application 2024 & 2032
- Figure 19: Europe Natural Food Colorants Market Revenue Share (%), by Application 2024 & 2032
- Figure 20: Europe Natural Food Colorants Market Revenue (Million), by Country 2024 & 2032
- Figure 21: Europe Natural Food Colorants Market Revenue Share (%), by Country 2024 & 2032
- Figure 22: Asia Pacific Natural Food Colorants Market Revenue (Million), by Application 2024 & 2032
- Figure 23: Asia Pacific Natural Food Colorants Market Revenue Share (%), by Application 2024 & 2032
- Figure 24: Asia Pacific Natural Food Colorants Market Revenue (Million), by Country 2024 & 2032
- Figure 25: Asia Pacific Natural Food Colorants Market Revenue Share (%), by Country 2024 & 2032
- Figure 26: South America Natural Food Colorants Market Revenue (Million), by Application 2024 & 2032
- Figure 27: South America Natural Food Colorants Market Revenue Share (%), by Application 2024 & 2032
- Figure 28: South America Natural Food Colorants Market Revenue (Million), by Country 2024 & 2032
- Figure 29: South America Natural Food Colorants Market Revenue Share (%), by Country 2024 & 2032
- Figure 30: Middle East Natural Food Colorants Market Revenue (Million), by Application 2024 & 2032
- Figure 31: Middle East Natural Food Colorants Market Revenue Share (%), by Application 2024 & 2032
- Figure 32: Middle East Natural Food Colorants Market Revenue (Million), by Country 2024 & 2032
- Figure 33: Middle East Natural Food Colorants Market Revenue Share (%), by Country 2024 & 2032
- Figure 34: United Arab Emirates Natural Food Colorants Market Revenue (Million), by Application 2024 & 2032
- Figure 35: United Arab Emirates Natural Food Colorants Market Revenue Share (%), by Application 2024 & 2032
- Figure 36: United Arab Emirates Natural Food Colorants Market Revenue (Million), by Country 2024 & 2032
- Figure 37: United Arab Emirates Natural Food Colorants Market Revenue Share (%), by Country 2024 & 2032
List of Tables
- Table 1: Global Natural Food Colorants Market Revenue Million Forecast, by Region 2019 & 2032
- Table 2: Global Natural Food Colorants Market Revenue Million Forecast, by Application 2019 & 2032
- Table 3: Global Natural Food Colorants Market Revenue Million Forecast, by Region 2019 & 2032
- Table 4: Global Natural Food Colorants Market Revenue Million Forecast, by Country 2019 & 2032
- Table 5: United States Natural Food Colorants Market Revenue (Million) Forecast, by Application 2019 & 2032
- Table 6: Canada Natural Food Colorants Market Revenue (Million) Forecast, by Application 2019 & 2032
- Table 7: Mexico Natural Food Colorants Market Revenue (Million) Forecast, by Application 2019 & 2032
- Table 8: Rest of North America Natural Food Colorants Market Revenue (Million) Forecast, by Application 2019 & 2032
- Table 9: Global Natural Food Colorants Market Revenue Million Forecast, by Country 2019 & 2032
- Table 10: United Kingdom Natural Food Colorants Market Revenue (Million) Forecast, by Application 2019 & 2032
- Table 11: Germany Natural Food Colorants Market Revenue (Million) Forecast, by Application 2019 & 2032
- Table 12: Italy Natural Food Colorants Market Revenue (Million) Forecast, by Application 2019 & 2032
- Table 13: Russia Natural Food Colorants Market Revenue (Million) Forecast, by Application 2019 & 2032
- Table 14: Spain Natural Food Colorants Market Revenue (Million) Forecast, by Application 2019 & 2032
- Table 15: France Natural Food Colorants Market Revenue (Million) Forecast, by Application 2019 & 2032
- Table 16: Rest of Europe Natural Food Colorants Market Revenue (Million) Forecast, by Application 2019 & 2032
- Table 17: Global Natural Food Colorants Market Revenue Million Forecast, by Country 2019 & 2032
- Table 18: China Natural Food Colorants Market Revenue (Million) Forecast, by Application 2019 & 2032
- Table 19: Japan Natural Food Colorants Market Revenue (Million) Forecast, by Application 2019 & 2032
- Table 20: India Natural Food Colorants Market Revenue (Million) Forecast, by Application 2019 & 2032
- Table 21: Australia Natural Food Colorants Market Revenue (Million) Forecast, by Application 2019 & 2032
- Table 22: Rest of Asia Pacific Natural Food Colorants Market Revenue (Million) Forecast, by Application 2019 & 2032
- Table 23: Global Natural Food Colorants Market Revenue Million Forecast, by Country 2019 & 2032
- Table 24: Brazil Natural Food Colorants Market Revenue (Million) Forecast, by Application 2019 & 2032
- Table 25: Argentina Natural Food Colorants Market Revenue (Million) Forecast, by Application 2019 & 2032
- Table 26: Rest of South America Natural Food Colorants Market Revenue (Million) Forecast, by Application 2019 & 2032
- Table 27: Global Natural Food Colorants Market Revenue Million Forecast, by Country 2019 & 2032
- Table 28: Natural Food Colorants Market Revenue (Million) Forecast, by Application 2019 & 2032
- Table 29: Global Natural Food Colorants Market Revenue Million Forecast, by Country 2019 & 2032
- Table 30: Saudi Arabia Natural Food Colorants Market Revenue (Million) Forecast, by Application 2019 & 2032
- Table 31: Egypt Natural Food Colorants Market Revenue (Million) Forecast, by Application 2019 & 2032
- Table 32: South Africa Natural Food Colorants Market Revenue (Million) Forecast, by Application 2019 & 2032
- Table 33: Rest of Middle East Natural Food Colorants Market Revenue (Million) Forecast, by Application 2019 & 2032
- Table 34: Global Natural Food Colorants Market Revenue Million Forecast, by Application 2019 & 2032
- Table 35: Global Natural Food Colorants Market Revenue Million Forecast, by Country 2019 & 2032
- Table 36: United States Natural Food Colorants Market Revenue (Million) Forecast, by Application 2019 & 2032
- Table 37: Canada Natural Food Colorants Market Revenue (Million) Forecast, by Application 2019 & 2032
- Table 38: Mexico Natural Food Colorants Market Revenue (Million) Forecast, by Application 2019 & 2032
- Table 39: Rest of North America Natural Food Colorants Market Revenue (Million) Forecast, by Application 2019 & 2032
- Table 40: Global Natural Food Colorants Market Revenue Million Forecast, by Application 2019 & 2032
- Table 41: Global Natural Food Colorants Market Revenue Million Forecast, by Country 2019 & 2032
- Table 42: United Kingdom Natural Food Colorants Market Revenue (Million) Forecast, by Application 2019 & 2032
- Table 43: Germany Natural Food Colorants Market Revenue (Million) Forecast, by Application 2019 & 2032
- Table 44: Italy Natural Food Colorants Market Revenue (Million) Forecast, by Application 2019 & 2032
- Table 45: Russia Natural Food Colorants Market Revenue (Million) Forecast, by Application 2019 & 2032
- Table 46: Spain Natural Food Colorants Market Revenue (Million) Forecast, by Application 2019 & 2032
- Table 47: France Natural Food Colorants Market Revenue (Million) Forecast, by Application 2019 & 2032
- Table 48: Rest of Europe Natural Food Colorants Market Revenue (Million) Forecast, by Application 2019 & 2032
- Table 49: Global Natural Food Colorants Market Revenue Million Forecast, by Application 2019 & 2032
- Table 50: Global Natural Food Colorants Market Revenue Million Forecast, by Country 2019 & 2032
- Table 51: China Natural Food Colorants Market Revenue (Million) Forecast, by Application 2019 & 2032
- Table 52: Japan Natural Food Colorants Market Revenue (Million) Forecast, by Application 2019 & 2032
- Table 53: India Natural Food Colorants Market Revenue (Million) Forecast, by Application 2019 & 2032
- Table 54: Australia Natural Food Colorants Market Revenue (Million) Forecast, by Application 2019 & 2032
- Table 55: Rest of Asia Pacific Natural Food Colorants Market Revenue (Million) Forecast, by Application 2019 & 2032
- Table 56: Global Natural Food Colorants Market Revenue Million Forecast, by Application 2019 & 2032
- Table 57: Global Natural Food Colorants Market Revenue Million Forecast, by Country 2019 & 2032
- Table 58: Brazil Natural Food Colorants Market Revenue (Million) Forecast, by Application 2019 & 2032
- Table 59: Argentina Natural Food Colorants Market Revenue (Million) Forecast, by Application 2019 & 2032
- Table 60: Rest of South America Natural Food Colorants Market Revenue (Million) Forecast, by Application 2019 & 2032
- Table 61: Global Natural Food Colorants Market Revenue Million Forecast, by Application 2019 & 2032
- Table 62: Global Natural Food Colorants Market Revenue Million Forecast, by Country 2019 & 2032
- Table 63: Global Natural Food Colorants Market Revenue Million Forecast, by Application 2019 & 2032
- Table 64: Global Natural Food Colorants Market Revenue Million Forecast, by Country 2019 & 2032
- Table 65: Saudi Arabia Natural Food Colorants Market Revenue (Million) Forecast, by Application 2019 & 2032
- Table 66: Egypt Natural Food Colorants Market Revenue (Million) Forecast, by Application 2019 & 2032
- Table 67: South Africa Natural Food Colorants Market Revenue (Million) Forecast, by Application 2019 & 2032
- Table 68: Rest of Middle East Natural Food Colorants Market Revenue (Million) Forecast, by Application 2019 & 2032
Frequently Asked Questions
1. What is the projected Compound Annual Growth Rate (CAGR) of the Natural Food Colorants Market?
The projected CAGR is approximately 8.47%.
2. Which companies are prominent players in the Natural Food Colorants Market?
Key companies in the market include Kalsec Inc, DDW Inc, Chr Hansen Holding AS, Sensient Technologies, Givaudan SA, Koninklijke DSM NV, Synthite Industries Private Ltd, Symrise AG, Archer Daniels Midland Company*List Not Exhaustive.
3. What are the main segments of the Natural Food Colorants Market?
The market segments include Application.
4. Can you provide details about the market size?
The market size is estimated to be USD 2.07 Million as of 2022.
5. What are some drivers contributing to market growth?
Rising Health Consciousness among consumer.
6. What are the notable trends driving market growth?
Brightening Spotlight on Coloring Foodstuff.
7. Are there any restraints impacting market growth?
High Cost of natural Ingredients.
8. Can you provide examples of recent developments in the market?
In January 2021, GNT Group added a new pink shade coloring agent under its EXBERRY® brand with the name EXBERRY® Shade Pink - OD, which is developed for use in fat-based applications. It is also available in red, yellow, orange, blue, and green variants.
9. What pricing options are available for accessing the report?
Pricing options include single-user, multi-user, and enterprise licenses priced at USD 4750, USD 5250, and USD 8750 respectively.
10. Is the market size provided in terms of value or volume?
The market size is provided in terms of value, measured in Million.
11. Are there any specific market keywords associated with the report?
Yes, the market keyword associated with the report is "Natural Food Colorants Market," which aids in identifying and referencing the specific market segment covered.
12. How do I determine which pricing option suits my needs best?
The pricing options vary based on user requirements and access needs. Individual users may opt for single-user licenses, while businesses requiring broader access may choose multi-user or enterprise licenses for cost-effective access to the report.
13. Are there any additional resources or data provided in the Natural Food Colorants Market report?
While the report offers comprehensive insights, it's advisable to review the specific contents or supplementary materials provided to ascertain if additional resources or data are available.
14. How can I stay updated on further developments or reports in the Natural Food Colorants Market?
To stay informed about further developments, trends, and reports in the Natural Food Colorants Market, consider subscribing to industry newsletters, following relevant companies and organizations, or regularly checking reputable industry news sources and publications.
Methodology
Step 1 - Identification of Relevant Samples Size from Population Database


Step 2 - Approaches for Defining Global Market Size (Value, Volume* & Price*)

Note*: In applicable scenarios
Step 3 - Data Sources
Primary Research
- Web Analytics
- Survey Reports
- Research Institute
- Latest Research Reports
- Opinion Leaders
Secondary Research
- Annual Reports
- White Paper
- Latest Press Release
- Industry Association
- Paid Database
- Investor Presentations

Step 4 - Data Triangulation
Involves using different sources of information in order to increase the validity of a study
These sources are likely to be stakeholders in a program - participants, other researchers, program staff, other community members, and so on.
Then we put all data in single framework & apply various statistical tools to find out the dynamic on the market.
During the analysis stage, feedback from the stakeholder groups would be compared to determine areas of agreement as well as areas of divergence
