

Key Insights
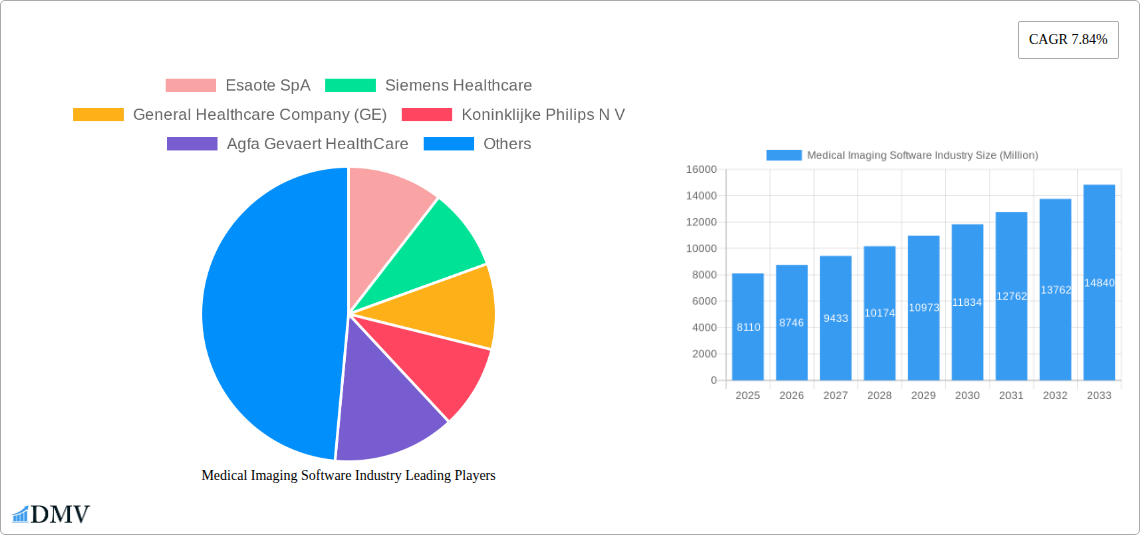
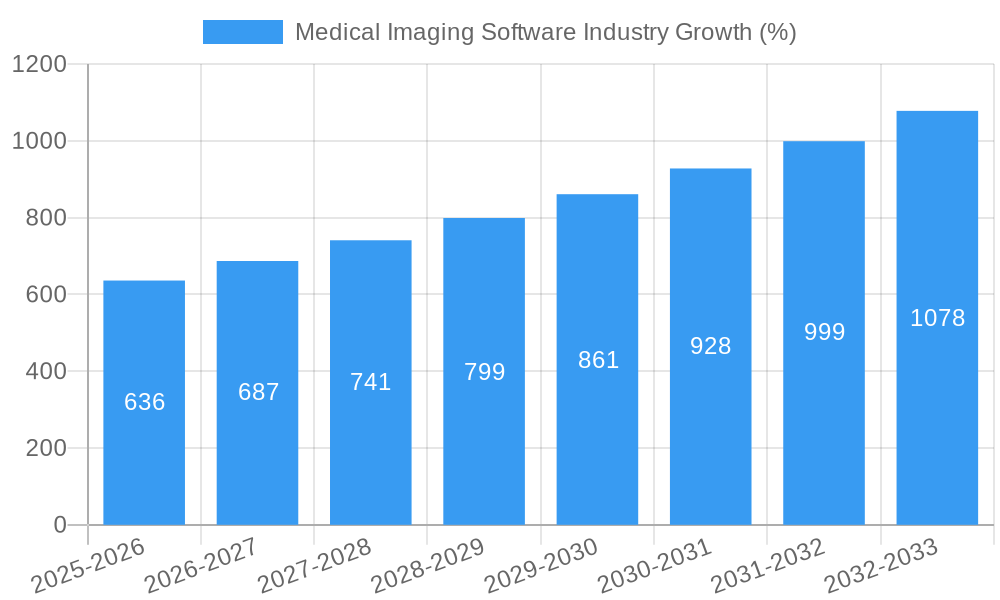
The global medical imaging software market, valued at $8.11 billion in 2025, is projected to experience robust growth, exhibiting a compound annual growth rate (CAGR) of 7.84% from 2025 to 2033. This expansion is fueled by several key drivers. The increasing prevalence of chronic diseases, particularly cardiovascular and oncological conditions, necessitates advanced diagnostic tools, driving demand for sophisticated medical imaging software. Furthermore, technological advancements, such as the integration of artificial intelligence (AI) and machine learning (ML) for improved image analysis and diagnostic accuracy, are significantly contributing to market growth. The rising adoption of cloud-based solutions enhances accessibility and collaboration among healthcare professionals, further stimulating market expansion. Regulatory support for digital health initiatives and increasing healthcare expenditure globally are also contributing factors. Segmentation reveals strong growth in advanced imaging modalities like 3D and 4D imaging, reflecting the shift towards more precise and comprehensive diagnostic capabilities. While data privacy and security concerns pose challenges, the overall market outlook remains positive.
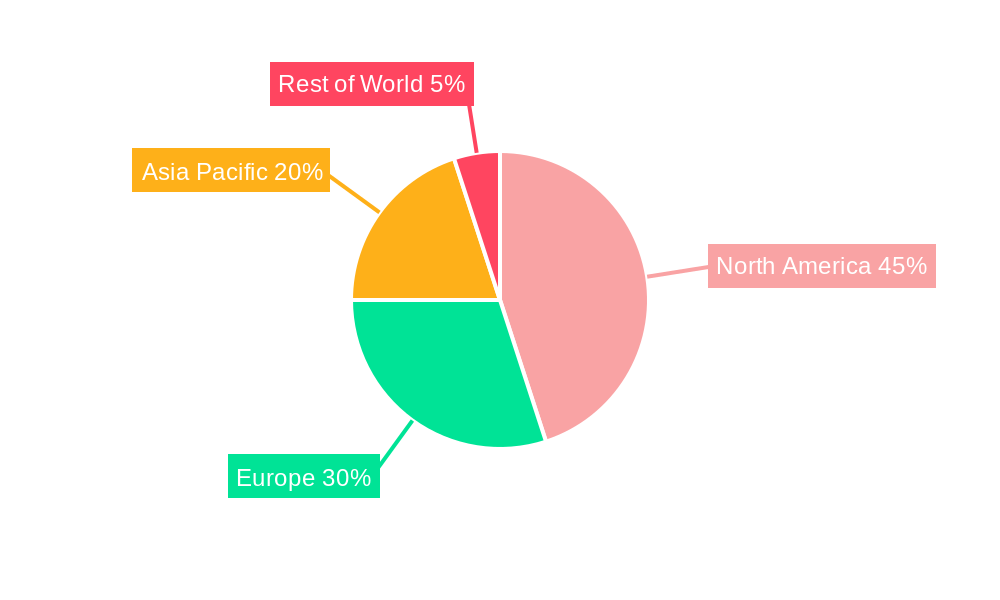
Significant regional variations exist. North America, with its established healthcare infrastructure and early adoption of advanced technologies, is expected to maintain a dominant market share. However, the Asia-Pacific region is poised for substantial growth, driven by increasing healthcare investments, rising disposable incomes, and a growing prevalence of chronic diseases. Europe is expected to show steady growth, propelled by technological advancements and regulatory support. The competitive landscape is characterized by established players like Esaote SpA, Siemens Healthcare, and GE Healthcare, alongside emerging companies focusing on innovative solutions. These companies are constantly innovating and improving their software to meet the evolving needs of the healthcare sector, leading to fierce competition and driving further market growth. The long-term forecast indicates continued expansion, with the market expected to surpass $15 billion by 2033, driven by the aforementioned factors and ongoing technological advancements.
Medical Imaging Software Industry Market Report: 2019-2033
This comprehensive report provides an in-depth analysis of the Medical Imaging Software market, projecting a market value of xx Million by 2033. The study period covers 2019-2033, with 2025 as the base and estimated year. This report is invaluable for stakeholders seeking to understand market dynamics, identify growth opportunities, and make informed strategic decisions.
Medical Imaging Software Industry Market Composition & Trends
The global medical imaging software market, valued at xx Million in 2024, is experiencing robust growth driven by technological advancements, increasing prevalence of chronic diseases, and rising demand for improved diagnostic accuracy. Market concentration is moderate, with key players like GE Healthcare, Siemens Healthineers, and Philips holding significant shares, but a competitive landscape exists with numerous specialized providers. The market is characterized by continuous innovation, particularly in AI-powered image analysis and cloud-based solutions. Stringent regulatory approvals (e.g., FDA, CE marking) shape product development and market entry. Substitute products are limited, primarily focused on alternative imaging modalities rather than direct software replacements. End-users span hospitals, diagnostic centers, and private practices, with varying technological adoption rates. M&A activity is significant, with deal values exceeding xx Million in recent years, often focused on acquiring companies with specialized software or AI capabilities.
- Market Share Distribution (2024): GE Healthcare (xx%), Siemens Healthineers (xx%), Philips (xx%), Others (xx%).
- M&A Deal Value (2019-2024): xx Million
- Key Innovation Catalysts: AI-powered image analysis, cloud-based platforms, improved user interfaces.
- Regulatory Landscape: Stringent FDA and CE marking requirements.
Medical Imaging Software Industry Evolution
The medical imaging software market has witnessed transformative growth from 2019 to 2024, expanding at a CAGR of xx%. This growth is largely attributed to the increasing adoption of advanced imaging techniques, such as 3D and 4D imaging, driven by the need for more precise and detailed diagnostic information. Technological advancements, including AI-powered image analysis and machine learning algorithms, are significantly impacting diagnostic accuracy and efficiency. Cloud-based solutions are enhancing accessibility and collaboration among healthcare providers. Furthermore, shifting consumer demands towards personalized medicine and improved patient care are further fueling market growth. The adoption rate of AI-powered diagnostic tools, for instance, increased from xx% in 2019 to xx% in 2024, indicating the growing acceptance of these technologies. Future growth is projected to be even more significant, driven by expanding applications of medical imaging in various specialties and the rising penetration of digital healthcare infrastructure.
Leading Regions, Countries, or Segments in Medical Imaging Software Industry
North America currently dominates the medical imaging software market, driven by high healthcare expenditure, advanced healthcare infrastructure, and early adoption of new technologies. Within imaging types, 2D imaging holds the largest market share due to its established use and cost-effectiveness. However, 3D and 4D imaging segments are experiencing rapid growth, fueled by their ability to provide more comprehensive diagnostic information. In terms of applications, cardiology, oncology, and neurology applications exhibit the highest growth rates.
- Key Drivers for North American Dominance:
- High healthcare expenditure.
- Well-developed healthcare infrastructure.
- Early adoption of innovative technologies.
- Robust regulatory support for medical device innovation.
- High-Growth Application Segments: Cardiology (Driven by increasing prevalence of cardiovascular diseases), Oncology (Due to improved cancer detection and treatment planning), Neurology (Fueled by the need for precise neurological assessments).
Medical Imaging Software Industry Product Innovations
Recent innovations focus on improving image quality, workflow efficiency, and diagnostic accuracy through AI-powered tools. Features like automated image analysis, improved visualization capabilities, and integration with Electronic Health Records (EHR) systems are enhancing the overall efficiency and effectiveness of medical imaging workflows. These advancements reduce diagnostic time, minimize human error, and ultimately improve patient outcomes. Unique selling propositions often center on the speed and accuracy of AI-driven diagnostics and the seamless integration with existing clinical workflows.
Propelling Factors for Medical Imaging Software Industry Growth
Several factors are driving the growth of the medical imaging software market. Technological advancements, such as AI and machine learning, are enhancing diagnostic capabilities and streamlining workflows. Increasing prevalence of chronic diseases fuels the demand for accurate and timely diagnostics. Favorable regulatory environments and government initiatives supporting healthcare technology adoption are also playing a significant role. Moreover, the growing adoption of cloud-based solutions is boosting accessibility and collaboration among healthcare providers.
Obstacles in the Medical Imaging Software Industry Market
High initial investment costs for advanced software and the need for specialized training to operate complex systems can present challenges to market penetration. Supply chain disruptions and the global shortage of semiconductor components can impact the production and availability of imaging software. Intense competition among established players and emerging startups can also create price pressures and restrict profit margins. Regulatory hurdles and varying approval processes across different geographies can cause delays in product launches and market entry.
Future Opportunities in Medical Imaging Software Industry
Expanding applications of medical imaging in emerging markets, particularly in developing economies, presents significant growth opportunities. The integration of artificial intelligence and machine learning to develop more precise and accurate diagnostic tools promises to revolutionize the field. The development of cloud-based solutions and mobile applications improves access to medical imaging services and expands market reach. The growing adoption of telemedicine and remote patient monitoring further expands the market potential.
Major Players in the Medical Imaging Software Industry Ecosystem
- Esaote SpA
- Siemens Healthcare
- General Healthcare Company (GE)
- Koninklijke Philips N V
- Agfa Gevaert HealthCare
- Cerner Corporation
- MIM Software Inc
- Canon Medical Systems Corporation
- Fujifilm Holding Company
- Carestream Health Inc
- Change Healthcare
- Novarad Corporation
Key Developments in Medical Imaging Software Industry Industry
- February 2022: The European Society of Radiology and GE Healthcare renewed their strategic partnership for the ECR 2022. GE Healthcare focused on digital AI, patient experience, and sustainability.
- July 2022: Canon Medical launched the Vantage Fortian MRI system, featuring innovative workflow solutions and accelerated scan technologies.
- July 2022: Calyx and Qynapse partnered to increase the use of AI-based neuroimaging in CNS clinical trials.
Strategic Medical Imaging Software Industry Market Forecast
The medical imaging software market is poised for significant growth over the forecast period (2025-2033), driven by technological innovation, increasing demand for advanced imaging techniques, and expansion into new applications and geographic markets. The market is expected to witness a considerable rise in the adoption of AI-powered solutions, cloud-based platforms, and personalized medicine approaches. These factors will contribute to a substantial increase in market size and value over the coming years, creating lucrative opportunities for industry players.
Medical Imaging Software Industry Segmentation
-
1. Imaging Type
- 1.1. 2D Imaging
- 1.2. 3D Imaging
- 1.3. 4D Imaging
-
2. Application
- 2.1. Dental Applications
- 2.2. Orthopaedic Applications
- 2.3. Cardiology Applications
- 2.4. Obstetrics and Gynaecology Applications
- 2.5. Mammography Applications
- 2.6. Urology and Nephrology Applications
- 2.7. Other Applications
Medical Imaging Software Industry Segmentation By Geography
-
1. North America
- 1.1. United States
- 1.2. Canada
-
2. Europe
- 2.1. Germany
- 2.2. France
- 2.3. United Kingdom
- 2.4. Rest of Europe
-
3. Asia Pacific
- 3.1. China
- 3.2. Japan
- 3.3. India
- 3.4. Rest of Asia Pacific
-
4. Rest of the World
- 4.1. Latin America
- 4.2. Middle East
Medical Imaging Software Industry REPORT HIGHLIGHTS
| Aspects | Details |
|---|---|
| Study Period | 2019-2033 |
| Base Year | 2024 |
| Estimated Year | 2025 |
| Forecast Period | 2025-2033 |
| Historical Period | 2019-2024 |
| Growth Rate | CAGR of 7.84% from 2019-2033 |
| Segmentation |
|
Table of Contents
- 1. Introduction
- 1.1. Research Scope
- 1.2. Market Segmentation
- 1.3. Research Methodology
- 1.4. Definitions and Assumptions
- 2. Executive Summary
- 2.1. Introduction
- 3. Market Dynamics
- 3.1. Introduction
- 3.2. Market Drivers
- 3.2.1. Growing Application of Computer-Aided Diagnostic Methods
- 3.3. Market Restrains
- 3.3.1. Dearth of Skilled Professionals and High Set-up Cost of the Equipment
- 3.4. Market Trends
- 3.4.1. Cardiology Applications Segment Holds Major Market Share
- 4. Market Factor Analysis
- 4.1. Porters Five Forces
- 4.2. Supply/Value Chain
- 4.3. PESTEL analysis
- 4.4. Market Entropy
- 4.5. Patent/Trademark Analysis
- 5. Global Medical Imaging Software Industry Analysis, Insights and Forecast, 2019-2031
- 5.1. Market Analysis, Insights and Forecast - by Imaging Type
- 5.1.1. 2D Imaging
- 5.1.2. 3D Imaging
- 5.1.3. 4D Imaging
- 5.2. Market Analysis, Insights and Forecast - by Application
- 5.2.1. Dental Applications
- 5.2.2. Orthopaedic Applications
- 5.2.3. Cardiology Applications
- 5.2.4. Obstetrics and Gynaecology Applications
- 5.2.5. Mammography Applications
- 5.2.6. Urology and Nephrology Applications
- 5.2.7. Other Applications
- 5.3. Market Analysis, Insights and Forecast - by Region
- 5.3.1. North America
- 5.3.2. Europe
- 5.3.3. Asia Pacific
- 5.3.4. Rest of the World
- 5.1. Market Analysis, Insights and Forecast - by Imaging Type
- 6. North America Medical Imaging Software Industry Analysis, Insights and Forecast, 2019-2031
- 6.1. Market Analysis, Insights and Forecast - by Imaging Type
- 6.1.1. 2D Imaging
- 6.1.2. 3D Imaging
- 6.1.3. 4D Imaging
- 6.2. Market Analysis, Insights and Forecast - by Application
- 6.2.1. Dental Applications
- 6.2.2. Orthopaedic Applications
- 6.2.3. Cardiology Applications
- 6.2.4. Obstetrics and Gynaecology Applications
- 6.2.5. Mammography Applications
- 6.2.6. Urology and Nephrology Applications
- 6.2.7. Other Applications
- 6.1. Market Analysis, Insights and Forecast - by Imaging Type
- 7. Europe Medical Imaging Software Industry Analysis, Insights and Forecast, 2019-2031
- 7.1. Market Analysis, Insights and Forecast - by Imaging Type
- 7.1.1. 2D Imaging
- 7.1.2. 3D Imaging
- 7.1.3. 4D Imaging
- 7.2. Market Analysis, Insights and Forecast - by Application
- 7.2.1. Dental Applications
- 7.2.2. Orthopaedic Applications
- 7.2.3. Cardiology Applications
- 7.2.4. Obstetrics and Gynaecology Applications
- 7.2.5. Mammography Applications
- 7.2.6. Urology and Nephrology Applications
- 7.2.7. Other Applications
- 7.1. Market Analysis, Insights and Forecast - by Imaging Type
- 8. Asia Pacific Medical Imaging Software Industry Analysis, Insights and Forecast, 2019-2031
- 8.1. Market Analysis, Insights and Forecast - by Imaging Type
- 8.1.1. 2D Imaging
- 8.1.2. 3D Imaging
- 8.1.3. 4D Imaging
- 8.2. Market Analysis, Insights and Forecast - by Application
- 8.2.1. Dental Applications
- 8.2.2. Orthopaedic Applications
- 8.2.3. Cardiology Applications
- 8.2.4. Obstetrics and Gynaecology Applications
- 8.2.5. Mammography Applications
- 8.2.6. Urology and Nephrology Applications
- 8.2.7. Other Applications
- 8.1. Market Analysis, Insights and Forecast - by Imaging Type
- 9. Rest of the World Medical Imaging Software Industry Analysis, Insights and Forecast, 2019-2031
- 9.1. Market Analysis, Insights and Forecast - by Imaging Type
- 9.1.1. 2D Imaging
- 9.1.2. 3D Imaging
- 9.1.3. 4D Imaging
- 9.2. Market Analysis, Insights and Forecast - by Application
- 9.2.1. Dental Applications
- 9.2.2. Orthopaedic Applications
- 9.2.3. Cardiology Applications
- 9.2.4. Obstetrics and Gynaecology Applications
- 9.2.5. Mammography Applications
- 9.2.6. Urology and Nephrology Applications
- 9.2.7. Other Applications
- 9.1. Market Analysis, Insights and Forecast - by Imaging Type
- 10. North America Medical Imaging Software Industry Analysis, Insights and Forecast, 2019-2031
- 10.1. Market Analysis, Insights and Forecast - By Country/Sub-region
- 10.1.1 United States
- 10.1.2 Canada
- 10.1.3 Mexico
- 11. Europe Medical Imaging Software Industry Analysis, Insights and Forecast, 2019-2031
- 11.1. Market Analysis, Insights and Forecast - By Country/Sub-region
- 11.1.1 Germany
- 11.1.2 United Kingdom
- 11.1.3 France
- 11.1.4 Spain
- 11.1.5 Italy
- 11.1.6 Spain
- 11.1.7 Belgium
- 11.1.8 Netherland
- 11.1.9 Nordics
- 11.1.10 Rest of Europe
- 12. Asia Pacific Medical Imaging Software Industry Analysis, Insights and Forecast, 2019-2031
- 12.1. Market Analysis, Insights and Forecast - By Country/Sub-region
- 12.1.1 China
- 12.1.2 Japan
- 12.1.3 India
- 12.1.4 South Korea
- 12.1.5 Southeast Asia
- 12.1.6 Australia
- 12.1.7 Indonesia
- 12.1.8 Phillipes
- 12.1.9 Singapore
- 12.1.10 Thailandc
- 12.1.11 Rest of Asia Pacific
- 13. South America Medical Imaging Software Industry Analysis, Insights and Forecast, 2019-2031
- 13.1. Market Analysis, Insights and Forecast - By Country/Sub-region
- 13.1.1 Brazil
- 13.1.2 Argentina
- 13.1.3 Peru
- 13.1.4 Chile
- 13.1.5 Colombia
- 13.1.6 Ecuador
- 13.1.7 Venezuela
- 13.1.8 Rest of South America
- 14. North America Medical Imaging Software Industry Analysis, Insights and Forecast, 2019-2031
- 14.1. Market Analysis, Insights and Forecast - By Country/Sub-region
- 14.1.1 United States
- 14.1.2 Canada
- 14.1.3 Mexico
- 15. MEA Medical Imaging Software Industry Analysis, Insights and Forecast, 2019-2031
- 15.1. Market Analysis, Insights and Forecast - By Country/Sub-region
- 15.1.1 United Arab Emirates
- 15.1.2 Saudi Arabia
- 15.1.3 South Africa
- 15.1.4 Rest of Middle East and Africa
- 16. Competitive Analysis
- 16.1. Global Market Share Analysis 2024
- 16.2. Company Profiles
- 16.2.1 Esaote SpA
- 16.2.1.1. Overview
- 16.2.1.2. Products
- 16.2.1.3. SWOT Analysis
- 16.2.1.4. Recent Developments
- 16.2.1.5. Financials (Based on Availability)
- 16.2.2 Siemens Healthcare
- 16.2.2.1. Overview
- 16.2.2.2. Products
- 16.2.2.3. SWOT Analysis
- 16.2.2.4. Recent Developments
- 16.2.2.5. Financials (Based on Availability)
- 16.2.3 General Healthcare Company (GE)
- 16.2.3.1. Overview
- 16.2.3.2. Products
- 16.2.3.3. SWOT Analysis
- 16.2.3.4. Recent Developments
- 16.2.3.5. Financials (Based on Availability)
- 16.2.4 Koninklijke Philips N V
- 16.2.4.1. Overview
- 16.2.4.2. Products
- 16.2.4.3. SWOT Analysis
- 16.2.4.4. Recent Developments
- 16.2.4.5. Financials (Based on Availability)
- 16.2.5 Agfa Gevaert HealthCare
- 16.2.5.1. Overview
- 16.2.5.2. Products
- 16.2.5.3. SWOT Analysis
- 16.2.5.4. Recent Developments
- 16.2.5.5. Financials (Based on Availability)
- 16.2.6 Cerner Corporation
- 16.2.6.1. Overview
- 16.2.6.2. Products
- 16.2.6.3. SWOT Analysis
- 16.2.6.4. Recent Developments
- 16.2.6.5. Financials (Based on Availability)
- 16.2.7 MIM Software Inc
- 16.2.7.1. Overview
- 16.2.7.2. Products
- 16.2.7.3. SWOT Analysis
- 16.2.7.4. Recent Developments
- 16.2.7.5. Financials (Based on Availability)
- 16.2.8 Canon Medical Systems Corporation
- 16.2.8.1. Overview
- 16.2.8.2. Products
- 16.2.8.3. SWOT Analysis
- 16.2.8.4. Recent Developments
- 16.2.8.5. Financials (Based on Availability)
- 16.2.9 Fujifilm Holding Company
- 16.2.9.1. Overview
- 16.2.9.2. Products
- 16.2.9.3. SWOT Analysis
- 16.2.9.4. Recent Developments
- 16.2.9.5. Financials (Based on Availability)
- 16.2.10 Carestream Health Inc
- 16.2.10.1. Overview
- 16.2.10.2. Products
- 16.2.10.3. SWOT Analysis
- 16.2.10.4. Recent Developments
- 16.2.10.5. Financials (Based on Availability)
- 16.2.11 Change Healthcare
- 16.2.11.1. Overview
- 16.2.11.2. Products
- 16.2.11.3. SWOT Analysis
- 16.2.11.4. Recent Developments
- 16.2.11.5. Financials (Based on Availability)
- 16.2.12 Novarad Corporation
- 16.2.12.1. Overview
- 16.2.12.2. Products
- 16.2.12.3. SWOT Analysis
- 16.2.12.4. Recent Developments
- 16.2.12.5. Financials (Based on Availability)
- 16.2.1 Esaote SpA
List of Figures
- Figure 1: Global Medical Imaging Software Industry Revenue Breakdown (Million, %) by Region 2024 & 2032
- Figure 2: North America Medical Imaging Software Industry Revenue (Million), by Country 2024 & 2032
- Figure 3: North America Medical Imaging Software Industry Revenue Share (%), by Country 2024 & 2032
- Figure 4: Europe Medical Imaging Software Industry Revenue (Million), by Country 2024 & 2032
- Figure 5: Europe Medical Imaging Software Industry Revenue Share (%), by Country 2024 & 2032
- Figure 6: Asia Pacific Medical Imaging Software Industry Revenue (Million), by Country 2024 & 2032
- Figure 7: Asia Pacific Medical Imaging Software Industry Revenue Share (%), by Country 2024 & 2032
- Figure 8: South America Medical Imaging Software Industry Revenue (Million), by Country 2024 & 2032
- Figure 9: South America Medical Imaging Software Industry Revenue Share (%), by Country 2024 & 2032
- Figure 10: North America Medical Imaging Software Industry Revenue (Million), by Country 2024 & 2032
- Figure 11: North America Medical Imaging Software Industry Revenue Share (%), by Country 2024 & 2032
- Figure 12: MEA Medical Imaging Software Industry Revenue (Million), by Country 2024 & 2032
- Figure 13: MEA Medical Imaging Software Industry Revenue Share (%), by Country 2024 & 2032
- Figure 14: North America Medical Imaging Software Industry Revenue (Million), by Imaging Type 2024 & 2032
- Figure 15: North America Medical Imaging Software Industry Revenue Share (%), by Imaging Type 2024 & 2032
- Figure 16: North America Medical Imaging Software Industry Revenue (Million), by Application 2024 & 2032
- Figure 17: North America Medical Imaging Software Industry Revenue Share (%), by Application 2024 & 2032
- Figure 18: North America Medical Imaging Software Industry Revenue (Million), by Country 2024 & 2032
- Figure 19: North America Medical Imaging Software Industry Revenue Share (%), by Country 2024 & 2032
- Figure 20: Europe Medical Imaging Software Industry Revenue (Million), by Imaging Type 2024 & 2032
- Figure 21: Europe Medical Imaging Software Industry Revenue Share (%), by Imaging Type 2024 & 2032
- Figure 22: Europe Medical Imaging Software Industry Revenue (Million), by Application 2024 & 2032
- Figure 23: Europe Medical Imaging Software Industry Revenue Share (%), by Application 2024 & 2032
- Figure 24: Europe Medical Imaging Software Industry Revenue (Million), by Country 2024 & 2032
- Figure 25: Europe Medical Imaging Software Industry Revenue Share (%), by Country 2024 & 2032
- Figure 26: Asia Pacific Medical Imaging Software Industry Revenue (Million), by Imaging Type 2024 & 2032
- Figure 27: Asia Pacific Medical Imaging Software Industry Revenue Share (%), by Imaging Type 2024 & 2032
- Figure 28: Asia Pacific Medical Imaging Software Industry Revenue (Million), by Application 2024 & 2032
- Figure 29: Asia Pacific Medical Imaging Software Industry Revenue Share (%), by Application 2024 & 2032
- Figure 30: Asia Pacific Medical Imaging Software Industry Revenue (Million), by Country 2024 & 2032
- Figure 31: Asia Pacific Medical Imaging Software Industry Revenue Share (%), by Country 2024 & 2032
- Figure 32: Rest of the World Medical Imaging Software Industry Revenue (Million), by Imaging Type 2024 & 2032
- Figure 33: Rest of the World Medical Imaging Software Industry Revenue Share (%), by Imaging Type 2024 & 2032
- Figure 34: Rest of the World Medical Imaging Software Industry Revenue (Million), by Application 2024 & 2032
- Figure 35: Rest of the World Medical Imaging Software Industry Revenue Share (%), by Application 2024 & 2032
- Figure 36: Rest of the World Medical Imaging Software Industry Revenue (Million), by Country 2024 & 2032
- Figure 37: Rest of the World Medical Imaging Software Industry Revenue Share (%), by Country 2024 & 2032
List of Tables
- Table 1: Global Medical Imaging Software Industry Revenue Million Forecast, by Region 2019 & 2032
- Table 2: Global Medical Imaging Software Industry Revenue Million Forecast, by Imaging Type 2019 & 2032
- Table 3: Global Medical Imaging Software Industry Revenue Million Forecast, by Application 2019 & 2032
- Table 4: Global Medical Imaging Software Industry Revenue Million Forecast, by Region 2019 & 2032
- Table 5: Global Medical Imaging Software Industry Revenue Million Forecast, by Country 2019 & 2032
- Table 6: United States Medical Imaging Software Industry Revenue (Million) Forecast, by Application 2019 & 2032
- Table 7: Canada Medical Imaging Software Industry Revenue (Million) Forecast, by Application 2019 & 2032
- Table 8: Mexico Medical Imaging Software Industry Revenue (Million) Forecast, by Application 2019 & 2032
- Table 9: Global Medical Imaging Software Industry Revenue Million Forecast, by Country 2019 & 2032
- Table 10: Germany Medical Imaging Software Industry Revenue (Million) Forecast, by Application 2019 & 2032
- Table 11: United Kingdom Medical Imaging Software Industry Revenue (Million) Forecast, by Application 2019 & 2032
- Table 12: France Medical Imaging Software Industry Revenue (Million) Forecast, by Application 2019 & 2032
- Table 13: Spain Medical Imaging Software Industry Revenue (Million) Forecast, by Application 2019 & 2032
- Table 14: Italy Medical Imaging Software Industry Revenue (Million) Forecast, by Application 2019 & 2032
- Table 15: Spain Medical Imaging Software Industry Revenue (Million) Forecast, by Application 2019 & 2032
- Table 16: Belgium Medical Imaging Software Industry Revenue (Million) Forecast, by Application 2019 & 2032
- Table 17: Netherland Medical Imaging Software Industry Revenue (Million) Forecast, by Application 2019 & 2032
- Table 18: Nordics Medical Imaging Software Industry Revenue (Million) Forecast, by Application 2019 & 2032
- Table 19: Rest of Europe Medical Imaging Software Industry Revenue (Million) Forecast, by Application 2019 & 2032
- Table 20: Global Medical Imaging Software Industry Revenue Million Forecast, by Country 2019 & 2032
- Table 21: China Medical Imaging Software Industry Revenue (Million) Forecast, by Application 2019 & 2032
- Table 22: Japan Medical Imaging Software Industry Revenue (Million) Forecast, by Application 2019 & 2032
- Table 23: India Medical Imaging Software Industry Revenue (Million) Forecast, by Application 2019 & 2032
- Table 24: South Korea Medical Imaging Software Industry Revenue (Million) Forecast, by Application 2019 & 2032
- Table 25: Southeast Asia Medical Imaging Software Industry Revenue (Million) Forecast, by Application 2019 & 2032
- Table 26: Australia Medical Imaging Software Industry Revenue (Million) Forecast, by Application 2019 & 2032
- Table 27: Indonesia Medical Imaging Software Industry Revenue (Million) Forecast, by Application 2019 & 2032
- Table 28: Phillipes Medical Imaging Software Industry Revenue (Million) Forecast, by Application 2019 & 2032
- Table 29: Singapore Medical Imaging Software Industry Revenue (Million) Forecast, by Application 2019 & 2032
- Table 30: Thailandc Medical Imaging Software Industry Revenue (Million) Forecast, by Application 2019 & 2032
- Table 31: Rest of Asia Pacific Medical Imaging Software Industry Revenue (Million) Forecast, by Application 2019 & 2032
- Table 32: Global Medical Imaging Software Industry Revenue Million Forecast, by Country 2019 & 2032
- Table 33: Brazil Medical Imaging Software Industry Revenue (Million) Forecast, by Application 2019 & 2032
- Table 34: Argentina Medical Imaging Software Industry Revenue (Million) Forecast, by Application 2019 & 2032
- Table 35: Peru Medical Imaging Software Industry Revenue (Million) Forecast, by Application 2019 & 2032
- Table 36: Chile Medical Imaging Software Industry Revenue (Million) Forecast, by Application 2019 & 2032
- Table 37: Colombia Medical Imaging Software Industry Revenue (Million) Forecast, by Application 2019 & 2032
- Table 38: Ecuador Medical Imaging Software Industry Revenue (Million) Forecast, by Application 2019 & 2032
- Table 39: Venezuela Medical Imaging Software Industry Revenue (Million) Forecast, by Application 2019 & 2032
- Table 40: Rest of South America Medical Imaging Software Industry Revenue (Million) Forecast, by Application 2019 & 2032
- Table 41: Global Medical Imaging Software Industry Revenue Million Forecast, by Country 2019 & 2032
- Table 42: United States Medical Imaging Software Industry Revenue (Million) Forecast, by Application 2019 & 2032
- Table 43: Canada Medical Imaging Software Industry Revenue (Million) Forecast, by Application 2019 & 2032
- Table 44: Mexico Medical Imaging Software Industry Revenue (Million) Forecast, by Application 2019 & 2032
- Table 45: Global Medical Imaging Software Industry Revenue Million Forecast, by Country 2019 & 2032
- Table 46: United Arab Emirates Medical Imaging Software Industry Revenue (Million) Forecast, by Application 2019 & 2032
- Table 47: Saudi Arabia Medical Imaging Software Industry Revenue (Million) Forecast, by Application 2019 & 2032
- Table 48: South Africa Medical Imaging Software Industry Revenue (Million) Forecast, by Application 2019 & 2032
- Table 49: Rest of Middle East and Africa Medical Imaging Software Industry Revenue (Million) Forecast, by Application 2019 & 2032
- Table 50: Global Medical Imaging Software Industry Revenue Million Forecast, by Imaging Type 2019 & 2032
- Table 51: Global Medical Imaging Software Industry Revenue Million Forecast, by Application 2019 & 2032
- Table 52: Global Medical Imaging Software Industry Revenue Million Forecast, by Country 2019 & 2032
- Table 53: United States Medical Imaging Software Industry Revenue (Million) Forecast, by Application 2019 & 2032
- Table 54: Canada Medical Imaging Software Industry Revenue (Million) Forecast, by Application 2019 & 2032
- Table 55: Global Medical Imaging Software Industry Revenue Million Forecast, by Imaging Type 2019 & 2032
- Table 56: Global Medical Imaging Software Industry Revenue Million Forecast, by Application 2019 & 2032
- Table 57: Global Medical Imaging Software Industry Revenue Million Forecast, by Country 2019 & 2032
- Table 58: Germany Medical Imaging Software Industry Revenue (Million) Forecast, by Application 2019 & 2032
- Table 59: France Medical Imaging Software Industry Revenue (Million) Forecast, by Application 2019 & 2032
- Table 60: United Kingdom Medical Imaging Software Industry Revenue (Million) Forecast, by Application 2019 & 2032
- Table 61: Rest of Europe Medical Imaging Software Industry Revenue (Million) Forecast, by Application 2019 & 2032
- Table 62: Global Medical Imaging Software Industry Revenue Million Forecast, by Imaging Type 2019 & 2032
- Table 63: Global Medical Imaging Software Industry Revenue Million Forecast, by Application 2019 & 2032
- Table 64: Global Medical Imaging Software Industry Revenue Million Forecast, by Country 2019 & 2032
- Table 65: China Medical Imaging Software Industry Revenue (Million) Forecast, by Application 2019 & 2032
- Table 66: Japan Medical Imaging Software Industry Revenue (Million) Forecast, by Application 2019 & 2032
- Table 67: India Medical Imaging Software Industry Revenue (Million) Forecast, by Application 2019 & 2032
- Table 68: Rest of Asia Pacific Medical Imaging Software Industry Revenue (Million) Forecast, by Application 2019 & 2032
- Table 69: Global Medical Imaging Software Industry Revenue Million Forecast, by Imaging Type 2019 & 2032
- Table 70: Global Medical Imaging Software Industry Revenue Million Forecast, by Application 2019 & 2032
- Table 71: Global Medical Imaging Software Industry Revenue Million Forecast, by Country 2019 & 2032
- Table 72: Latin America Medical Imaging Software Industry Revenue (Million) Forecast, by Application 2019 & 2032
- Table 73: Middle East Medical Imaging Software Industry Revenue (Million) Forecast, by Application 2019 & 2032
Frequently Asked Questions
1. What is the projected Compound Annual Growth Rate (CAGR) of the Medical Imaging Software Industry?
The projected CAGR is approximately 7.84%.
2. Which companies are prominent players in the Medical Imaging Software Industry?
Key companies in the market include Esaote SpA, Siemens Healthcare, General Healthcare Company (GE), Koninklijke Philips N V, Agfa Gevaert HealthCare, Cerner Corporation, MIM Software Inc, Canon Medical Systems Corporation, Fujifilm Holding Company, Carestream Health Inc, Change Healthcare, Novarad Corporation.
3. What are the main segments of the Medical Imaging Software Industry?
The market segments include Imaging Type, Application.
4. Can you provide details about the market size?
The market size is estimated to be USD 8.11 Million as of 2022.
5. What are some drivers contributing to market growth?
Growing Application of Computer-Aided Diagnostic Methods.
6. What are the notable trends driving market growth?
Cardiology Applications Segment Holds Major Market Share.
7. Are there any restraints impacting market growth?
Dearth of Skilled Professionals and High Set-up Cost of the Equipment.
8. Can you provide examples of recent developments in the market?
February 2022 - The European Society of Radiology and GE Healthcare have renewed their strategic partnership for the online European Congress of Radiology ECR 2022 on March 2-6, 2022, and onsite ECR 2022 on July 13-17 in Vienna, Austria. GE Healthcare would focus its efforts on three strategic pillars, digital and artificial intelligence, patient experience, and sustainability & resilience.
9. What pricing options are available for accessing the report?
Pricing options include single-user, multi-user, and enterprise licenses priced at USD 4750, USD 5250, and USD 8750 respectively.
10. Is the market size provided in terms of value or volume?
The market size is provided in terms of value, measured in Million.
11. Are there any specific market keywords associated with the report?
Yes, the market keyword associated with the report is "Medical Imaging Software Industry," which aids in identifying and referencing the specific market segment covered.
12. How do I determine which pricing option suits my needs best?
The pricing options vary based on user requirements and access needs. Individual users may opt for single-user licenses, while businesses requiring broader access may choose multi-user or enterprise licenses for cost-effective access to the report.
13. Are there any additional resources or data provided in the Medical Imaging Software Industry report?
While the report offers comprehensive insights, it's advisable to review the specific contents or supplementary materials provided to ascertain if additional resources or data are available.
14. How can I stay updated on further developments or reports in the Medical Imaging Software Industry?
To stay informed about further developments, trends, and reports in the Medical Imaging Software Industry, consider subscribing to industry newsletters, following relevant companies and organizations, or regularly checking reputable industry news sources and publications.
Methodology
Step 1 - Identification of Relevant Samples Size from Population Database


Step 2 - Approaches for Defining Global Market Size (Value, Volume* & Price*)

Note*: In applicable scenarios
Step 3 - Data Sources
Primary Research
- Web Analytics
- Survey Reports
- Research Institute
- Latest Research Reports
- Opinion Leaders
Secondary Research
- Annual Reports
- White Paper
- Latest Press Release
- Industry Association
- Paid Database
- Investor Presentations

Step 4 - Data Triangulation
Involves using different sources of information in order to increase the validity of a study
These sources are likely to be stakeholders in a program - participants, other researchers, program staff, other community members, and so on.
Then we put all data in single framework & apply various statistical tools to find out the dynamic on the market.
During the analysis stage, feedback from the stakeholder groups would be compared to determine areas of agreement as well as areas of divergence
