

Key Insights
The MEA Functional Beverages market, while exhibiting a smaller scale compared to global giants, presents a promising growth trajectory fueled by rising health consciousness and disposable incomes. The market's expansion is driven by increasing awareness of health and wellness, a preference for convenient and nutritious alternatives to sugary drinks, and the growing adoption of active lifestyles across the region. Key product segments like energy drinks and sports drinks are expected to witness significant growth, driven by the popularity of fitness activities and athletic pursuits, particularly among younger demographics. However, challenges remain, including fluctuating raw material prices, varying levels of consumer purchasing power across different MEA nations, and the need to overcome potential cultural barriers to the acceptance of certain beverage types. Distribution channels are evolving, with online retail stores witnessing increasing penetration, albeit from a smaller base than traditional channels like supermarkets and pharmacies. This digital shift presents opportunities for businesses to reach broader consumer bases and tailor their marketing strategies accordingly. The presence of established international players like Coca-Cola and PepsiCo, alongside regional brands, indicates a dynamic competitive landscape where both innovation and effective distribution strategies will be crucial for success.
The forecast period (2025-2033) anticipates a continued, albeit moderated, expansion for the MEA functional beverages market. This growth will likely be uneven across different sub-regions, with more affluent nations potentially exhibiting higher growth rates than those with lower per capita incomes. The continued rise in health concerns, coupled with strategic marketing and product innovation, focusing on natural ingredients and functional benefits tailored to regional preferences, will be vital for companies to capture a significant share of this growing market. The increasing focus on sustainability and ethical sourcing will also impact market dynamics, influencing consumer choices and pushing businesses to adopt eco-friendly practices throughout their supply chains. Companies should carefully consider these factors when developing long-term strategies for success in the MEA functional beverages landscape.
MEA Functional Beverages Industry: A Comprehensive Market Report (2019-2033)
This insightful report provides a detailed analysis of the Middle East and Africa (MEA) functional beverages industry, offering a comprehensive overview of market trends, competitive landscape, and future growth prospects. Covering the period from 2019 to 2033, with a focus on 2025, this report is an essential resource for stakeholders seeking to understand and capitalize on opportunities within this dynamic sector. The total market value in 2025 is estimated at xx Million, projected to reach xx Million by 2033.
MEA Functional Beverages Industry Market Composition & Trends
This section delves into the intricate composition of the MEA functional beverage market, analyzing key aspects that shape its trajectory. The market is characterized by a moderate level of concentration, with key players such as Nestle SA, PepsiCo Inc, and The Coca-Cola Company holding significant market share, though a fragmented landscape also exists with many smaller players. Innovation is driven by evolving consumer preferences towards healthier and more functional beverages, necessitating continuous product development and diversification.
- Market Concentration: The top five players control approximately xx% of the market share in 2025, indicating a moderately concentrated market.
- Innovation Catalysts: Growing demand for natural ingredients, functional benefits (e.g., immunity boost, enhanced energy), and sustainable packaging are primary drivers of innovation.
- Regulatory Landscape: Varying regulations across MEA countries regarding food additives, labeling, and health claims influence product development and marketing strategies.
- Substitute Products: Competition stems from other beverage categories like juices, soft drinks, and water, influencing pricing and product differentiation.
- End-User Profiles: The target audience comprises health-conscious consumers, athletes, and individuals seeking convenient sources of nutrition and energy.
- M&A Activities: The industry has witnessed xx Million in M&A deal values from 2019-2024, with strategic acquisitions aiming to expand product portfolios and geographic reach. Examples include (but are not limited to) smaller brands acquired by larger corporations to expand their presence.
MEA Functional Beverages Industry Industry Evolution
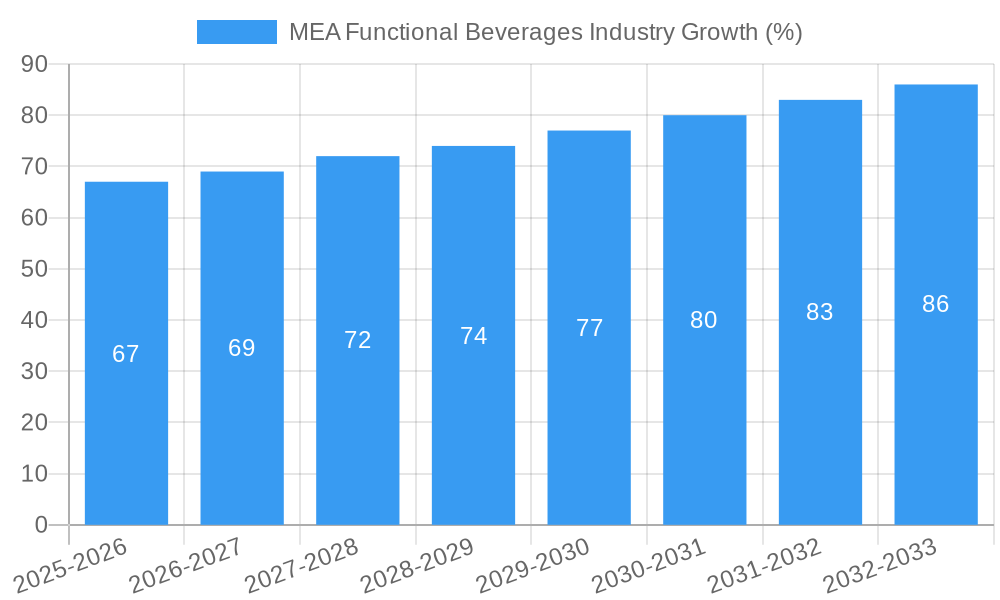
The MEA functional beverages market has experienced significant growth from 2019-2024, driven by rising health awareness, increasing disposable incomes, and urbanization. Technological advancements in production and packaging have enabled cost efficiencies and broader product availability. Consumer demand shifts towards natural, low-sugar, and functional beverages, prompting companies to reformulate existing products and develop new offerings. The average annual growth rate during the historical period (2019-2024) was approximately xx%, while the forecast period (2025-2033) predicts a growth rate of xx%. This growth is further fueled by the rising popularity of sports and fitness activities across the region, along with increased awareness of the health benefits associated with functional beverages.
Leading Regions, Countries, or Segments in MEA Functional Beverages Industry
The MEA functional beverage market presents diverse growth opportunities across various segments and geographical areas.
Dominant Segments:
- Product Type: Energy drinks currently hold the largest market share, driven by high demand amongst younger demographics, followed by sports drinks and fortified juices.
- Distribution Channel: Supermarket/hypermarkets represent the most significant distribution channel, followed by convenience stores. Online retail stores are experiencing rapid growth, although penetration remains relatively low compared to traditional channels.
Key Drivers:
- Investment Trends: Significant investments in product development, marketing, and distribution infrastructure are driving market expansion.
- Regulatory Support: Supportive government policies and initiatives aimed at promoting healthy lifestyles indirectly contribute to the growth of functional beverages.
Dominant Regions/Countries: The UAE, Saudi Arabia, and South Africa are currently the leading markets, driven by higher disposable incomes and rising health consciousness.
MEA Functional Beverages Industry Product Innovations
Recent innovations include the launch of hemp-based energy drinks (PepsiCo's Rockstar Energy), organic and low-calorie carbonated energy beverages (Perrier Energize), and sports drinks fortified with essential vitamins (iPRO). These offerings highlight the trend towards healthier, more functional, and naturally-derived products. Technological advancements in production processes enable cost-effective manufacturing and enhanced product quality. Unique selling propositions center around natural ingredients, functional benefits, and convenient packaging formats.
Propelling Factors for MEA Functional Beverages Industry Growth
The MEA functional beverage industry’s growth is propelled by several key factors:
- Rising Health Consciousness: Increasing awareness of health and wellness is fueling demand for functional beverages offering health benefits.
- Growing Disposable Incomes: Rising disposable incomes in several MEA countries enable consumers to afford premium functional beverages.
- Urbanization and Changing Lifestyles: Urbanization and busy lifestyles are driving demand for convenient and on-the-go beverage options.
- Technological Advancements: Innovations in product formulation, packaging, and distribution enhance product appeal and accessibility.
- Government Initiatives: Government initiatives promoting healthy lifestyles and supporting the food and beverage industry are boosting market growth.
Obstacles in the MEA Functional Beverages Industry Market
Several challenges hinder market growth:
- Stringent Regulations: Complex and sometimes inconsistent regulatory requirements across different MEA countries can increase compliance costs.
- Supply Chain Disruptions: Geopolitical instability and supply chain disruptions can impact raw material availability and pricing.
- Intense Competition: The market is intensely competitive, with established players and new entrants vying for market share, leading to price wars and reduced profit margins.
Future Opportunities in MEA Functional Beverages Industry
Future opportunities include:
- Expansion into Underserved Markets: Further penetration into less developed markets in the MEA region offers significant growth potential.
- Innovation in Product Formulations: Developing new and innovative product formulations, focusing on natural and organic ingredients, caters to evolving consumer preferences.
- Leveraging E-commerce: Expanding online sales channels can increase market reach and access to new customer segments.
- Focus on Sustainability: Adopting sustainable practices in production and packaging will appeal to environmentally conscious consumers.
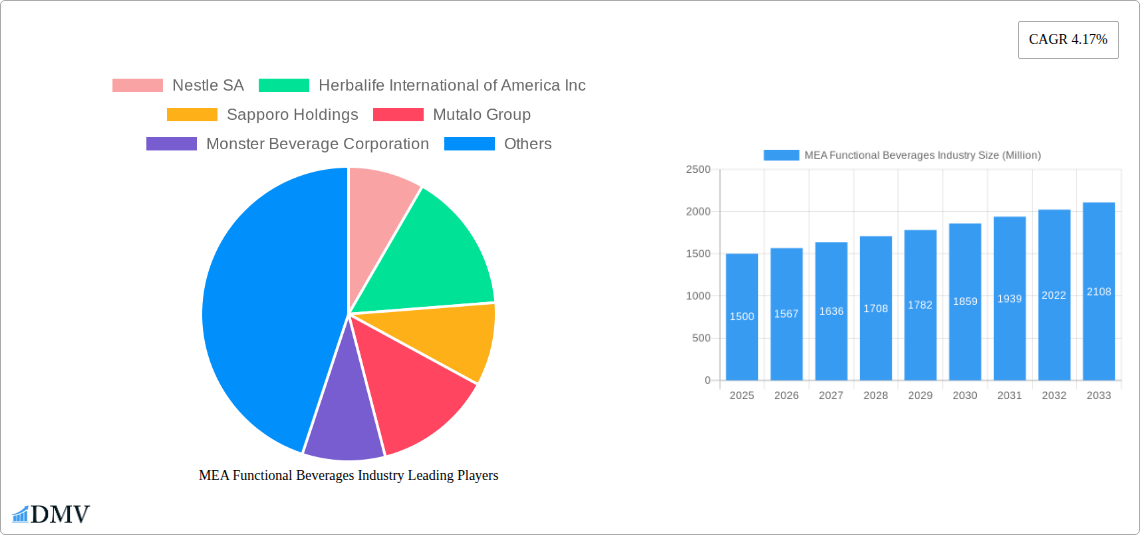
Major Players in the MEA Functional Beverages Industry Ecosystem
- Nestle SA
- Herbalife International of America Inc
- Sapporo Holdings
- Mutalo Group
- Monster Beverage Corporation
- PepsiCo Inc
- Dr Pepper Snapple
- Viju Industries Nigeria Ltd
- iPRO Sport Distribution Limited
- Red Bull GmbH
- The Coca-Cola Company
Key Developments in MEA Functional Beverages Industry Industry
- October 2022: iPRO launched a range of sports drinks in Carrefour stores across the UAE, featuring 100% of the daily recommended vitamin C intake and added B vitamins. This launch significantly expanded iPRO's retail presence and product line in a key MEA market.
- February 2022: PepsiCo launched its new hemp-based energy drink lineup, "Rockstar Energy," in the Middle East, offering a lower-caffeine alternative with three distinct flavors. This innovation caters to the growing demand for healthier energy drink options.
- March 2021: Perrier launched its first carbonated energy beverages, "Perrier Energize," in Saudi Arabia, an organic, low-calorie option with coffee and yerba mate extracts. This introduction diversified Perrier's product portfolio and tapped into the burgeoning demand for healthier energy alternatives.
Strategic MEA Functional Beverages Industry Market Forecast
The MEA functional beverage market is poised for robust growth over the forecast period (2025-2033), driven by sustained consumer demand for healthier options, innovative product launches, and expanding distribution networks. Continued investment in research and development, focused on natural ingredients and functional benefits, will be critical for success. The market’s potential is vast, with untapped opportunities in diverse geographical areas and consumer segments. The predicted growth rate, driven by factors outlined in previous sections, sets the stage for a significant expansion of the industry in the coming years.
MEA Functional Beverages Industry Segmentation
-
1. Product Type
- 1.1. Energy Drinks
- 1.2. Fortified Juice
- 1.3. Sports Drinks
- 1.4. Dairy-based Drinks
- 1.5. Other Product Types
-
2. Distribution Channel
- 2.1. Supermarket/Hypermarket
- 2.2. Pharmacies and Health Stores
- 2.3. Convenience Stores
- 2.4. Online Retail Stores
- 2.5. Other Distribution Channels
-
3. Geography
- 3.1. South Africa
- 3.2. Saudi Arabia
- 3.3. Rest of Middle-East and Africa
MEA Functional Beverages Industry Segmentation By Geography
- 1. South Africa
- 2. Saudi Arabia
- 3. Rest of Middle East and Africa
MEA Functional Beverages Industry REPORT HIGHLIGHTS
| Aspects | Details |
|---|---|
| Study Period | 2019-2033 |
| Base Year | 2024 |
| Estimated Year | 2025 |
| Forecast Period | 2025-2033 |
| Historical Period | 2019-2024 |
| Growth Rate | CAGR of 4.17% from 2019-2033 |
| Segmentation |
|
Table of Contents
- 1. Introduction
- 1.1. Research Scope
- 1.2. Market Segmentation
- 1.3. Research Methodology
- 1.4. Definitions and Assumptions
- 2. Executive Summary
- 2.1. Introduction
- 3. Market Dynamics
- 3.1. Introduction
- 3.2. Market Drivers
- 3.2.1. Preference for Plant-based and Clean-label RTD Products; Consumer Inclination Toward Sugar-Free Drinks
- 3.3. Market Restrains
- 3.3.1. Concerns Over Health Issues Associated With Beverages
- 3.4. Market Trends
- 3.4.1. Growing Demand for Plant-based and Lactose-free Products
- 4. Market Factor Analysis
- 4.1. Porters Five Forces
- 4.2. Supply/Value Chain
- 4.3. PESTEL analysis
- 4.4. Market Entropy
- 4.5. Patent/Trademark Analysis
- 5. Global MEA Functional Beverages Industry Analysis, Insights and Forecast, 2019-2031
- 5.1. Market Analysis, Insights and Forecast - by Product Type
- 5.1.1. Energy Drinks
- 5.1.2. Fortified Juice
- 5.1.3. Sports Drinks
- 5.1.4. Dairy-based Drinks
- 5.1.5. Other Product Types
- 5.2. Market Analysis, Insights and Forecast - by Distribution Channel
- 5.2.1. Supermarket/Hypermarket
- 5.2.2. Pharmacies and Health Stores
- 5.2.3. Convenience Stores
- 5.2.4. Online Retail Stores
- 5.2.5. Other Distribution Channels
- 5.3. Market Analysis, Insights and Forecast - by Geography
- 5.3.1. South Africa
- 5.3.2. Saudi Arabia
- 5.3.3. Rest of Middle-East and Africa
- 5.4. Market Analysis, Insights and Forecast - by Region
- 5.4.1. South Africa
- 5.4.2. Saudi Arabia
- 5.4.3. Rest of Middle East and Africa
- 5.1. Market Analysis, Insights and Forecast - by Product Type
- 6. South Africa MEA Functional Beverages Industry Analysis, Insights and Forecast, 2019-2031
- 6.1. Market Analysis, Insights and Forecast - by Product Type
- 6.1.1. Energy Drinks
- 6.1.2. Fortified Juice
- 6.1.3. Sports Drinks
- 6.1.4. Dairy-based Drinks
- 6.1.5. Other Product Types
- 6.2. Market Analysis, Insights and Forecast - by Distribution Channel
- 6.2.1. Supermarket/Hypermarket
- 6.2.2. Pharmacies and Health Stores
- 6.2.3. Convenience Stores
- 6.2.4. Online Retail Stores
- 6.2.5. Other Distribution Channels
- 6.3. Market Analysis, Insights and Forecast - by Geography
- 6.3.1. South Africa
- 6.3.2. Saudi Arabia
- 6.3.3. Rest of Middle-East and Africa
- 6.1. Market Analysis, Insights and Forecast - by Product Type
- 7. Saudi Arabia MEA Functional Beverages Industry Analysis, Insights and Forecast, 2019-2031
- 7.1. Market Analysis, Insights and Forecast - by Product Type
- 7.1.1. Energy Drinks
- 7.1.2. Fortified Juice
- 7.1.3. Sports Drinks
- 7.1.4. Dairy-based Drinks
- 7.1.5. Other Product Types
- 7.2. Market Analysis, Insights and Forecast - by Distribution Channel
- 7.2.1. Supermarket/Hypermarket
- 7.2.2. Pharmacies and Health Stores
- 7.2.3. Convenience Stores
- 7.2.4. Online Retail Stores
- 7.2.5. Other Distribution Channels
- 7.3. Market Analysis, Insights and Forecast - by Geography
- 7.3.1. South Africa
- 7.3.2. Saudi Arabia
- 7.3.3. Rest of Middle-East and Africa
- 7.1. Market Analysis, Insights and Forecast - by Product Type
- 8. Rest of Middle East and Africa MEA Functional Beverages Industry Analysis, Insights and Forecast, 2019-2031
- 8.1. Market Analysis, Insights and Forecast - by Product Type
- 8.1.1. Energy Drinks
- 8.1.2. Fortified Juice
- 8.1.3. Sports Drinks
- 8.1.4. Dairy-based Drinks
- 8.1.5. Other Product Types
- 8.2. Market Analysis, Insights and Forecast - by Distribution Channel
- 8.2.1. Supermarket/Hypermarket
- 8.2.2. Pharmacies and Health Stores
- 8.2.3. Convenience Stores
- 8.2.4. Online Retail Stores
- 8.2.5. Other Distribution Channels
- 8.3. Market Analysis, Insights and Forecast - by Geography
- 8.3.1. South Africa
- 8.3.2. Saudi Arabia
- 8.3.3. Rest of Middle-East and Africa
- 8.1. Market Analysis, Insights and Forecast - by Product Type
- 9. North America MEA Functional Beverages Industry Analysis, Insights and Forecast, 2019-2031
- 9.1. Market Analysis, Insights and Forecast - By Country/Sub-region
- 9.1.1 United States
- 9.1.2 Canada
- 9.1.3 Mexico
- 10. Europe MEA Functional Beverages Industry Analysis, Insights and Forecast, 2019-2031
- 10.1. Market Analysis, Insights and Forecast - By Country/Sub-region
- 10.1.1 Germany
- 10.1.2 United Kingdom
- 10.1.3 France
- 10.1.4 Spain
- 10.1.5 Italy
- 10.1.6 Spain
- 10.1.7 Belgium
- 10.1.8 Netherland
- 10.1.9 Nordics
- 10.1.10 Rest of Europe
- 11. Asia Pacific MEA Functional Beverages Industry Analysis, Insights and Forecast, 2019-2031
- 11.1. Market Analysis, Insights and Forecast - By Country/Sub-region
- 11.1.1 China
- 11.1.2 Japan
- 11.1.3 India
- 11.1.4 South Korea
- 11.1.5 Southeast Asia
- 11.1.6 Australia
- 11.1.7 Indonesia
- 11.1.8 Phillipes
- 11.1.9 Singapore
- 11.1.10 Thailandc
- 11.1.11 Rest of Asia Pacific
- 12. South America MEA Functional Beverages Industry Analysis, Insights and Forecast, 2019-2031
- 12.1. Market Analysis, Insights and Forecast - By Country/Sub-region
- 12.1.1 Brazil
- 12.1.2 Argentina
- 12.1.3 Peru
- 12.1.4 Chile
- 12.1.5 Colombia
- 12.1.6 Ecuador
- 12.1.7 Venezuela
- 12.1.8 Rest of South America
- 13. North America MEA Functional Beverages Industry Analysis, Insights and Forecast, 2019-2031
- 13.1. Market Analysis, Insights and Forecast - By Country/Sub-region
- 13.1.1 United States
- 13.1.2 Canada
- 13.1.3 Mexico
- 14. MEA MEA Functional Beverages Industry Analysis, Insights and Forecast, 2019-2031
- 14.1. Market Analysis, Insights and Forecast - By Country/Sub-region
- 14.1.1 United Arab Emirates
- 14.1.2 Saudi Arabia
- 14.1.3 South Africa
- 14.1.4 Rest of Middle East and Africa
- 15. Competitive Analysis
- 15.1. Global Market Share Analysis 2024
- 15.2. Company Profiles
- 15.2.1 Nestle SA
- 15.2.1.1. Overview
- 15.2.1.2. Products
- 15.2.1.3. SWOT Analysis
- 15.2.1.4. Recent Developments
- 15.2.1.5. Financials (Based on Availability)
- 15.2.2 Herbalife International of America Inc
- 15.2.2.1. Overview
- 15.2.2.2. Products
- 15.2.2.3. SWOT Analysis
- 15.2.2.4. Recent Developments
- 15.2.2.5. Financials (Based on Availability)
- 15.2.3 Sapporo Holdings
- 15.2.3.1. Overview
- 15.2.3.2. Products
- 15.2.3.3. SWOT Analysis
- 15.2.3.4. Recent Developments
- 15.2.3.5. Financials (Based on Availability)
- 15.2.4 Mutalo Group
- 15.2.4.1. Overview
- 15.2.4.2. Products
- 15.2.4.3. SWOT Analysis
- 15.2.4.4. Recent Developments
- 15.2.4.5. Financials (Based on Availability)
- 15.2.5 Monster Beverage Corporation
- 15.2.5.1. Overview
- 15.2.5.2. Products
- 15.2.5.3. SWOT Analysis
- 15.2.5.4. Recent Developments
- 15.2.5.5. Financials (Based on Availability)
- 15.2.6 PepsiCo Inc
- 15.2.6.1. Overview
- 15.2.6.2. Products
- 15.2.6.3. SWOT Analysis
- 15.2.6.4. Recent Developments
- 15.2.6.5. Financials (Based on Availability)
- 15.2.7 Dr Pepper Snapple
- 15.2.7.1. Overview
- 15.2.7.2. Products
- 15.2.7.3. SWOT Analysis
- 15.2.7.4. Recent Developments
- 15.2.7.5. Financials (Based on Availability)
- 15.2.8 Viju Industries Nigeria Ltd
- 15.2.8.1. Overview
- 15.2.8.2. Products
- 15.2.8.3. SWOT Analysis
- 15.2.8.4. Recent Developments
- 15.2.8.5. Financials (Based on Availability)
- 15.2.9 iPRO Sport Distribution Limited*List Not Exhaustive
- 15.2.9.1. Overview
- 15.2.9.2. Products
- 15.2.9.3. SWOT Analysis
- 15.2.9.4. Recent Developments
- 15.2.9.5. Financials (Based on Availability)
- 15.2.10 Red Bull GmbH
- 15.2.10.1. Overview
- 15.2.10.2. Products
- 15.2.10.3. SWOT Analysis
- 15.2.10.4. Recent Developments
- 15.2.10.5. Financials (Based on Availability)
- 15.2.11 The Coca-Cola Company
- 15.2.11.1. Overview
- 15.2.11.2. Products
- 15.2.11.3. SWOT Analysis
- 15.2.11.4. Recent Developments
- 15.2.11.5. Financials (Based on Availability)
- 15.2.1 Nestle SA
List of Figures
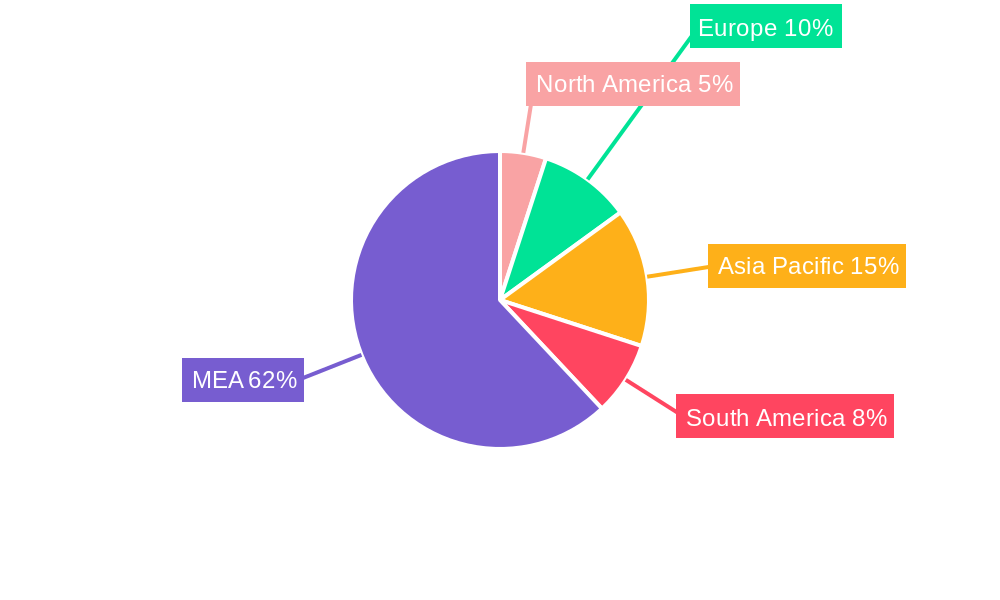
- Figure 1: Global MEA Functional Beverages Industry Revenue Breakdown (Million, %) by Region 2024 & 2032
- Figure 2: North America MEA Functional Beverages Industry Revenue (Million), by Country 2024 & 2032
- Figure 3: North America MEA Functional Beverages Industry Revenue Share (%), by Country 2024 & 2032
- Figure 4: Europe MEA Functional Beverages Industry Revenue (Million), by Country 2024 & 2032
- Figure 5: Europe MEA Functional Beverages Industry Revenue Share (%), by Country 2024 & 2032
- Figure 6: Asia Pacific MEA Functional Beverages Industry Revenue (Million), by Country 2024 & 2032
- Figure 7: Asia Pacific MEA Functional Beverages Industry Revenue Share (%), by Country 2024 & 2032
- Figure 8: South America MEA Functional Beverages Industry Revenue (Million), by Country 2024 & 2032
- Figure 9: South America MEA Functional Beverages Industry Revenue Share (%), by Country 2024 & 2032
- Figure 10: North America MEA Functional Beverages Industry Revenue (Million), by Country 2024 & 2032
- Figure 11: North America MEA Functional Beverages Industry Revenue Share (%), by Country 2024 & 2032
- Figure 12: MEA MEA Functional Beverages Industry Revenue (Million), by Country 2024 & 2032
- Figure 13: MEA MEA Functional Beverages Industry Revenue Share (%), by Country 2024 & 2032
- Figure 14: South Africa MEA Functional Beverages Industry Revenue (Million), by Product Type 2024 & 2032
- Figure 15: South Africa MEA Functional Beverages Industry Revenue Share (%), by Product Type 2024 & 2032
- Figure 16: South Africa MEA Functional Beverages Industry Revenue (Million), by Distribution Channel 2024 & 2032
- Figure 17: South Africa MEA Functional Beverages Industry Revenue Share (%), by Distribution Channel 2024 & 2032
- Figure 18: South Africa MEA Functional Beverages Industry Revenue (Million), by Geography 2024 & 2032
- Figure 19: South Africa MEA Functional Beverages Industry Revenue Share (%), by Geography 2024 & 2032
- Figure 20: South Africa MEA Functional Beverages Industry Revenue (Million), by Country 2024 & 2032
- Figure 21: South Africa MEA Functional Beverages Industry Revenue Share (%), by Country 2024 & 2032
- Figure 22: Saudi Arabia MEA Functional Beverages Industry Revenue (Million), by Product Type 2024 & 2032
- Figure 23: Saudi Arabia MEA Functional Beverages Industry Revenue Share (%), by Product Type 2024 & 2032
- Figure 24: Saudi Arabia MEA Functional Beverages Industry Revenue (Million), by Distribution Channel 2024 & 2032
- Figure 25: Saudi Arabia MEA Functional Beverages Industry Revenue Share (%), by Distribution Channel 2024 & 2032
- Figure 26: Saudi Arabia MEA Functional Beverages Industry Revenue (Million), by Geography 2024 & 2032
- Figure 27: Saudi Arabia MEA Functional Beverages Industry Revenue Share (%), by Geography 2024 & 2032
- Figure 28: Saudi Arabia MEA Functional Beverages Industry Revenue (Million), by Country 2024 & 2032
- Figure 29: Saudi Arabia MEA Functional Beverages Industry Revenue Share (%), by Country 2024 & 2032
- Figure 30: Rest of Middle East and Africa MEA Functional Beverages Industry Revenue (Million), by Product Type 2024 & 2032
- Figure 31: Rest of Middle East and Africa MEA Functional Beverages Industry Revenue Share (%), by Product Type 2024 & 2032
- Figure 32: Rest of Middle East and Africa MEA Functional Beverages Industry Revenue (Million), by Distribution Channel 2024 & 2032
- Figure 33: Rest of Middle East and Africa MEA Functional Beverages Industry Revenue Share (%), by Distribution Channel 2024 & 2032
- Figure 34: Rest of Middle East and Africa MEA Functional Beverages Industry Revenue (Million), by Geography 2024 & 2032
- Figure 35: Rest of Middle East and Africa MEA Functional Beverages Industry Revenue Share (%), by Geography 2024 & 2032
- Figure 36: Rest of Middle East and Africa MEA Functional Beverages Industry Revenue (Million), by Country 2024 & 2032
- Figure 37: Rest of Middle East and Africa MEA Functional Beverages Industry Revenue Share (%), by Country 2024 & 2032
List of Tables
- Table 1: Global MEA Functional Beverages Industry Revenue Million Forecast, by Region 2019 & 2032
- Table 2: Global MEA Functional Beverages Industry Revenue Million Forecast, by Product Type 2019 & 2032
- Table 3: Global MEA Functional Beverages Industry Revenue Million Forecast, by Distribution Channel 2019 & 2032
- Table 4: Global MEA Functional Beverages Industry Revenue Million Forecast, by Geography 2019 & 2032
- Table 5: Global MEA Functional Beverages Industry Revenue Million Forecast, by Region 2019 & 2032
- Table 6: Global MEA Functional Beverages Industry Revenue Million Forecast, by Country 2019 & 2032
- Table 7: United States MEA Functional Beverages Industry Revenue (Million) Forecast, by Application 2019 & 2032
- Table 8: Canada MEA Functional Beverages Industry Revenue (Million) Forecast, by Application 2019 & 2032
- Table 9: Mexico MEA Functional Beverages Industry Revenue (Million) Forecast, by Application 2019 & 2032
- Table 10: Global MEA Functional Beverages Industry Revenue Million Forecast, by Country 2019 & 2032
- Table 11: Germany MEA Functional Beverages Industry Revenue (Million) Forecast, by Application 2019 & 2032
- Table 12: United Kingdom MEA Functional Beverages Industry Revenue (Million) Forecast, by Application 2019 & 2032
- Table 13: France MEA Functional Beverages Industry Revenue (Million) Forecast, by Application 2019 & 2032
- Table 14: Spain MEA Functional Beverages Industry Revenue (Million) Forecast, by Application 2019 & 2032
- Table 15: Italy MEA Functional Beverages Industry Revenue (Million) Forecast, by Application 2019 & 2032
- Table 16: Spain MEA Functional Beverages Industry Revenue (Million) Forecast, by Application 2019 & 2032
- Table 17: Belgium MEA Functional Beverages Industry Revenue (Million) Forecast, by Application 2019 & 2032
- Table 18: Netherland MEA Functional Beverages Industry Revenue (Million) Forecast, by Application 2019 & 2032
- Table 19: Nordics MEA Functional Beverages Industry Revenue (Million) Forecast, by Application 2019 & 2032
- Table 20: Rest of Europe MEA Functional Beverages Industry Revenue (Million) Forecast, by Application 2019 & 2032
- Table 21: Global MEA Functional Beverages Industry Revenue Million Forecast, by Country 2019 & 2032
- Table 22: China MEA Functional Beverages Industry Revenue (Million) Forecast, by Application 2019 & 2032
- Table 23: Japan MEA Functional Beverages Industry Revenue (Million) Forecast, by Application 2019 & 2032
- Table 24: India MEA Functional Beverages Industry Revenue (Million) Forecast, by Application 2019 & 2032
- Table 25: South Korea MEA Functional Beverages Industry Revenue (Million) Forecast, by Application 2019 & 2032
- Table 26: Southeast Asia MEA Functional Beverages Industry Revenue (Million) Forecast, by Application 2019 & 2032
- Table 27: Australia MEA Functional Beverages Industry Revenue (Million) Forecast, by Application 2019 & 2032
- Table 28: Indonesia MEA Functional Beverages Industry Revenue (Million) Forecast, by Application 2019 & 2032
- Table 29: Phillipes MEA Functional Beverages Industry Revenue (Million) Forecast, by Application 2019 & 2032
- Table 30: Singapore MEA Functional Beverages Industry Revenue (Million) Forecast, by Application 2019 & 2032
- Table 31: Thailandc MEA Functional Beverages Industry Revenue (Million) Forecast, by Application 2019 & 2032
- Table 32: Rest of Asia Pacific MEA Functional Beverages Industry Revenue (Million) Forecast, by Application 2019 & 2032
- Table 33: Global MEA Functional Beverages Industry Revenue Million Forecast, by Country 2019 & 2032
- Table 34: Brazil MEA Functional Beverages Industry Revenue (Million) Forecast, by Application 2019 & 2032
- Table 35: Argentina MEA Functional Beverages Industry Revenue (Million) Forecast, by Application 2019 & 2032
- Table 36: Peru MEA Functional Beverages Industry Revenue (Million) Forecast, by Application 2019 & 2032
- Table 37: Chile MEA Functional Beverages Industry Revenue (Million) Forecast, by Application 2019 & 2032
- Table 38: Colombia MEA Functional Beverages Industry Revenue (Million) Forecast, by Application 2019 & 2032
- Table 39: Ecuador MEA Functional Beverages Industry Revenue (Million) Forecast, by Application 2019 & 2032
- Table 40: Venezuela MEA Functional Beverages Industry Revenue (Million) Forecast, by Application 2019 & 2032
- Table 41: Rest of South America MEA Functional Beverages Industry Revenue (Million) Forecast, by Application 2019 & 2032
- Table 42: Global MEA Functional Beverages Industry Revenue Million Forecast, by Country 2019 & 2032
- Table 43: United States MEA Functional Beverages Industry Revenue (Million) Forecast, by Application 2019 & 2032
- Table 44: Canada MEA Functional Beverages Industry Revenue (Million) Forecast, by Application 2019 & 2032
- Table 45: Mexico MEA Functional Beverages Industry Revenue (Million) Forecast, by Application 2019 & 2032
- Table 46: Global MEA Functional Beverages Industry Revenue Million Forecast, by Country 2019 & 2032
- Table 47: United Arab Emirates MEA Functional Beverages Industry Revenue (Million) Forecast, by Application 2019 & 2032
- Table 48: Saudi Arabia MEA Functional Beverages Industry Revenue (Million) Forecast, by Application 2019 & 2032
- Table 49: South Africa MEA Functional Beverages Industry Revenue (Million) Forecast, by Application 2019 & 2032
- Table 50: Rest of Middle East and Africa MEA Functional Beverages Industry Revenue (Million) Forecast, by Application 2019 & 2032
- Table 51: Global MEA Functional Beverages Industry Revenue Million Forecast, by Product Type 2019 & 2032
- Table 52: Global MEA Functional Beverages Industry Revenue Million Forecast, by Distribution Channel 2019 & 2032
- Table 53: Global MEA Functional Beverages Industry Revenue Million Forecast, by Geography 2019 & 2032
- Table 54: Global MEA Functional Beverages Industry Revenue Million Forecast, by Country 2019 & 2032
- Table 55: Global MEA Functional Beverages Industry Revenue Million Forecast, by Product Type 2019 & 2032
- Table 56: Global MEA Functional Beverages Industry Revenue Million Forecast, by Distribution Channel 2019 & 2032
- Table 57: Global MEA Functional Beverages Industry Revenue Million Forecast, by Geography 2019 & 2032
- Table 58: Global MEA Functional Beverages Industry Revenue Million Forecast, by Country 2019 & 2032
- Table 59: Global MEA Functional Beverages Industry Revenue Million Forecast, by Product Type 2019 & 2032
- Table 60: Global MEA Functional Beverages Industry Revenue Million Forecast, by Distribution Channel 2019 & 2032
- Table 61: Global MEA Functional Beverages Industry Revenue Million Forecast, by Geography 2019 & 2032
- Table 62: Global MEA Functional Beverages Industry Revenue Million Forecast, by Country 2019 & 2032
Frequently Asked Questions
1. What is the projected Compound Annual Growth Rate (CAGR) of the MEA Functional Beverages Industry?
The projected CAGR is approximately 4.17%.
2. Which companies are prominent players in the MEA Functional Beverages Industry?
Key companies in the market include Nestle SA, Herbalife International of America Inc, Sapporo Holdings, Mutalo Group, Monster Beverage Corporation, PepsiCo Inc, Dr Pepper Snapple, Viju Industries Nigeria Ltd, iPRO Sport Distribution Limited*List Not Exhaustive, Red Bull GmbH, The Coca-Cola Company.
3. What are the main segments of the MEA Functional Beverages Industry?
The market segments include Product Type, Distribution Channel, Geography.
4. Can you provide details about the market size?
The market size is estimated to be USD XX Million as of 2022.
5. What are some drivers contributing to market growth?
Preference for Plant-based and Clean-label RTD Products; Consumer Inclination Toward Sugar-Free Drinks.
6. What are the notable trends driving market growth?
Growing Demand for Plant-based and Lactose-free Products.
7. Are there any restraints impacting market growth?
Concerns Over Health Issues Associated With Beverages.
8. Can you provide examples of recent developments in the market?
October 2022: iPRO launched a range of sports drinks in Carrefour stores across the United Arab Emirates. The company claims that it contains 100% of the daily recommended vitamin C intake, along with added B vitamins.
9. What pricing options are available for accessing the report?
Pricing options include single-user, multi-user, and enterprise licenses priced at USD 4750, USD 5250, and USD 8750 respectively.
10. Is the market size provided in terms of value or volume?
The market size is provided in terms of value, measured in Million.
11. Are there any specific market keywords associated with the report?
Yes, the market keyword associated with the report is "MEA Functional Beverages Industry," which aids in identifying and referencing the specific market segment covered.
12. How do I determine which pricing option suits my needs best?
The pricing options vary based on user requirements and access needs. Individual users may opt for single-user licenses, while businesses requiring broader access may choose multi-user or enterprise licenses for cost-effective access to the report.
13. Are there any additional resources or data provided in the MEA Functional Beverages Industry report?
While the report offers comprehensive insights, it's advisable to review the specific contents or supplementary materials provided to ascertain if additional resources or data are available.
14. How can I stay updated on further developments or reports in the MEA Functional Beverages Industry?
To stay informed about further developments, trends, and reports in the MEA Functional Beverages Industry, consider subscribing to industry newsletters, following relevant companies and organizations, or regularly checking reputable industry news sources and publications.
Methodology
Step 1 - Identification of Relevant Samples Size from Population Database


Step 2 - Approaches for Defining Global Market Size (Value, Volume* & Price*)

Note*: In applicable scenarios
Step 3 - Data Sources
Primary Research
- Web Analytics
- Survey Reports
- Research Institute
- Latest Research Reports
- Opinion Leaders
Secondary Research
- Annual Reports
- White Paper
- Latest Press Release
- Industry Association
- Paid Database
- Investor Presentations

Step 4 - Data Triangulation
Involves using different sources of information in order to increase the validity of a study
These sources are likely to be stakeholders in a program - participants, other researchers, program staff, other community members, and so on.
Then we put all data in single framework & apply various statistical tools to find out the dynamic on the market.
During the analysis stage, feedback from the stakeholder groups would be compared to determine areas of agreement as well as areas of divergence
