

Key Insights
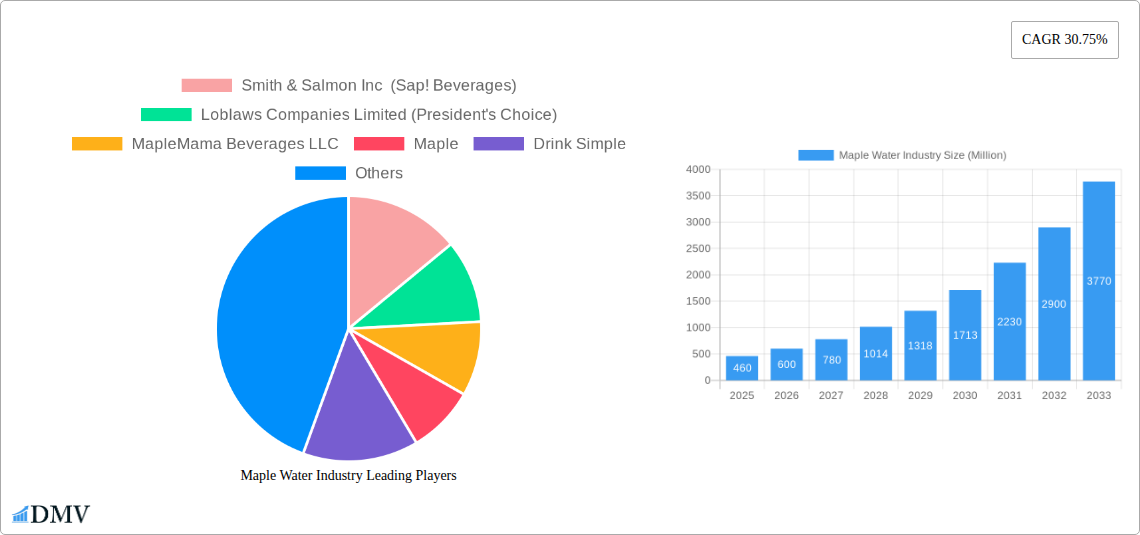
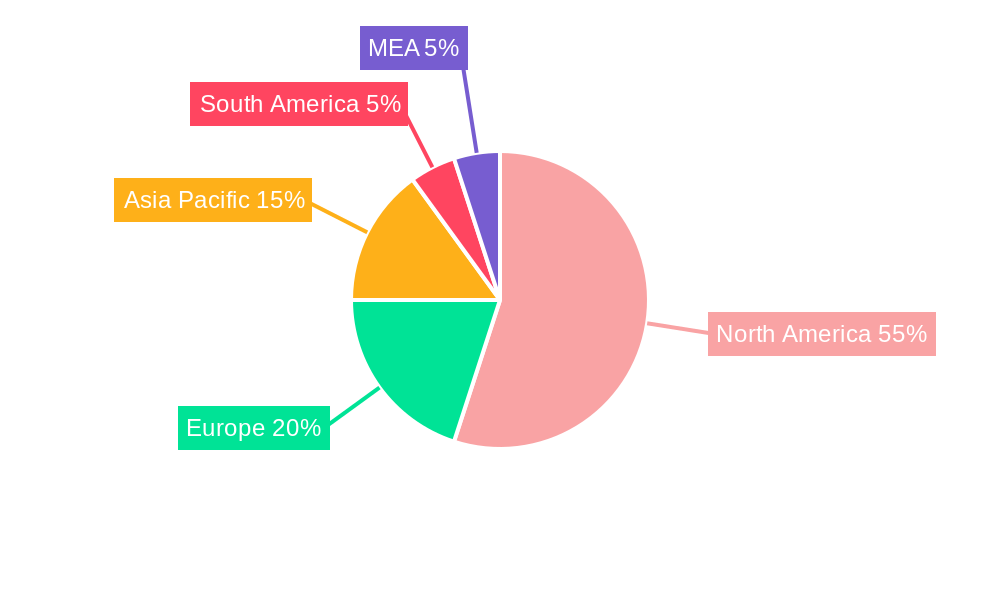
The global maple water market, currently valued at $460 million (0.46 billion) in 2025, is experiencing robust growth, projected to expand at a Compound Annual Growth Rate (CAGR) of 30.75% from 2025 to 2033. This rapid expansion is fueled by several key drivers. The increasing consumer demand for healthier, natural beverages aligns perfectly with maple water's inherent attributes: it's naturally low in sugar, a good source of electrolytes, and possesses a refreshing taste profile. Furthermore, the rising awareness of the health benefits associated with maple water, including its antioxidant properties and potential contribution to improved hydration, is significantly boosting its appeal. Growth is also being driven by innovative product offerings, including flavored varieties and convenient packaging formats like bottles and cartons, catering to diverse consumer preferences. The expansion into various distribution channels, from supermarkets and convenience stores to online retail platforms, is broadening market reach and accessibility. North America, particularly the US and Canada, currently holds the largest market share, driven by both established domestic brands and strong consumer acceptance of the product. However, significant growth potential exists in other regions like Asia-Pacific and Europe, as consumer awareness and distribution networks expand.
While the market shows immense promise, certain restraints might impact growth. Pricing can be a barrier for some consumers, as maple water tends to be more expensive than traditional beverages. Moreover, seasonal availability of maple sap, the source of maple water, could create supply chain challenges, affecting product availability. Furthermore, educating consumers about the unique benefits and taste of maple water remains crucial for sustained market penetration. Strategic marketing initiatives targeting health-conscious individuals and leveraging the growing popularity of functional beverages can effectively overcome these restraints. The competitive landscape is also evolving, with both established beverage companies and smaller niche players vying for market share, leading to innovation in product development and marketing strategies. The forecast period of 2025-2033 anticipates continued market expansion, driven by ongoing product diversification, broadening distribution networks, and escalating consumer demand for healthier beverage alternatives.
Maple Water Industry: A Comprehensive Market Report (2019-2033)
This insightful report provides a comprehensive analysis of the global maple water industry, offering a detailed overview of market trends, key players, and future growth prospects. The study period spans from 2019 to 2033, with 2025 serving as the base and estimated year. The report leverages extensive data analysis to provide stakeholders with actionable insights for strategic decision-making. The global market size is projected to reach xx Million by 2033.
Maple Water Industry Market Composition & Trends
This section delves into the competitive landscape of the maple water market, evaluating market concentration, innovation drivers, regulatory hurdles, substitute products, and end-user preferences. We analyze M&A activities, providing insights into deal values and their impact on market share distribution. The market is currently characterized by a mix of established players and emerging brands, with Smith & Salmon Inc (Sap! Beverages), Loblaws Companies Limited (President's Choice), and Asarasi holding significant market share. However, smaller players are increasingly innovating and challenging the status quo. The report will further explore:
- Market Concentration: Analysis of the Herfindahl-Hirschman Index (HHI) to assess market competitiveness. xx
- Innovation Catalysts: Examination of factors driving innovation, such as consumer demand for healthier beverages and technological advancements in processing and packaging.
- Regulatory Landscape: Assessment of existing and upcoming regulations impacting the maple water industry across key regions.
- Substitute Products: Comparative analysis of maple water with other beverages, highlighting its unique selling propositions and competitive advantages. Coconut water and other plant-based beverages are key substitutes.
- End-User Profiles: Detailed segmentation of consumers based on demographics, preferences, and purchasing behavior. Health-conscious consumers and millennials are key target demographics.
- M&A Activities: Analysis of past and present mergers and acquisitions in the maple water industry, including deal values (estimated at xx Million in total for the period 2019-2024) and their impact on market dynamics.
Maple Water Industry Industry Evolution
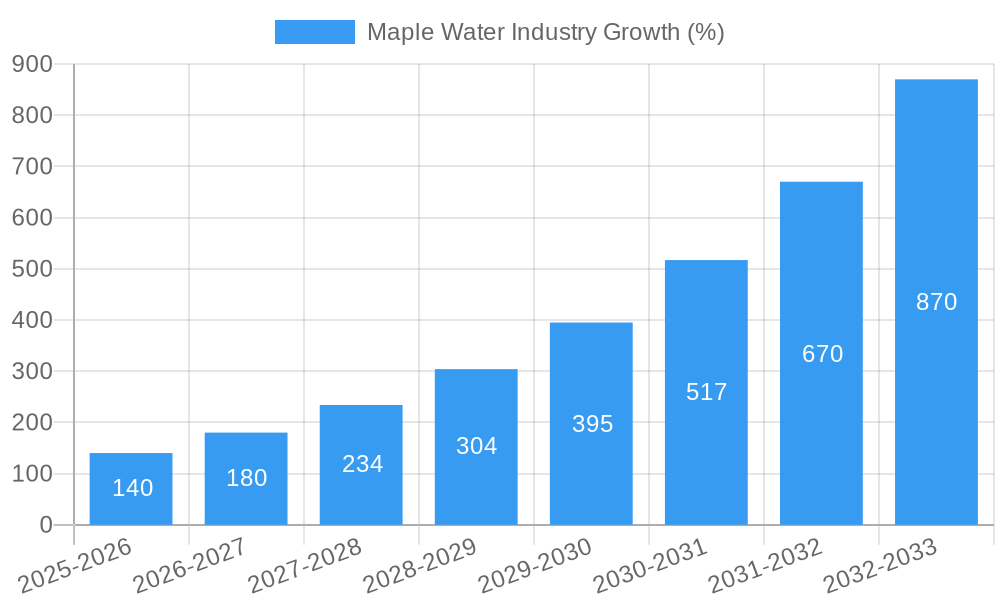
This section examines the historical and projected growth trajectory of the maple water industry. We will analyze technological advancements, shifting consumer preferences, and their impact on market dynamics over the period 2019-2033. The industry has witnessed significant growth driven by increasing health consciousness and the perception of maple water as a functional beverage.
The report will assess:
- Growth Trajectories: Detailed analysis of historical (2019-2024) and projected (2025-2033) Compound Annual Growth Rate (CAGR), with specific data points illustrating market expansion. Projected CAGR for 2025-2033 is estimated at xx%.
- Technological Advancements: Examination of innovations in maple water processing, packaging, and distribution, including advancements in shelf-life extension and sustainability initiatives.
- Shifting Consumer Demands: Exploration of evolving consumer preferences, including the demand for flavored varieties, organic options, and convenient packaging formats. The trend towards sustainable and ethically sourced products will be specifically analyzed.
Leading Regions, Countries, or Segments in Maple Water Industry
This section identifies the dominant regions, countries, and segments within the maple water market. We analyze key drivers like investment trends and regulatory support, providing an in-depth understanding of market dominance factors.
Dominant Segments (by estimated 2025 market share):
- Product Type: Unflavored (xx%) and Flavored (xx%) — Flavored maple water is experiencing higher growth.
- Packaging Type: Bottles (xx%) and Cartons/Tetra Pak (xx%) — Cartons are gaining popularity due to sustainability concerns.
- Distribution Channel: Supermarkets/Hypermarkets (xx%), followed by Convenience Stores (xx%). Online retail is a growing channel.
Key Drivers:
- North America: High consumption of maple syrup and established production infrastructure in Canada and the US.
- Europe: Growing awareness of healthy beverages and expanding distribution networks.
- Asia-Pacific: Emerging market with increasing demand for premium and functional beverages.
Maple Water Industry Product Innovations
Recent product innovations focus on enhancing taste profiles, offering convenient packaging formats (e.g., single-serve pouches), and highlighting functional benefits (e.g., natural electrolytes and antioxidants). The introduction of organic and Fair Trade certified products is driving premiumization. Technological advancements in preservation and processing techniques contribute to improved shelf-life and product quality. The use of innovative packaging materials that are sustainable and recyclable is also a key innovation area.
Propelling Factors for Maple Water Industry Growth
Several factors fuel the maple water industry's expansion. The rising health and wellness trend encourages consumers to seek natural and functional beverages. The growing awareness of the health benefits of maple water, such as its rich nutrient profile and natural sweetness, fuels demand. Furthermore, the increasing adoption of sustainable packaging and environmentally friendly production practices enhance the industry's appeal to eco-conscious consumers. Government support for the maple industry and favorable regulatory environments further contribute to market expansion.
Obstacles in the Maple Water Industry Market
Despite its growth potential, the maple water industry faces challenges. Seasonal production limitations and the susceptibility of maple sap to spoilage pose logistical hurdles. Intense competition from other functional beverages (e.g., coconut water, fruit juices) limits market share expansion. Fluctuations in maple sap production due to climatic conditions impact pricing and supply chain stability. The relatively high price point compared to other beverages also restricts market penetration. The total estimated negative impact of these obstacles on 2025 market value is xx Million.
Future Opportunities in Maple Water Industry
Expanding into new geographic markets, especially in Asia and Europe, presents significant opportunities. Product diversification, including new flavors and functional blends, and targeted marketing campaigns to reach specific consumer segments can drive further growth. The exploration of new applications, such as maple water-based functional food and beverage products, opens exciting possibilities.
Major Players in the Maple Water Industry Ecosystem
- Smith & Salmon Inc (Sap! Beverages)
- Loblaws Companies Limited (President's Choice)
- MapleMama Beverages LLC
- Maple
- Drink Simple
- Lower Valley Beverage Co (sapsucker)
- Kiki Maple Water
- Feronia Forests LLC (Vertical Water)
- Pure Maple Water Company Ltd
- Asarasi
Key Developments in Maple Water Industry Industry
- 2022 Q3: Asarasi launched a new line of flavored maple waters.
- 2023 Q1: Smith & Salmon Inc. announced a significant investment in expanding its production capacity.
- 2024 Q2: A major supermarket chain partnered with MapleMama Beverages LLC for exclusive distribution rights. (Further specific examples will be detailed in the full report).
Strategic Maple Water Industry Market Forecast
The maple water market is poised for robust growth throughout the forecast period (2025-2033). Continued innovation, increased consumer awareness, and expansion into new markets will contribute to significant market expansion. The premiumization trend and the growing focus on sustainable practices will further shape industry dynamics, leading to a projected market value of xx Million by 2033.
Maple Water Industry Segmentation
-
1. Product Type
- 1.1. Flavored
- 1.2. Unflavored
-
2. Packaging Type
- 2.1. Bottles
- 2.2. Cartons/Tetra Pak
- 2.3. Other Packaging Types
-
3. Distribution Channel
- 3.1. Supermarkets/Hypermarkets
- 3.2. Convenience Stores
- 3.3. Specialty Stores
- 3.4. Online Retail Stores
- 3.5. Other Distribution Channels
Maple Water Industry Segmentation By Geography
-
1. North America
- 1.1. United States
- 1.2. Canada
- 1.3. Mexico
- 1.4. Rest of North America
-
2. Europe
- 2.1. Germany
- 2.2. United Kingdom
- 2.3. France
- 2.4. Italy
- 2.5. Spain
- 2.6. Rest of Europe
-
3. Asia Pacific
- 3.1. China
- 3.2. India
- 3.3. Australia
- 3.4. Japan
-
4. Rest of the World
- 4.1. South America
- 4.2. Middle East and Africa
Maple Water Industry REPORT HIGHLIGHTS
| Aspects | Details |
|---|---|
| Study Period | 2019-2033 |
| Base Year | 2024 |
| Estimated Year | 2025 |
| Forecast Period | 2025-2033 |
| Historical Period | 2019-2024 |
| Growth Rate | CAGR of 30.75% from 2019-2033 |
| Segmentation |
|
Table of Contents
- 1. Introduction
- 1.1. Research Scope
- 1.2. Market Segmentation
- 1.3. Research Methodology
- 1.4. Definitions and Assumptions
- 2. Executive Summary
- 2.1. Introduction
- 3. Market Dynamics
- 3.1. Introduction
- 3.2. Market Drivers
- 3.2.1. Popularization of Adventure Sports and Expedition; Suitability of the Freeze-Dried Technique for Heat Sensitive Food Products
- 3.3. Market Restrains
- 3.3.1. High Cost Associated with the Freeze-Drying Technology
- 3.4. Market Trends
- 3.4.1. Value-added Hydration is Evolving Consumer Preferences in the Maple Water Market
- 4. Market Factor Analysis
- 4.1. Porters Five Forces
- 4.2. Supply/Value Chain
- 4.3. PESTEL analysis
- 4.4. Market Entropy
- 4.5. Patent/Trademark Analysis
- 5. Global Maple Water Industry Analysis, Insights and Forecast, 2019-2031
- 5.1. Market Analysis, Insights and Forecast - by Product Type
- 5.1.1. Flavored
- 5.1.2. Unflavored
- 5.2. Market Analysis, Insights and Forecast - by Packaging Type
- 5.2.1. Bottles
- 5.2.2. Cartons/Tetra Pak
- 5.2.3. Other Packaging Types
- 5.3. Market Analysis, Insights and Forecast - by Distribution Channel
- 5.3.1. Supermarkets/Hypermarkets
- 5.3.2. Convenience Stores
- 5.3.3. Specialty Stores
- 5.3.4. Online Retail Stores
- 5.3.5. Other Distribution Channels
- 5.4. Market Analysis, Insights and Forecast - by Region
- 5.4.1. North America
- 5.4.2. Europe
- 5.4.3. Asia Pacific
- 5.4.4. Rest of the World
- 5.1. Market Analysis, Insights and Forecast - by Product Type
- 6. North America Maple Water Industry Analysis, Insights and Forecast, 2019-2031
- 6.1. Market Analysis, Insights and Forecast - by Product Type
- 6.1.1. Flavored
- 6.1.2. Unflavored
- 6.2. Market Analysis, Insights and Forecast - by Packaging Type
- 6.2.1. Bottles
- 6.2.2. Cartons/Tetra Pak
- 6.2.3. Other Packaging Types
- 6.3. Market Analysis, Insights and Forecast - by Distribution Channel
- 6.3.1. Supermarkets/Hypermarkets
- 6.3.2. Convenience Stores
- 6.3.3. Specialty Stores
- 6.3.4. Online Retail Stores
- 6.3.5. Other Distribution Channels
- 6.1. Market Analysis, Insights and Forecast - by Product Type
- 7. Europe Maple Water Industry Analysis, Insights and Forecast, 2019-2031
- 7.1. Market Analysis, Insights and Forecast - by Product Type
- 7.1.1. Flavored
- 7.1.2. Unflavored
- 7.2. Market Analysis, Insights and Forecast - by Packaging Type
- 7.2.1. Bottles
- 7.2.2. Cartons/Tetra Pak
- 7.2.3. Other Packaging Types
- 7.3. Market Analysis, Insights and Forecast - by Distribution Channel
- 7.3.1. Supermarkets/Hypermarkets
- 7.3.2. Convenience Stores
- 7.3.3. Specialty Stores
- 7.3.4. Online Retail Stores
- 7.3.5. Other Distribution Channels
- 7.1. Market Analysis, Insights and Forecast - by Product Type
- 8. Asia Pacific Maple Water Industry Analysis, Insights and Forecast, 2019-2031
- 8.1. Market Analysis, Insights and Forecast - by Product Type
- 8.1.1. Flavored
- 8.1.2. Unflavored
- 8.2. Market Analysis, Insights and Forecast - by Packaging Type
- 8.2.1. Bottles
- 8.2.2. Cartons/Tetra Pak
- 8.2.3. Other Packaging Types
- 8.3. Market Analysis, Insights and Forecast - by Distribution Channel
- 8.3.1. Supermarkets/Hypermarkets
- 8.3.2. Convenience Stores
- 8.3.3. Specialty Stores
- 8.3.4. Online Retail Stores
- 8.3.5. Other Distribution Channels
- 8.1. Market Analysis, Insights and Forecast - by Product Type
- 9. Rest of the World Maple Water Industry Analysis, Insights and Forecast, 2019-2031
- 9.1. Market Analysis, Insights and Forecast - by Product Type
- 9.1.1. Flavored
- 9.1.2. Unflavored
- 9.2. Market Analysis, Insights and Forecast - by Packaging Type
- 9.2.1. Bottles
- 9.2.2. Cartons/Tetra Pak
- 9.2.3. Other Packaging Types
- 9.3. Market Analysis, Insights and Forecast - by Distribution Channel
- 9.3.1. Supermarkets/Hypermarkets
- 9.3.2. Convenience Stores
- 9.3.3. Specialty Stores
- 9.3.4. Online Retail Stores
- 9.3.5. Other Distribution Channels
- 9.1. Market Analysis, Insights and Forecast - by Product Type
- 10. North America Maple Water Industry Analysis, Insights and Forecast, 2019-2031
- 10.1. Market Analysis, Insights and Forecast - By Country/Sub-region
- 10.1.1 United States
- 10.1.2 Canada
- 10.1.3 Mexico
- 11. Europe Maple Water Industry Analysis, Insights and Forecast, 2019-2031
- 11.1. Market Analysis, Insights and Forecast - By Country/Sub-region
- 11.1.1 Germany
- 11.1.2 United Kingdom
- 11.1.3 France
- 11.1.4 Spain
- 11.1.5 Italy
- 11.1.6 Spain
- 11.1.7 Belgium
- 11.1.8 Netherland
- 11.1.9 Nordics
- 11.1.10 Rest of Europe
- 12. Asia Pacific Maple Water Industry Analysis, Insights and Forecast, 2019-2031
- 12.1. Market Analysis, Insights and Forecast - By Country/Sub-region
- 12.1.1 China
- 12.1.2 Japan
- 12.1.3 India
- 12.1.4 South Korea
- 12.1.5 Southeast Asia
- 12.1.6 Australia
- 12.1.7 Indonesia
- 12.1.8 Phillipes
- 12.1.9 Singapore
- 12.1.10 Thailandc
- 12.1.11 Rest of Asia Pacific
- 13. South America Maple Water Industry Analysis, Insights and Forecast, 2019-2031
- 13.1. Market Analysis, Insights and Forecast - By Country/Sub-region
- 13.1.1 Brazil
- 13.1.2 Argentina
- 13.1.3 Peru
- 13.1.4 Chile
- 13.1.5 Colombia
- 13.1.6 Ecuador
- 13.1.7 Venezuela
- 13.1.8 Rest of South America
- 14. North America Maple Water Industry Analysis, Insights and Forecast, 2019-2031
- 14.1. Market Analysis, Insights and Forecast - By Country/Sub-region
- 14.1.1 United States
- 14.1.2 Canada
- 14.1.3 Mexico
- 15. MEA Maple Water Industry Analysis, Insights and Forecast, 2019-2031
- 15.1. Market Analysis, Insights and Forecast - By Country/Sub-region
- 15.1.1 United Arab Emirates
- 15.1.2 Saudi Arabia
- 15.1.3 South Africa
- 15.1.4 Rest of Middle East and Africa
- 16. Competitive Analysis
- 16.1. Global Market Share Analysis 2024
- 16.2. Company Profiles
- 16.2.1 Smith & Salmon Inc (Sap! Beverages)
- 16.2.1.1. Overview
- 16.2.1.2. Products
- 16.2.1.3. SWOT Analysis
- 16.2.1.4. Recent Developments
- 16.2.1.5. Financials (Based on Availability)
- 16.2.2 Loblaws Companies Limited (President's Choice)
- 16.2.2.1. Overview
- 16.2.2.2. Products
- 16.2.2.3. SWOT Analysis
- 16.2.2.4. Recent Developments
- 16.2.2.5. Financials (Based on Availability)
- 16.2.3 MapleMama Beverages LLC
- 16.2.3.1. Overview
- 16.2.3.2. Products
- 16.2.3.3. SWOT Analysis
- 16.2.3.4. Recent Developments
- 16.2.3.5. Financials (Based on Availability)
- 16.2.4 Maple
- 16.2.4.1. Overview
- 16.2.4.2. Products
- 16.2.4.3. SWOT Analysis
- 16.2.4.4. Recent Developments
- 16.2.4.5. Financials (Based on Availability)
- 16.2.5 Drink Simple
- 16.2.5.1. Overview
- 16.2.5.2. Products
- 16.2.5.3. SWOT Analysis
- 16.2.5.4. Recent Developments
- 16.2.5.5. Financials (Based on Availability)
- 16.2.6 Lower Valley Beverage Co(sapsucker)*List Not Exhaustive
- 16.2.6.1. Overview
- 16.2.6.2. Products
- 16.2.6.3. SWOT Analysis
- 16.2.6.4. Recent Developments
- 16.2.6.5. Financials (Based on Availability)
- 16.2.7 Kiki Maple Water
- 16.2.7.1. Overview
- 16.2.7.2. Products
- 16.2.7.3. SWOT Analysis
- 16.2.7.4. Recent Developments
- 16.2.7.5. Financials (Based on Availability)
- 16.2.8 Feronia Forests LLC (Vertical Water)
- 16.2.8.1. Overview
- 16.2.8.2. Products
- 16.2.8.3. SWOT Analysis
- 16.2.8.4. Recent Developments
- 16.2.8.5. Financials (Based on Availability)
- 16.2.9 Pure Maple Water Company Ltd
- 16.2.9.1. Overview
- 16.2.9.2. Products
- 16.2.9.3. SWOT Analysis
- 16.2.9.4. Recent Developments
- 16.2.9.5. Financials (Based on Availability)
- 16.2.10 Asarasi
- 16.2.10.1. Overview
- 16.2.10.2. Products
- 16.2.10.3. SWOT Analysis
- 16.2.10.4. Recent Developments
- 16.2.10.5. Financials (Based on Availability)
- 16.2.1 Smith & Salmon Inc (Sap! Beverages)
List of Figures
- Figure 1: Global Maple Water Industry Revenue Breakdown (Million, %) by Region 2024 & 2032
- Figure 2: North America Maple Water Industry Revenue (Million), by Country 2024 & 2032
- Figure 3: North America Maple Water Industry Revenue Share (%), by Country 2024 & 2032
- Figure 4: Europe Maple Water Industry Revenue (Million), by Country 2024 & 2032
- Figure 5: Europe Maple Water Industry Revenue Share (%), by Country 2024 & 2032
- Figure 6: Asia Pacific Maple Water Industry Revenue (Million), by Country 2024 & 2032
- Figure 7: Asia Pacific Maple Water Industry Revenue Share (%), by Country 2024 & 2032
- Figure 8: South America Maple Water Industry Revenue (Million), by Country 2024 & 2032
- Figure 9: South America Maple Water Industry Revenue Share (%), by Country 2024 & 2032
- Figure 10: North America Maple Water Industry Revenue (Million), by Country 2024 & 2032
- Figure 11: North America Maple Water Industry Revenue Share (%), by Country 2024 & 2032
- Figure 12: MEA Maple Water Industry Revenue (Million), by Country 2024 & 2032
- Figure 13: MEA Maple Water Industry Revenue Share (%), by Country 2024 & 2032
- Figure 14: North America Maple Water Industry Revenue (Million), by Product Type 2024 & 2032
- Figure 15: North America Maple Water Industry Revenue Share (%), by Product Type 2024 & 2032
- Figure 16: North America Maple Water Industry Revenue (Million), by Packaging Type 2024 & 2032
- Figure 17: North America Maple Water Industry Revenue Share (%), by Packaging Type 2024 & 2032
- Figure 18: North America Maple Water Industry Revenue (Million), by Distribution Channel 2024 & 2032
- Figure 19: North America Maple Water Industry Revenue Share (%), by Distribution Channel 2024 & 2032
- Figure 20: North America Maple Water Industry Revenue (Million), by Country 2024 & 2032
- Figure 21: North America Maple Water Industry Revenue Share (%), by Country 2024 & 2032
- Figure 22: Europe Maple Water Industry Revenue (Million), by Product Type 2024 & 2032
- Figure 23: Europe Maple Water Industry Revenue Share (%), by Product Type 2024 & 2032
- Figure 24: Europe Maple Water Industry Revenue (Million), by Packaging Type 2024 & 2032
- Figure 25: Europe Maple Water Industry Revenue Share (%), by Packaging Type 2024 & 2032
- Figure 26: Europe Maple Water Industry Revenue (Million), by Distribution Channel 2024 & 2032
- Figure 27: Europe Maple Water Industry Revenue Share (%), by Distribution Channel 2024 & 2032
- Figure 28: Europe Maple Water Industry Revenue (Million), by Country 2024 & 2032
- Figure 29: Europe Maple Water Industry Revenue Share (%), by Country 2024 & 2032
- Figure 30: Asia Pacific Maple Water Industry Revenue (Million), by Product Type 2024 & 2032
- Figure 31: Asia Pacific Maple Water Industry Revenue Share (%), by Product Type 2024 & 2032
- Figure 32: Asia Pacific Maple Water Industry Revenue (Million), by Packaging Type 2024 & 2032
- Figure 33: Asia Pacific Maple Water Industry Revenue Share (%), by Packaging Type 2024 & 2032
- Figure 34: Asia Pacific Maple Water Industry Revenue (Million), by Distribution Channel 2024 & 2032
- Figure 35: Asia Pacific Maple Water Industry Revenue Share (%), by Distribution Channel 2024 & 2032
- Figure 36: Asia Pacific Maple Water Industry Revenue (Million), by Country 2024 & 2032
- Figure 37: Asia Pacific Maple Water Industry Revenue Share (%), by Country 2024 & 2032
- Figure 38: Rest of the World Maple Water Industry Revenue (Million), by Product Type 2024 & 2032
- Figure 39: Rest of the World Maple Water Industry Revenue Share (%), by Product Type 2024 & 2032
- Figure 40: Rest of the World Maple Water Industry Revenue (Million), by Packaging Type 2024 & 2032
- Figure 41: Rest of the World Maple Water Industry Revenue Share (%), by Packaging Type 2024 & 2032
- Figure 42: Rest of the World Maple Water Industry Revenue (Million), by Distribution Channel 2024 & 2032
- Figure 43: Rest of the World Maple Water Industry Revenue Share (%), by Distribution Channel 2024 & 2032
- Figure 44: Rest of the World Maple Water Industry Revenue (Million), by Country 2024 & 2032
- Figure 45: Rest of the World Maple Water Industry Revenue Share (%), by Country 2024 & 2032
List of Tables
- Table 1: Global Maple Water Industry Revenue Million Forecast, by Region 2019 & 2032
- Table 2: Global Maple Water Industry Revenue Million Forecast, by Product Type 2019 & 2032
- Table 3: Global Maple Water Industry Revenue Million Forecast, by Packaging Type 2019 & 2032
- Table 4: Global Maple Water Industry Revenue Million Forecast, by Distribution Channel 2019 & 2032
- Table 5: Global Maple Water Industry Revenue Million Forecast, by Region 2019 & 2032
- Table 6: Global Maple Water Industry Revenue Million Forecast, by Country 2019 & 2032
- Table 7: United States Maple Water Industry Revenue (Million) Forecast, by Application 2019 & 2032
- Table 8: Canada Maple Water Industry Revenue (Million) Forecast, by Application 2019 & 2032
- Table 9: Mexico Maple Water Industry Revenue (Million) Forecast, by Application 2019 & 2032
- Table 10: Global Maple Water Industry Revenue Million Forecast, by Country 2019 & 2032
- Table 11: Germany Maple Water Industry Revenue (Million) Forecast, by Application 2019 & 2032
- Table 12: United Kingdom Maple Water Industry Revenue (Million) Forecast, by Application 2019 & 2032
- Table 13: France Maple Water Industry Revenue (Million) Forecast, by Application 2019 & 2032
- Table 14: Spain Maple Water Industry Revenue (Million) Forecast, by Application 2019 & 2032
- Table 15: Italy Maple Water Industry Revenue (Million) Forecast, by Application 2019 & 2032
- Table 16: Spain Maple Water Industry Revenue (Million) Forecast, by Application 2019 & 2032
- Table 17: Belgium Maple Water Industry Revenue (Million) Forecast, by Application 2019 & 2032
- Table 18: Netherland Maple Water Industry Revenue (Million) Forecast, by Application 2019 & 2032
- Table 19: Nordics Maple Water Industry Revenue (Million) Forecast, by Application 2019 & 2032
- Table 20: Rest of Europe Maple Water Industry Revenue (Million) Forecast, by Application 2019 & 2032
- Table 21: Global Maple Water Industry Revenue Million Forecast, by Country 2019 & 2032
- Table 22: China Maple Water Industry Revenue (Million) Forecast, by Application 2019 & 2032
- Table 23: Japan Maple Water Industry Revenue (Million) Forecast, by Application 2019 & 2032
- Table 24: India Maple Water Industry Revenue (Million) Forecast, by Application 2019 & 2032
- Table 25: South Korea Maple Water Industry Revenue (Million) Forecast, by Application 2019 & 2032
- Table 26: Southeast Asia Maple Water Industry Revenue (Million) Forecast, by Application 2019 & 2032
- Table 27: Australia Maple Water Industry Revenue (Million) Forecast, by Application 2019 & 2032
- Table 28: Indonesia Maple Water Industry Revenue (Million) Forecast, by Application 2019 & 2032
- Table 29: Phillipes Maple Water Industry Revenue (Million) Forecast, by Application 2019 & 2032
- Table 30: Singapore Maple Water Industry Revenue (Million) Forecast, by Application 2019 & 2032
- Table 31: Thailandc Maple Water Industry Revenue (Million) Forecast, by Application 2019 & 2032
- Table 32: Rest of Asia Pacific Maple Water Industry Revenue (Million) Forecast, by Application 2019 & 2032
- Table 33: Global Maple Water Industry Revenue Million Forecast, by Country 2019 & 2032
- Table 34: Brazil Maple Water Industry Revenue (Million) Forecast, by Application 2019 & 2032
- Table 35: Argentina Maple Water Industry Revenue (Million) Forecast, by Application 2019 & 2032
- Table 36: Peru Maple Water Industry Revenue (Million) Forecast, by Application 2019 & 2032
- Table 37: Chile Maple Water Industry Revenue (Million) Forecast, by Application 2019 & 2032
- Table 38: Colombia Maple Water Industry Revenue (Million) Forecast, by Application 2019 & 2032
- Table 39: Ecuador Maple Water Industry Revenue (Million) Forecast, by Application 2019 & 2032
- Table 40: Venezuela Maple Water Industry Revenue (Million) Forecast, by Application 2019 & 2032
- Table 41: Rest of South America Maple Water Industry Revenue (Million) Forecast, by Application 2019 & 2032
- Table 42: Global Maple Water Industry Revenue Million Forecast, by Country 2019 & 2032
- Table 43: United States Maple Water Industry Revenue (Million) Forecast, by Application 2019 & 2032
- Table 44: Canada Maple Water Industry Revenue (Million) Forecast, by Application 2019 & 2032
- Table 45: Mexico Maple Water Industry Revenue (Million) Forecast, by Application 2019 & 2032
- Table 46: Global Maple Water Industry Revenue Million Forecast, by Country 2019 & 2032
- Table 47: United Arab Emirates Maple Water Industry Revenue (Million) Forecast, by Application 2019 & 2032
- Table 48: Saudi Arabia Maple Water Industry Revenue (Million) Forecast, by Application 2019 & 2032
- Table 49: South Africa Maple Water Industry Revenue (Million) Forecast, by Application 2019 & 2032
- Table 50: Rest of Middle East and Africa Maple Water Industry Revenue (Million) Forecast, by Application 2019 & 2032
- Table 51: Global Maple Water Industry Revenue Million Forecast, by Product Type 2019 & 2032
- Table 52: Global Maple Water Industry Revenue Million Forecast, by Packaging Type 2019 & 2032
- Table 53: Global Maple Water Industry Revenue Million Forecast, by Distribution Channel 2019 & 2032
- Table 54: Global Maple Water Industry Revenue Million Forecast, by Country 2019 & 2032
- Table 55: United States Maple Water Industry Revenue (Million) Forecast, by Application 2019 & 2032
- Table 56: Canada Maple Water Industry Revenue (Million) Forecast, by Application 2019 & 2032
- Table 57: Mexico Maple Water Industry Revenue (Million) Forecast, by Application 2019 & 2032
- Table 58: Rest of North America Maple Water Industry Revenue (Million) Forecast, by Application 2019 & 2032
- Table 59: Global Maple Water Industry Revenue Million Forecast, by Product Type 2019 & 2032
- Table 60: Global Maple Water Industry Revenue Million Forecast, by Packaging Type 2019 & 2032
- Table 61: Global Maple Water Industry Revenue Million Forecast, by Distribution Channel 2019 & 2032
- Table 62: Global Maple Water Industry Revenue Million Forecast, by Country 2019 & 2032
- Table 63: Germany Maple Water Industry Revenue (Million) Forecast, by Application 2019 & 2032
- Table 64: United Kingdom Maple Water Industry Revenue (Million) Forecast, by Application 2019 & 2032
- Table 65: France Maple Water Industry Revenue (Million) Forecast, by Application 2019 & 2032
- Table 66: Italy Maple Water Industry Revenue (Million) Forecast, by Application 2019 & 2032
- Table 67: Spain Maple Water Industry Revenue (Million) Forecast, by Application 2019 & 2032
- Table 68: Rest of Europe Maple Water Industry Revenue (Million) Forecast, by Application 2019 & 2032
- Table 69: Global Maple Water Industry Revenue Million Forecast, by Product Type 2019 & 2032
- Table 70: Global Maple Water Industry Revenue Million Forecast, by Packaging Type 2019 & 2032
- Table 71: Global Maple Water Industry Revenue Million Forecast, by Distribution Channel 2019 & 2032
- Table 72: Global Maple Water Industry Revenue Million Forecast, by Country 2019 & 2032
- Table 73: China Maple Water Industry Revenue (Million) Forecast, by Application 2019 & 2032
- Table 74: India Maple Water Industry Revenue (Million) Forecast, by Application 2019 & 2032
- Table 75: Australia Maple Water Industry Revenue (Million) Forecast, by Application 2019 & 2032
- Table 76: Japan Maple Water Industry Revenue (Million) Forecast, by Application 2019 & 2032
- Table 77: Global Maple Water Industry Revenue Million Forecast, by Product Type 2019 & 2032
- Table 78: Global Maple Water Industry Revenue Million Forecast, by Packaging Type 2019 & 2032
- Table 79: Global Maple Water Industry Revenue Million Forecast, by Distribution Channel 2019 & 2032
- Table 80: Global Maple Water Industry Revenue Million Forecast, by Country 2019 & 2032
- Table 81: South America Maple Water Industry Revenue (Million) Forecast, by Application 2019 & 2032
- Table 82: Middle East and Africa Maple Water Industry Revenue (Million) Forecast, by Application 2019 & 2032
Frequently Asked Questions
1. What is the projected Compound Annual Growth Rate (CAGR) of the Maple Water Industry?
The projected CAGR is approximately 30.75%.
2. Which companies are prominent players in the Maple Water Industry?
Key companies in the market include Smith & Salmon Inc (Sap! Beverages), Loblaws Companies Limited (President's Choice), MapleMama Beverages LLC, Maple, Drink Simple, Lower Valley Beverage Co(sapsucker)*List Not Exhaustive, Kiki Maple Water, Feronia Forests LLC (Vertical Water), Pure Maple Water Company Ltd, Asarasi.
3. What are the main segments of the Maple Water Industry?
The market segments include Product Type, Packaging Type, Distribution Channel.
4. Can you provide details about the market size?
The market size is estimated to be USD 0.46 Million as of 2022.
5. What are some drivers contributing to market growth?
Popularization of Adventure Sports and Expedition; Suitability of the Freeze-Dried Technique for Heat Sensitive Food Products.
6. What are the notable trends driving market growth?
Value-added Hydration is Evolving Consumer Preferences in the Maple Water Market.
7. Are there any restraints impacting market growth?
High Cost Associated with the Freeze-Drying Technology.
8. Can you provide examples of recent developments in the market?
N/A
9. What pricing options are available for accessing the report?
Pricing options include single-user, multi-user, and enterprise licenses priced at USD 4750, USD 5250, and USD 8750 respectively.
10. Is the market size provided in terms of value or volume?
The market size is provided in terms of value, measured in Million.
11. Are there any specific market keywords associated with the report?
Yes, the market keyword associated with the report is "Maple Water Industry," which aids in identifying and referencing the specific market segment covered.
12. How do I determine which pricing option suits my needs best?
The pricing options vary based on user requirements and access needs. Individual users may opt for single-user licenses, while businesses requiring broader access may choose multi-user or enterprise licenses for cost-effective access to the report.
13. Are there any additional resources or data provided in the Maple Water Industry report?
While the report offers comprehensive insights, it's advisable to review the specific contents or supplementary materials provided to ascertain if additional resources or data are available.
14. How can I stay updated on further developments or reports in the Maple Water Industry?
To stay informed about further developments, trends, and reports in the Maple Water Industry, consider subscribing to industry newsletters, following relevant companies and organizations, or regularly checking reputable industry news sources and publications.
Methodology
Step 1 - Identification of Relevant Samples Size from Population Database


Step 2 - Approaches for Defining Global Market Size (Value, Volume* & Price*)

Note*: In applicable scenarios
Step 3 - Data Sources
Primary Research
- Web Analytics
- Survey Reports
- Research Institute
- Latest Research Reports
- Opinion Leaders
Secondary Research
- Annual Reports
- White Paper
- Latest Press Release
- Industry Association
- Paid Database
- Investor Presentations

Step 4 - Data Triangulation
Involves using different sources of information in order to increase the validity of a study
These sources are likely to be stakeholders in a program - participants, other researchers, program staff, other community members, and so on.
Then we put all data in single framework & apply various statistical tools to find out the dynamic on the market.
During the analysis stage, feedback from the stakeholder groups would be compared to determine areas of agreement as well as areas of divergence
