

Key Insights
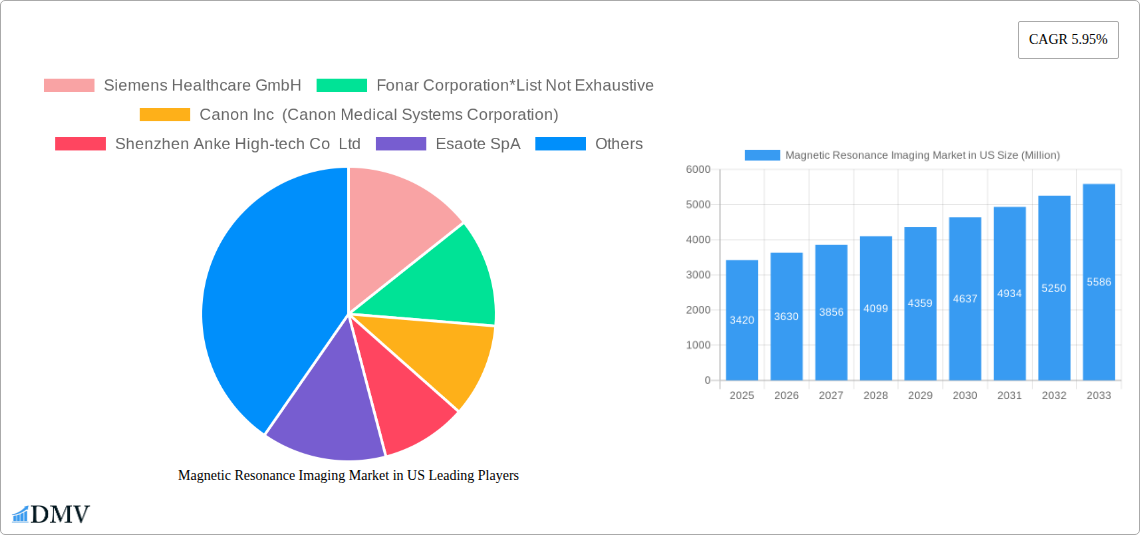
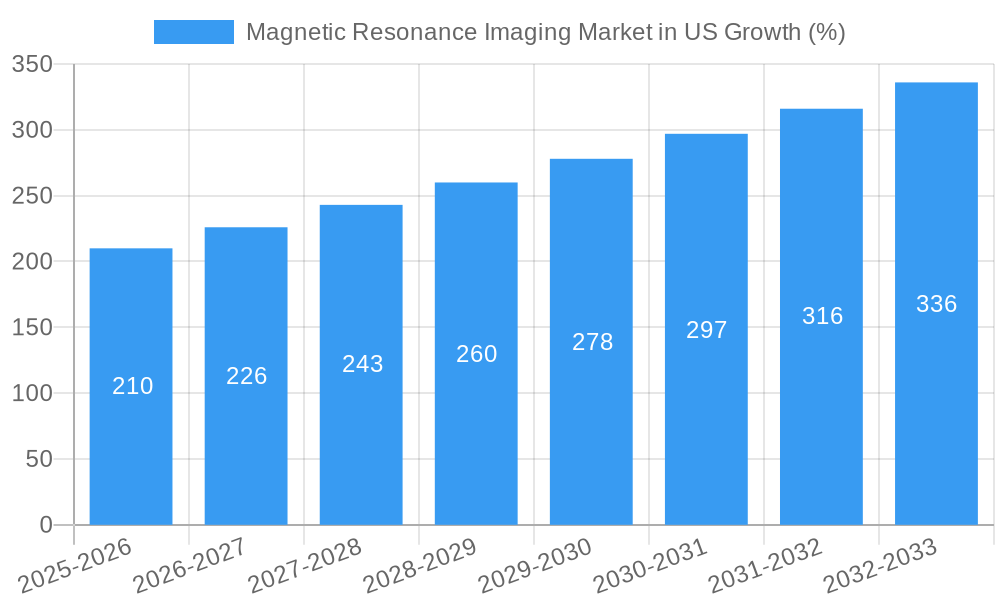
The US Magnetic Resonance Imaging (MRI) market, valued at $3.42 billion in 2025, is projected to experience robust growth, driven by a rising prevalence of chronic diseases necessitating advanced diagnostic imaging, technological advancements leading to improved image quality and faster scan times, and increasing adoption of MRI in various applications beyond traditional neurology and oncology. The market's Compound Annual Growth Rate (CAGR) of 5.95% from 2025 to 2033 indicates substantial expansion. Key market segments include closed and open MRI systems, categorized further by field strength (low, high, very high, and ultra-high). Application segments are dominated by oncology, neurology, cardiology, musculoskeletal imaging, and gastroenterology, reflecting the diverse clinical needs met by MRI technology. Leading market players like Siemens Healthcare, GE Healthcare, Philips, and Canon Medical Systems are investing heavily in research and development to improve system performance and expand clinical applications. The increasing demand for high-field and ultra-high-field MRI systems, offering superior image resolution and diagnostic capabilities, is fueling the market's growth trajectory. This trend reflects a healthcare system prioritizing accurate and timely diagnoses, leading to better patient outcomes and improved healthcare management.
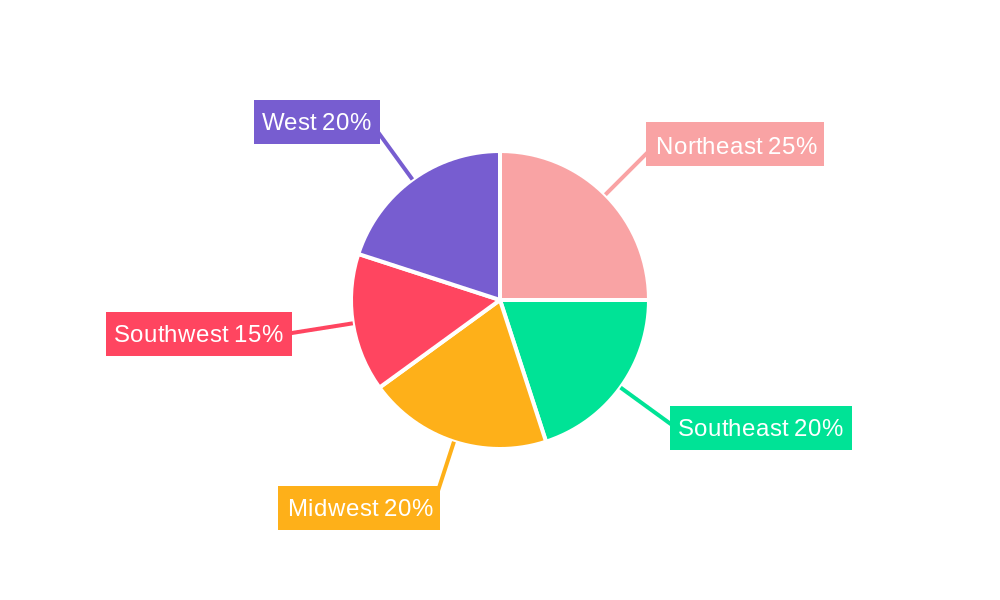
Further growth is anticipated due to increased government funding for healthcare infrastructure improvements and a growing awareness among healthcare providers and patients about the benefits of non-invasive diagnostic imaging modalities. However, restraints exist, such as high equipment costs, the need for skilled technicians, and the potential for claustrophobia among patients using closed MRI systems. The ongoing innovation in open MRI systems, aiming to address claustrophobia concerns, and developments in AI-driven image analysis are expected to mitigate some of these challenges and propel market growth. Regional variations within the US market are anticipated, with areas exhibiting higher concentrations of specialized medical facilities and larger populations showing greater adoption rates of MRI technology. The Northeast and West Coast regions are expected to contribute significantly to overall market growth due to the presence of leading medical centers and research institutions.
Magnetic Resonance Imaging (MRI) Market in US: A Comprehensive Report (2019-2033)
This insightful report provides a detailed analysis of the Magnetic Resonance Imaging (MRI) market in the US, covering the period from 2019 to 2033. It offers a comprehensive overview of market trends, competitive landscape, technological advancements, and future growth prospects. The report is invaluable for stakeholders including manufacturers, healthcare providers, investors, and regulatory bodies seeking to understand and navigate this dynamic market. The US MRI market, valued at $xx Million in 2024, is projected to reach $xx Million by 2033, exhibiting a CAGR of xx% during the forecast period (2025-2033).
Magnetic Resonance Imaging Market in US Market Composition & Trends
The US MRI market is characterized by a moderately concentrated landscape with key players like Siemens Healthcare GmbH, GE HealthCare, Koninklijke Philips N V, Canon Inc (Canon Medical Systems Corporation), and Fujifilm Holdings Corporation holding significant market share. However, smaller players and innovative startups are also contributing to market dynamism. The market is driven by technological advancements, increasing prevalence of chronic diseases, rising demand for advanced imaging techniques, and supportive regulatory environments. Substitute products, primarily CT scans and ultrasound, exist but MRI retains a significant advantage in soft tissue imaging. The market exhibits strong growth in specific applications, like oncology and neurology. M&A activity remains relatively moderate, with deal values averaging around $xx Million in recent years.
- Market Concentration: Moderately concentrated, with top 5 players holding approximately xx% market share.
- Innovation Catalysts: Deep learning algorithms for accelerated image acquisition, novel contrast agents, and improved system design.
- Regulatory Landscape: Favorable FDA regulations driving adoption of new technologies and increasing access.
- Substitute Products: CT scans and Ultrasound; MRI maintains superior soft tissue visualization.
- End-User Profiles: Hospitals, diagnostic imaging centers, and outpatient clinics are the primary end-users.
- M&A Activities: Moderate activity, with an average deal value of $xx Million annually in the last five years.
Magnetic Resonance Imaging Market in US Industry Evolution
The US MRI market has experienced consistent growth throughout the historical period (2019-2024), driven by factors like technological advancements and an aging population. Technological innovation has significantly improved image quality, reduced scan times, and broadened MRI's clinical applications. This includes the introduction of higher-field strength systems (Ultra-high MRI Systems), improvements in coil technology, and the integration of AI-powered tools for automated image analysis. Consumer demand is shifting towards faster, more comfortable, and less claustrophobic MRI systems, which is influencing market development. The market witnessed a xx% growth rate from 2020 to 2024, indicating robust expansion. Adoption of advanced MRI technologies, such as functional MRI (fMRI) and diffusion tensor imaging (DTI), continues to rise, further fueling market growth. The forecast period (2025-2033) is expected to see sustained growth, fueled by technological innovation and rising healthcare spending.
Leading Regions, Countries, or Segments in Magnetic Resonance Imaging Market in US
The US MRI market is dominated by several key segments:
- Architecture: Closed MRI systems maintain a larger market share compared to open MRI systems, primarily due to superior image quality.
- Field Strength: High-field and ultra-high-field MRI systems are driving significant growth, owing to their enhanced resolution and capabilities.
- Application: Oncology, neurology, and cardiology represent the largest application segments, driven by high prevalence of related diseases and the unique capabilities of MRI in these areas.
Key Drivers:
- High investment in healthcare infrastructure: Significant government and private funding in advanced imaging technologies.
- Regulatory support: FDA approvals for innovative MRI technologies accelerate market penetration.
- Technological advancements: Higher field strength systems, improved coil technology, and AI integration.
- Rising prevalence of chronic diseases: Increased need for accurate and detailed diagnostic imaging.
Magnetic Resonance Imaging Market in US Product Innovations
Recent innovations include the integration of artificial intelligence (AI) for faster image acquisition and improved diagnostic accuracy. Deep learning algorithms significantly reduce scan times without compromising image quality. New contrast agents enhance image clarity and provide improved visualization of specific tissues. Manufacturers are focusing on developing more comfortable and patient-friendly MRI systems, such as open MRI designs, to overcome claustrophobia, a significant barrier to MRI usage. The development of specialized coils for specific anatomical regions further enhances image quality and diagnostic precision.
Propelling Factors for Magnetic Resonance Imaging Market in US Growth
Several factors drive the growth of the US MRI market, including:
- Technological advancements: Increased field strength, improved image quality, faster scan times, and AI integration.
- Rising prevalence of chronic diseases: Increased need for advanced diagnostic imaging.
- Favorable regulatory environment: FDA approvals streamline the adoption of new technologies.
- Increasing healthcare expenditure: Higher investment in healthcare infrastructure and advanced medical equipment.
Obstacles in the Magnetic Resonance Imaging Market in US Market
Challenges facing the market include:
- High cost of MRI systems: Limiting access for smaller healthcare providers.
- Complex operation and maintenance: Requires highly skilled technicians, increasing operational costs.
- Claustrophobia in patients: Leading to discomfort and limitations in patient access.
- Competition from alternative imaging modalities: CT scans and ultrasound offer faster and often cheaper alternatives for some applications.
Future Opportunities in Magnetic Resonance Imaging Market in US
Future opportunities lie in:
- Development of portable MRI systems: Expanding access to imaging in underserved areas.
- Integration of AI and machine learning: Automating analysis and improving diagnostic accuracy.
- Development of novel contrast agents: Providing enhanced image quality and specificity.
- Expansion into new clinical applications: MRI is expanding into new fields like metabolic imaging and neuroscience research.
Major Players in the Magnetic Resonance Imaging Market in US Ecosystem
- Siemens Healthcare GmbH
- Fonar Corporation
- Canon Inc (Canon Medical Systems Corporation)
- Shenzhen Anke High-tech Co Ltd
- Esaote SpA
- Aurora Imaging Technology
- Koninklijke Philips N V
- GE HealthCare
- Neusoft Medical Systems Co Ltd
- Fujifilm Holdings Corporation
Key Developments in Magnetic Resonance Imaging Market in US Industry
- June 2023: GE HealthCare launched Sonic DL, an FDA-cleared deep learning technology accelerating MRI image acquisition, enabling high-quality cardiac MRI in a single heartbeat. This significantly improves efficiency and patient experience.
- May 2023: Cincinnati Children’s Hospital Medical Center used XENOVIEW xenon MRI for lung ventilation imaging, highlighting the expansion of MRI applications. This signifies the growing use of MRI in specialized areas.
Strategic Magnetic Resonance Imaging Market in US Market Forecast
The US MRI market is poised for continued growth, fueled by technological advancements, increasing healthcare spending, and the rising prevalence of chronic diseases. The integration of AI and machine learning will further enhance image quality and diagnostic accuracy, driving market expansion. The development of more patient-friendly systems and expansion into new clinical applications will create further opportunities for growth. The market is expected to witness substantial growth throughout the forecast period, driven by factors mentioned above.
Magnetic Resonance Imaging Market in US Segmentation
-
1. Architecture
- 1.1. Closed MRI Systems
- 1.2. Open MRI Systems
-
2. Field Strength
- 2.1. Low Field MRI Systems
- 2.2. High Field MRI Systems
- 2.3. Very Hig
-
3. Application
- 3.1. Oncology
- 3.2. Neurology
- 3.3. Cardiology
- 3.4. Gastroenterology
- 3.5. Musculoskeletal
- 3.6. Other Applications
Magnetic Resonance Imaging Market in US Segmentation By Geography
-
1. North America
- 1.1. United States
- 1.2. Canada
- 1.3. Mexico
-
2. South America
- 2.1. Brazil
- 2.2. Argentina
- 2.3. Rest of South America
-
3. Europe
- 3.1. United Kingdom
- 3.2. Germany
- 3.3. France
- 3.4. Italy
- 3.5. Spain
- 3.6. Russia
- 3.7. Benelux
- 3.8. Nordics
- 3.9. Rest of Europe
-
4. Middle East & Africa
- 4.1. Turkey
- 4.2. Israel
- 4.3. GCC
- 4.4. North Africa
- 4.5. South Africa
- 4.6. Rest of Middle East & Africa
-
5. Asia Pacific
- 5.1. China
- 5.2. India
- 5.3. Japan
- 5.4. South Korea
- 5.5. ASEAN
- 5.6. Oceania
- 5.7. Rest of Asia Pacific
Magnetic Resonance Imaging Market in US REPORT HIGHLIGHTS
| Aspects | Details |
|---|---|
| Study Period | 2019-2033 |
| Base Year | 2024 |
| Estimated Year | 2025 |
| Forecast Period | 2025-2033 |
| Historical Period | 2019-2024 |
| Growth Rate | CAGR of 5.95% from 2019-2033 |
| Segmentation |
|
Table of Contents
- 1. Introduction
- 1.1. Research Scope
- 1.2. Market Segmentation
- 1.3. Research Methodology
- 1.4. Definitions and Assumptions
- 2. Executive Summary
- 2.1. Introduction
- 3. Market Dynamics
- 3.1. Introduction
- 3.2. Market Drivers
- 3.2.1. Growing Burden of Chronic Diseases; Advancements in MRI Systems and Availability of Universal Health Coverage
- 3.3. Market Restrains
- 3.3.1. High Cost of MRI Systems
- 3.4. Market Trends
- 3.4.1. Neurology Segment is Expected to Witness Significant Growth Over the Forecast Period
- 4. Market Factor Analysis
- 4.1. Porters Five Forces
- 4.2. Supply/Value Chain
- 4.3. PESTEL analysis
- 4.4. Market Entropy
- 4.5. Patent/Trademark Analysis
- 5. Global Magnetic Resonance Imaging Market in US Analysis, Insights and Forecast, 2019-2031
- 5.1. Market Analysis, Insights and Forecast - by Architecture
- 5.1.1. Closed MRI Systems
- 5.1.2. Open MRI Systems
- 5.2. Market Analysis, Insights and Forecast - by Field Strength
- 5.2.1. Low Field MRI Systems
- 5.2.2. High Field MRI Systems
- 5.2.3. Very Hig
- 5.3. Market Analysis, Insights and Forecast - by Application
- 5.3.1. Oncology
- 5.3.2. Neurology
- 5.3.3. Cardiology
- 5.3.4. Gastroenterology
- 5.3.5. Musculoskeletal
- 5.3.6. Other Applications
- 5.4. Market Analysis, Insights and Forecast - by Region
- 5.4.1. North America
- 5.4.2. South America
- 5.4.3. Europe
- 5.4.4. Middle East & Africa
- 5.4.5. Asia Pacific
- 5.1. Market Analysis, Insights and Forecast - by Architecture
- 6. North America Magnetic Resonance Imaging Market in US Analysis, Insights and Forecast, 2019-2031
- 6.1. Market Analysis, Insights and Forecast - by Architecture
- 6.1.1. Closed MRI Systems
- 6.1.2. Open MRI Systems
- 6.2. Market Analysis, Insights and Forecast - by Field Strength
- 6.2.1. Low Field MRI Systems
- 6.2.2. High Field MRI Systems
- 6.2.3. Very Hig
- 6.3. Market Analysis, Insights and Forecast - by Application
- 6.3.1. Oncology
- 6.3.2. Neurology
- 6.3.3. Cardiology
- 6.3.4. Gastroenterology
- 6.3.5. Musculoskeletal
- 6.3.6. Other Applications
- 6.1. Market Analysis, Insights and Forecast - by Architecture
- 7. South America Magnetic Resonance Imaging Market in US Analysis, Insights and Forecast, 2019-2031
- 7.1. Market Analysis, Insights and Forecast - by Architecture
- 7.1.1. Closed MRI Systems
- 7.1.2. Open MRI Systems
- 7.2. Market Analysis, Insights and Forecast - by Field Strength
- 7.2.1. Low Field MRI Systems
- 7.2.2. High Field MRI Systems
- 7.2.3. Very Hig
- 7.3. Market Analysis, Insights and Forecast - by Application
- 7.3.1. Oncology
- 7.3.2. Neurology
- 7.3.3. Cardiology
- 7.3.4. Gastroenterology
- 7.3.5. Musculoskeletal
- 7.3.6. Other Applications
- 7.1. Market Analysis, Insights and Forecast - by Architecture
- 8. Europe Magnetic Resonance Imaging Market in US Analysis, Insights and Forecast, 2019-2031
- 8.1. Market Analysis, Insights and Forecast - by Architecture
- 8.1.1. Closed MRI Systems
- 8.1.2. Open MRI Systems
- 8.2. Market Analysis, Insights and Forecast - by Field Strength
- 8.2.1. Low Field MRI Systems
- 8.2.2. High Field MRI Systems
- 8.2.3. Very Hig
- 8.3. Market Analysis, Insights and Forecast - by Application
- 8.3.1. Oncology
- 8.3.2. Neurology
- 8.3.3. Cardiology
- 8.3.4. Gastroenterology
- 8.3.5. Musculoskeletal
- 8.3.6. Other Applications
- 8.1. Market Analysis, Insights and Forecast - by Architecture
- 9. Middle East & Africa Magnetic Resonance Imaging Market in US Analysis, Insights and Forecast, 2019-2031
- 9.1. Market Analysis, Insights and Forecast - by Architecture
- 9.1.1. Closed MRI Systems
- 9.1.2. Open MRI Systems
- 9.2. Market Analysis, Insights and Forecast - by Field Strength
- 9.2.1. Low Field MRI Systems
- 9.2.2. High Field MRI Systems
- 9.2.3. Very Hig
- 9.3. Market Analysis, Insights and Forecast - by Application
- 9.3.1. Oncology
- 9.3.2. Neurology
- 9.3.3. Cardiology
- 9.3.4. Gastroenterology
- 9.3.5. Musculoskeletal
- 9.3.6. Other Applications
- 9.1. Market Analysis, Insights and Forecast - by Architecture
- 10. Asia Pacific Magnetic Resonance Imaging Market in US Analysis, Insights and Forecast, 2019-2031
- 10.1. Market Analysis, Insights and Forecast - by Architecture
- 10.1.1. Closed MRI Systems
- 10.1.2. Open MRI Systems
- 10.2. Market Analysis, Insights and Forecast - by Field Strength
- 10.2.1. Low Field MRI Systems
- 10.2.2. High Field MRI Systems
- 10.2.3. Very Hig
- 10.3. Market Analysis, Insights and Forecast - by Application
- 10.3.1. Oncology
- 10.3.2. Neurology
- 10.3.3. Cardiology
- 10.3.4. Gastroenterology
- 10.3.5. Musculoskeletal
- 10.3.6. Other Applications
- 10.1. Market Analysis, Insights and Forecast - by Architecture
- 11. Northeast Magnetic Resonance Imaging Market in US Analysis, Insights and Forecast, 2019-2031
- 12. Southeast Magnetic Resonance Imaging Market in US Analysis, Insights and Forecast, 2019-2031
- 13. Midwest Magnetic Resonance Imaging Market in US Analysis, Insights and Forecast, 2019-2031
- 14. Southwest Magnetic Resonance Imaging Market in US Analysis, Insights and Forecast, 2019-2031
- 15. West Magnetic Resonance Imaging Market in US Analysis, Insights and Forecast, 2019-2031
- 16. Competitive Analysis
- 16.1. Global Market Share Analysis 2024
- 16.2. Company Profiles
- 16.2.1 Siemens Healthcare GmbH
- 16.2.1.1. Overview
- 16.2.1.2. Products
- 16.2.1.3. SWOT Analysis
- 16.2.1.4. Recent Developments
- 16.2.1.5. Financials (Based on Availability)
- 16.2.2 Fonar Corporation*List Not Exhaustive
- 16.2.2.1. Overview
- 16.2.2.2. Products
- 16.2.2.3. SWOT Analysis
- 16.2.2.4. Recent Developments
- 16.2.2.5. Financials (Based on Availability)
- 16.2.3 Canon Inc (Canon Medical Systems Corporation)
- 16.2.3.1. Overview
- 16.2.3.2. Products
- 16.2.3.3. SWOT Analysis
- 16.2.3.4. Recent Developments
- 16.2.3.5. Financials (Based on Availability)
- 16.2.4 Shenzhen Anke High-tech Co Ltd
- 16.2.4.1. Overview
- 16.2.4.2. Products
- 16.2.4.3. SWOT Analysis
- 16.2.4.4. Recent Developments
- 16.2.4.5. Financials (Based on Availability)
- 16.2.5 Esaote SpA
- 16.2.5.1. Overview
- 16.2.5.2. Products
- 16.2.5.3. SWOT Analysis
- 16.2.5.4. Recent Developments
- 16.2.5.5. Financials (Based on Availability)
- 16.2.6 Aurora Imaging Technology
- 16.2.6.1. Overview
- 16.2.6.2. Products
- 16.2.6.3. SWOT Analysis
- 16.2.6.4. Recent Developments
- 16.2.6.5. Financials (Based on Availability)
- 16.2.7 Koninklijke Philips N V
- 16.2.7.1. Overview
- 16.2.7.2. Products
- 16.2.7.3. SWOT Analysis
- 16.2.7.4. Recent Developments
- 16.2.7.5. Financials (Based on Availability)
- 16.2.8 GE HealthCare
- 16.2.8.1. Overview
- 16.2.8.2. Products
- 16.2.8.3. SWOT Analysis
- 16.2.8.4. Recent Developments
- 16.2.8.5. Financials (Based on Availability)
- 16.2.9 Neusoft Medical Systems Co Ltd
- 16.2.9.1. Overview
- 16.2.9.2. Products
- 16.2.9.3. SWOT Analysis
- 16.2.9.4. Recent Developments
- 16.2.9.5. Financials (Based on Availability)
- 16.2.10 Fujifilm Holdings Corporation
- 16.2.10.1. Overview
- 16.2.10.2. Products
- 16.2.10.3. SWOT Analysis
- 16.2.10.4. Recent Developments
- 16.2.10.5. Financials (Based on Availability)
- 16.2.1 Siemens Healthcare GmbH
List of Figures
- Figure 1: Global Magnetic Resonance Imaging Market in US Revenue Breakdown (Million, %) by Region 2024 & 2032
- Figure 2: Global Magnetic Resonance Imaging Market in US Volume Breakdown (Piece, %) by Region 2024 & 2032
- Figure 3: United states Magnetic Resonance Imaging Market in US Revenue (Million), by Country 2024 & 2032
- Figure 4: United states Magnetic Resonance Imaging Market in US Volume (Piece), by Country 2024 & 2032
- Figure 5: United states Magnetic Resonance Imaging Market in US Revenue Share (%), by Country 2024 & 2032
- Figure 6: United states Magnetic Resonance Imaging Market in US Volume Share (%), by Country 2024 & 2032
- Figure 7: North America Magnetic Resonance Imaging Market in US Revenue (Million), by Architecture 2024 & 2032
- Figure 8: North America Magnetic Resonance Imaging Market in US Volume (Piece), by Architecture 2024 & 2032
- Figure 9: North America Magnetic Resonance Imaging Market in US Revenue Share (%), by Architecture 2024 & 2032
- Figure 10: North America Magnetic Resonance Imaging Market in US Volume Share (%), by Architecture 2024 & 2032
- Figure 11: North America Magnetic Resonance Imaging Market in US Revenue (Million), by Field Strength 2024 & 2032
- Figure 12: North America Magnetic Resonance Imaging Market in US Volume (Piece), by Field Strength 2024 & 2032
- Figure 13: North America Magnetic Resonance Imaging Market in US Revenue Share (%), by Field Strength 2024 & 2032
- Figure 14: North America Magnetic Resonance Imaging Market in US Volume Share (%), by Field Strength 2024 & 2032
- Figure 15: North America Magnetic Resonance Imaging Market in US Revenue (Million), by Application 2024 & 2032
- Figure 16: North America Magnetic Resonance Imaging Market in US Volume (Piece), by Application 2024 & 2032
- Figure 17: North America Magnetic Resonance Imaging Market in US Revenue Share (%), by Application 2024 & 2032
- Figure 18: North America Magnetic Resonance Imaging Market in US Volume Share (%), by Application 2024 & 2032
- Figure 19: North America Magnetic Resonance Imaging Market in US Revenue (Million), by Country 2024 & 2032
- Figure 20: North America Magnetic Resonance Imaging Market in US Volume (Piece), by Country 2024 & 2032
- Figure 21: North America Magnetic Resonance Imaging Market in US Revenue Share (%), by Country 2024 & 2032
- Figure 22: North America Magnetic Resonance Imaging Market in US Volume Share (%), by Country 2024 & 2032
- Figure 23: South America Magnetic Resonance Imaging Market in US Revenue (Million), by Architecture 2024 & 2032
- Figure 24: South America Magnetic Resonance Imaging Market in US Volume (Piece), by Architecture 2024 & 2032
- Figure 25: South America Magnetic Resonance Imaging Market in US Revenue Share (%), by Architecture 2024 & 2032
- Figure 26: South America Magnetic Resonance Imaging Market in US Volume Share (%), by Architecture 2024 & 2032
- Figure 27: South America Magnetic Resonance Imaging Market in US Revenue (Million), by Field Strength 2024 & 2032
- Figure 28: South America Magnetic Resonance Imaging Market in US Volume (Piece), by Field Strength 2024 & 2032
- Figure 29: South America Magnetic Resonance Imaging Market in US Revenue Share (%), by Field Strength 2024 & 2032
- Figure 30: South America Magnetic Resonance Imaging Market in US Volume Share (%), by Field Strength 2024 & 2032
- Figure 31: South America Magnetic Resonance Imaging Market in US Revenue (Million), by Application 2024 & 2032
- Figure 32: South America Magnetic Resonance Imaging Market in US Volume (Piece), by Application 2024 & 2032
- Figure 33: South America Magnetic Resonance Imaging Market in US Revenue Share (%), by Application 2024 & 2032
- Figure 34: South America Magnetic Resonance Imaging Market in US Volume Share (%), by Application 2024 & 2032
- Figure 35: South America Magnetic Resonance Imaging Market in US Revenue (Million), by Country 2024 & 2032
- Figure 36: South America Magnetic Resonance Imaging Market in US Volume (Piece), by Country 2024 & 2032
- Figure 37: South America Magnetic Resonance Imaging Market in US Revenue Share (%), by Country 2024 & 2032
- Figure 38: South America Magnetic Resonance Imaging Market in US Volume Share (%), by Country 2024 & 2032
- Figure 39: Europe Magnetic Resonance Imaging Market in US Revenue (Million), by Architecture 2024 & 2032
- Figure 40: Europe Magnetic Resonance Imaging Market in US Volume (Piece), by Architecture 2024 & 2032
- Figure 41: Europe Magnetic Resonance Imaging Market in US Revenue Share (%), by Architecture 2024 & 2032
- Figure 42: Europe Magnetic Resonance Imaging Market in US Volume Share (%), by Architecture 2024 & 2032
- Figure 43: Europe Magnetic Resonance Imaging Market in US Revenue (Million), by Field Strength 2024 & 2032
- Figure 44: Europe Magnetic Resonance Imaging Market in US Volume (Piece), by Field Strength 2024 & 2032
- Figure 45: Europe Magnetic Resonance Imaging Market in US Revenue Share (%), by Field Strength 2024 & 2032
- Figure 46: Europe Magnetic Resonance Imaging Market in US Volume Share (%), by Field Strength 2024 & 2032
- Figure 47: Europe Magnetic Resonance Imaging Market in US Revenue (Million), by Application 2024 & 2032
- Figure 48: Europe Magnetic Resonance Imaging Market in US Volume (Piece), by Application 2024 & 2032
- Figure 49: Europe Magnetic Resonance Imaging Market in US Revenue Share (%), by Application 2024 & 2032
- Figure 50: Europe Magnetic Resonance Imaging Market in US Volume Share (%), by Application 2024 & 2032
- Figure 51: Europe Magnetic Resonance Imaging Market in US Revenue (Million), by Country 2024 & 2032
- Figure 52: Europe Magnetic Resonance Imaging Market in US Volume (Piece), by Country 2024 & 2032
- Figure 53: Europe Magnetic Resonance Imaging Market in US Revenue Share (%), by Country 2024 & 2032
- Figure 54: Europe Magnetic Resonance Imaging Market in US Volume Share (%), by Country 2024 & 2032
- Figure 55: Middle East & Africa Magnetic Resonance Imaging Market in US Revenue (Million), by Architecture 2024 & 2032
- Figure 56: Middle East & Africa Magnetic Resonance Imaging Market in US Volume (Piece), by Architecture 2024 & 2032
- Figure 57: Middle East & Africa Magnetic Resonance Imaging Market in US Revenue Share (%), by Architecture 2024 & 2032
- Figure 58: Middle East & Africa Magnetic Resonance Imaging Market in US Volume Share (%), by Architecture 2024 & 2032
- Figure 59: Middle East & Africa Magnetic Resonance Imaging Market in US Revenue (Million), by Field Strength 2024 & 2032
- Figure 60: Middle East & Africa Magnetic Resonance Imaging Market in US Volume (Piece), by Field Strength 2024 & 2032
- Figure 61: Middle East & Africa Magnetic Resonance Imaging Market in US Revenue Share (%), by Field Strength 2024 & 2032
- Figure 62: Middle East & Africa Magnetic Resonance Imaging Market in US Volume Share (%), by Field Strength 2024 & 2032
- Figure 63: Middle East & Africa Magnetic Resonance Imaging Market in US Revenue (Million), by Application 2024 & 2032
- Figure 64: Middle East & Africa Magnetic Resonance Imaging Market in US Volume (Piece), by Application 2024 & 2032
- Figure 65: Middle East & Africa Magnetic Resonance Imaging Market in US Revenue Share (%), by Application 2024 & 2032
- Figure 66: Middle East & Africa Magnetic Resonance Imaging Market in US Volume Share (%), by Application 2024 & 2032
- Figure 67: Middle East & Africa Magnetic Resonance Imaging Market in US Revenue (Million), by Country 2024 & 2032
- Figure 68: Middle East & Africa Magnetic Resonance Imaging Market in US Volume (Piece), by Country 2024 & 2032
- Figure 69: Middle East & Africa Magnetic Resonance Imaging Market in US Revenue Share (%), by Country 2024 & 2032
- Figure 70: Middle East & Africa Magnetic Resonance Imaging Market in US Volume Share (%), by Country 2024 & 2032
- Figure 71: Asia Pacific Magnetic Resonance Imaging Market in US Revenue (Million), by Architecture 2024 & 2032
- Figure 72: Asia Pacific Magnetic Resonance Imaging Market in US Volume (Piece), by Architecture 2024 & 2032
- Figure 73: Asia Pacific Magnetic Resonance Imaging Market in US Revenue Share (%), by Architecture 2024 & 2032
- Figure 74: Asia Pacific Magnetic Resonance Imaging Market in US Volume Share (%), by Architecture 2024 & 2032
- Figure 75: Asia Pacific Magnetic Resonance Imaging Market in US Revenue (Million), by Field Strength 2024 & 2032
- Figure 76: Asia Pacific Magnetic Resonance Imaging Market in US Volume (Piece), by Field Strength 2024 & 2032
- Figure 77: Asia Pacific Magnetic Resonance Imaging Market in US Revenue Share (%), by Field Strength 2024 & 2032
- Figure 78: Asia Pacific Magnetic Resonance Imaging Market in US Volume Share (%), by Field Strength 2024 & 2032
- Figure 79: Asia Pacific Magnetic Resonance Imaging Market in US Revenue (Million), by Application 2024 & 2032
- Figure 80: Asia Pacific Magnetic Resonance Imaging Market in US Volume (Piece), by Application 2024 & 2032
- Figure 81: Asia Pacific Magnetic Resonance Imaging Market in US Revenue Share (%), by Application 2024 & 2032
- Figure 82: Asia Pacific Magnetic Resonance Imaging Market in US Volume Share (%), by Application 2024 & 2032
- Figure 83: Asia Pacific Magnetic Resonance Imaging Market in US Revenue (Million), by Country 2024 & 2032
- Figure 84: Asia Pacific Magnetic Resonance Imaging Market in US Volume (Piece), by Country 2024 & 2032
- Figure 85: Asia Pacific Magnetic Resonance Imaging Market in US Revenue Share (%), by Country 2024 & 2032
- Figure 86: Asia Pacific Magnetic Resonance Imaging Market in US Volume Share (%), by Country 2024 & 2032
List of Tables
- Table 1: Global Magnetic Resonance Imaging Market in US Revenue Million Forecast, by Region 2019 & 2032
- Table 2: Global Magnetic Resonance Imaging Market in US Volume Piece Forecast, by Region 2019 & 2032
- Table 3: Global Magnetic Resonance Imaging Market in US Revenue Million Forecast, by Architecture 2019 & 2032
- Table 4: Global Magnetic Resonance Imaging Market in US Volume Piece Forecast, by Architecture 2019 & 2032
- Table 5: Global Magnetic Resonance Imaging Market in US Revenue Million Forecast, by Field Strength 2019 & 2032
- Table 6: Global Magnetic Resonance Imaging Market in US Volume Piece Forecast, by Field Strength 2019 & 2032
- Table 7: Global Magnetic Resonance Imaging Market in US Revenue Million Forecast, by Application 2019 & 2032
- Table 8: Global Magnetic Resonance Imaging Market in US Volume Piece Forecast, by Application 2019 & 2032
- Table 9: Global Magnetic Resonance Imaging Market in US Revenue Million Forecast, by Region 2019 & 2032
- Table 10: Global Magnetic Resonance Imaging Market in US Volume Piece Forecast, by Region 2019 & 2032
- Table 11: Global Magnetic Resonance Imaging Market in US Revenue Million Forecast, by Country 2019 & 2032
- Table 12: Global Magnetic Resonance Imaging Market in US Volume Piece Forecast, by Country 2019 & 2032
- Table 13: Northeast Magnetic Resonance Imaging Market in US Revenue (Million) Forecast, by Application 2019 & 2032
- Table 14: Northeast Magnetic Resonance Imaging Market in US Volume (Piece) Forecast, by Application 2019 & 2032
- Table 15: Southeast Magnetic Resonance Imaging Market in US Revenue (Million) Forecast, by Application 2019 & 2032
- Table 16: Southeast Magnetic Resonance Imaging Market in US Volume (Piece) Forecast, by Application 2019 & 2032
- Table 17: Midwest Magnetic Resonance Imaging Market in US Revenue (Million) Forecast, by Application 2019 & 2032
- Table 18: Midwest Magnetic Resonance Imaging Market in US Volume (Piece) Forecast, by Application 2019 & 2032
- Table 19: Southwest Magnetic Resonance Imaging Market in US Revenue (Million) Forecast, by Application 2019 & 2032
- Table 20: Southwest Magnetic Resonance Imaging Market in US Volume (Piece) Forecast, by Application 2019 & 2032
- Table 21: West Magnetic Resonance Imaging Market in US Revenue (Million) Forecast, by Application 2019 & 2032
- Table 22: West Magnetic Resonance Imaging Market in US Volume (Piece) Forecast, by Application 2019 & 2032
- Table 23: Global Magnetic Resonance Imaging Market in US Revenue Million Forecast, by Architecture 2019 & 2032
- Table 24: Global Magnetic Resonance Imaging Market in US Volume Piece Forecast, by Architecture 2019 & 2032
- Table 25: Global Magnetic Resonance Imaging Market in US Revenue Million Forecast, by Field Strength 2019 & 2032
- Table 26: Global Magnetic Resonance Imaging Market in US Volume Piece Forecast, by Field Strength 2019 & 2032
- Table 27: Global Magnetic Resonance Imaging Market in US Revenue Million Forecast, by Application 2019 & 2032
- Table 28: Global Magnetic Resonance Imaging Market in US Volume Piece Forecast, by Application 2019 & 2032
- Table 29: Global Magnetic Resonance Imaging Market in US Revenue Million Forecast, by Country 2019 & 2032
- Table 30: Global Magnetic Resonance Imaging Market in US Volume Piece Forecast, by Country 2019 & 2032
- Table 31: United States Magnetic Resonance Imaging Market in US Revenue (Million) Forecast, by Application 2019 & 2032
- Table 32: United States Magnetic Resonance Imaging Market in US Volume (Piece) Forecast, by Application 2019 & 2032
- Table 33: Canada Magnetic Resonance Imaging Market in US Revenue (Million) Forecast, by Application 2019 & 2032
- Table 34: Canada Magnetic Resonance Imaging Market in US Volume (Piece) Forecast, by Application 2019 & 2032
- Table 35: Mexico Magnetic Resonance Imaging Market in US Revenue (Million) Forecast, by Application 2019 & 2032
- Table 36: Mexico Magnetic Resonance Imaging Market in US Volume (Piece) Forecast, by Application 2019 & 2032
- Table 37: Global Magnetic Resonance Imaging Market in US Revenue Million Forecast, by Architecture 2019 & 2032
- Table 38: Global Magnetic Resonance Imaging Market in US Volume Piece Forecast, by Architecture 2019 & 2032
- Table 39: Global Magnetic Resonance Imaging Market in US Revenue Million Forecast, by Field Strength 2019 & 2032
- Table 40: Global Magnetic Resonance Imaging Market in US Volume Piece Forecast, by Field Strength 2019 & 2032
- Table 41: Global Magnetic Resonance Imaging Market in US Revenue Million Forecast, by Application 2019 & 2032
- Table 42: Global Magnetic Resonance Imaging Market in US Volume Piece Forecast, by Application 2019 & 2032
- Table 43: Global Magnetic Resonance Imaging Market in US Revenue Million Forecast, by Country 2019 & 2032
- Table 44: Global Magnetic Resonance Imaging Market in US Volume Piece Forecast, by Country 2019 & 2032
- Table 45: Brazil Magnetic Resonance Imaging Market in US Revenue (Million) Forecast, by Application 2019 & 2032
- Table 46: Brazil Magnetic Resonance Imaging Market in US Volume (Piece) Forecast, by Application 2019 & 2032
- Table 47: Argentina Magnetic Resonance Imaging Market in US Revenue (Million) Forecast, by Application 2019 & 2032
- Table 48: Argentina Magnetic Resonance Imaging Market in US Volume (Piece) Forecast, by Application 2019 & 2032
- Table 49: Rest of South America Magnetic Resonance Imaging Market in US Revenue (Million) Forecast, by Application 2019 & 2032
- Table 50: Rest of South America Magnetic Resonance Imaging Market in US Volume (Piece) Forecast, by Application 2019 & 2032
- Table 51: Global Magnetic Resonance Imaging Market in US Revenue Million Forecast, by Architecture 2019 & 2032
- Table 52: Global Magnetic Resonance Imaging Market in US Volume Piece Forecast, by Architecture 2019 & 2032
- Table 53: Global Magnetic Resonance Imaging Market in US Revenue Million Forecast, by Field Strength 2019 & 2032
- Table 54: Global Magnetic Resonance Imaging Market in US Volume Piece Forecast, by Field Strength 2019 & 2032
- Table 55: Global Magnetic Resonance Imaging Market in US Revenue Million Forecast, by Application 2019 & 2032
- Table 56: Global Magnetic Resonance Imaging Market in US Volume Piece Forecast, by Application 2019 & 2032
- Table 57: Global Magnetic Resonance Imaging Market in US Revenue Million Forecast, by Country 2019 & 2032
- Table 58: Global Magnetic Resonance Imaging Market in US Volume Piece Forecast, by Country 2019 & 2032
- Table 59: United Kingdom Magnetic Resonance Imaging Market in US Revenue (Million) Forecast, by Application 2019 & 2032
- Table 60: United Kingdom Magnetic Resonance Imaging Market in US Volume (Piece) Forecast, by Application 2019 & 2032
- Table 61: Germany Magnetic Resonance Imaging Market in US Revenue (Million) Forecast, by Application 2019 & 2032
- Table 62: Germany Magnetic Resonance Imaging Market in US Volume (Piece) Forecast, by Application 2019 & 2032
- Table 63: France Magnetic Resonance Imaging Market in US Revenue (Million) Forecast, by Application 2019 & 2032
- Table 64: France Magnetic Resonance Imaging Market in US Volume (Piece) Forecast, by Application 2019 & 2032
- Table 65: Italy Magnetic Resonance Imaging Market in US Revenue (Million) Forecast, by Application 2019 & 2032
- Table 66: Italy Magnetic Resonance Imaging Market in US Volume (Piece) Forecast, by Application 2019 & 2032
- Table 67: Spain Magnetic Resonance Imaging Market in US Revenue (Million) Forecast, by Application 2019 & 2032
- Table 68: Spain Magnetic Resonance Imaging Market in US Volume (Piece) Forecast, by Application 2019 & 2032
- Table 69: Russia Magnetic Resonance Imaging Market in US Revenue (Million) Forecast, by Application 2019 & 2032
- Table 70: Russia Magnetic Resonance Imaging Market in US Volume (Piece) Forecast, by Application 2019 & 2032
- Table 71: Benelux Magnetic Resonance Imaging Market in US Revenue (Million) Forecast, by Application 2019 & 2032
- Table 72: Benelux Magnetic Resonance Imaging Market in US Volume (Piece) Forecast, by Application 2019 & 2032
- Table 73: Nordics Magnetic Resonance Imaging Market in US Revenue (Million) Forecast, by Application 2019 & 2032
- Table 74: Nordics Magnetic Resonance Imaging Market in US Volume (Piece) Forecast, by Application 2019 & 2032
- Table 75: Rest of Europe Magnetic Resonance Imaging Market in US Revenue (Million) Forecast, by Application 2019 & 2032
- Table 76: Rest of Europe Magnetic Resonance Imaging Market in US Volume (Piece) Forecast, by Application 2019 & 2032
- Table 77: Global Magnetic Resonance Imaging Market in US Revenue Million Forecast, by Architecture 2019 & 2032
- Table 78: Global Magnetic Resonance Imaging Market in US Volume Piece Forecast, by Architecture 2019 & 2032
- Table 79: Global Magnetic Resonance Imaging Market in US Revenue Million Forecast, by Field Strength 2019 & 2032
- Table 80: Global Magnetic Resonance Imaging Market in US Volume Piece Forecast, by Field Strength 2019 & 2032
- Table 81: Global Magnetic Resonance Imaging Market in US Revenue Million Forecast, by Application 2019 & 2032
- Table 82: Global Magnetic Resonance Imaging Market in US Volume Piece Forecast, by Application 2019 & 2032
- Table 83: Global Magnetic Resonance Imaging Market in US Revenue Million Forecast, by Country 2019 & 2032
- Table 84: Global Magnetic Resonance Imaging Market in US Volume Piece Forecast, by Country 2019 & 2032
- Table 85: Turkey Magnetic Resonance Imaging Market in US Revenue (Million) Forecast, by Application 2019 & 2032
- Table 86: Turkey Magnetic Resonance Imaging Market in US Volume (Piece) Forecast, by Application 2019 & 2032
- Table 87: Israel Magnetic Resonance Imaging Market in US Revenue (Million) Forecast, by Application 2019 & 2032
- Table 88: Israel Magnetic Resonance Imaging Market in US Volume (Piece) Forecast, by Application 2019 & 2032
- Table 89: GCC Magnetic Resonance Imaging Market in US Revenue (Million) Forecast, by Application 2019 & 2032
- Table 90: GCC Magnetic Resonance Imaging Market in US Volume (Piece) Forecast, by Application 2019 & 2032
- Table 91: North Africa Magnetic Resonance Imaging Market in US Revenue (Million) Forecast, by Application 2019 & 2032
- Table 92: North Africa Magnetic Resonance Imaging Market in US Volume (Piece) Forecast, by Application 2019 & 2032
- Table 93: South Africa Magnetic Resonance Imaging Market in US Revenue (Million) Forecast, by Application 2019 & 2032
- Table 94: South Africa Magnetic Resonance Imaging Market in US Volume (Piece) Forecast, by Application 2019 & 2032
- Table 95: Rest of Middle East & Africa Magnetic Resonance Imaging Market in US Revenue (Million) Forecast, by Application 2019 & 2032
- Table 96: Rest of Middle East & Africa Magnetic Resonance Imaging Market in US Volume (Piece) Forecast, by Application 2019 & 2032
- Table 97: Global Magnetic Resonance Imaging Market in US Revenue Million Forecast, by Architecture 2019 & 2032
- Table 98: Global Magnetic Resonance Imaging Market in US Volume Piece Forecast, by Architecture 2019 & 2032
- Table 99: Global Magnetic Resonance Imaging Market in US Revenue Million Forecast, by Field Strength 2019 & 2032
- Table 100: Global Magnetic Resonance Imaging Market in US Volume Piece Forecast, by Field Strength 2019 & 2032
- Table 101: Global Magnetic Resonance Imaging Market in US Revenue Million Forecast, by Application 2019 & 2032
- Table 102: Global Magnetic Resonance Imaging Market in US Volume Piece Forecast, by Application 2019 & 2032
- Table 103: Global Magnetic Resonance Imaging Market in US Revenue Million Forecast, by Country 2019 & 2032
- Table 104: Global Magnetic Resonance Imaging Market in US Volume Piece Forecast, by Country 2019 & 2032
- Table 105: China Magnetic Resonance Imaging Market in US Revenue (Million) Forecast, by Application 2019 & 2032
- Table 106: China Magnetic Resonance Imaging Market in US Volume (Piece) Forecast, by Application 2019 & 2032
- Table 107: India Magnetic Resonance Imaging Market in US Revenue (Million) Forecast, by Application 2019 & 2032
- Table 108: India Magnetic Resonance Imaging Market in US Volume (Piece) Forecast, by Application 2019 & 2032
- Table 109: Japan Magnetic Resonance Imaging Market in US Revenue (Million) Forecast, by Application 2019 & 2032
- Table 110: Japan Magnetic Resonance Imaging Market in US Volume (Piece) Forecast, by Application 2019 & 2032
- Table 111: South Korea Magnetic Resonance Imaging Market in US Revenue (Million) Forecast, by Application 2019 & 2032
- Table 112: South Korea Magnetic Resonance Imaging Market in US Volume (Piece) Forecast, by Application 2019 & 2032
- Table 113: ASEAN Magnetic Resonance Imaging Market in US Revenue (Million) Forecast, by Application 2019 & 2032
- Table 114: ASEAN Magnetic Resonance Imaging Market in US Volume (Piece) Forecast, by Application 2019 & 2032
- Table 115: Oceania Magnetic Resonance Imaging Market in US Revenue (Million) Forecast, by Application 2019 & 2032
- Table 116: Oceania Magnetic Resonance Imaging Market in US Volume (Piece) Forecast, by Application 2019 & 2032
- Table 117: Rest of Asia Pacific Magnetic Resonance Imaging Market in US Revenue (Million) Forecast, by Application 2019 & 2032
- Table 118: Rest of Asia Pacific Magnetic Resonance Imaging Market in US Volume (Piece) Forecast, by Application 2019 & 2032
Frequently Asked Questions
1. What is the projected Compound Annual Growth Rate (CAGR) of the Magnetic Resonance Imaging Market in US?
The projected CAGR is approximately 5.95%.
2. Which companies are prominent players in the Magnetic Resonance Imaging Market in US?
Key companies in the market include Siemens Healthcare GmbH, Fonar Corporation*List Not Exhaustive, Canon Inc (Canon Medical Systems Corporation), Shenzhen Anke High-tech Co Ltd, Esaote SpA, Aurora Imaging Technology, Koninklijke Philips N V, GE HealthCare, Neusoft Medical Systems Co Ltd, Fujifilm Holdings Corporation.
3. What are the main segments of the Magnetic Resonance Imaging Market in US?
The market segments include Architecture, Field Strength, Application.
4. Can you provide details about the market size?
The market size is estimated to be USD 3.42 Million as of 2022.
5. What are some drivers contributing to market growth?
Growing Burden of Chronic Diseases; Advancements in MRI Systems and Availability of Universal Health Coverage.
6. What are the notable trends driving market growth?
Neurology Segment is Expected to Witness Significant Growth Over the Forecast Period.
7. Are there any restraints impacting market growth?
High Cost of MRI Systems.
8. Can you provide examples of recent developments in the market?
June 2023: GE HealthCare launched its FDA-cleared Sonic DL, a state-of-the-art deep learning-based technology designed to dramatically accelerate image acquisition in magnetic resonance imaging (MRI). Sonic DL enables new imaging paradigms, such as high-quality cardiac MRI in a single heartbeat.
9. What pricing options are available for accessing the report?
Pricing options include single-user, multi-user, and enterprise licenses priced at USD 3800, USD 4500, and USD 5800 respectively.
10. Is the market size provided in terms of value or volume?
The market size is provided in terms of value, measured in Million and volume, measured in Piece.
11. Are there any specific market keywords associated with the report?
Yes, the market keyword associated with the report is "Magnetic Resonance Imaging Market in US," which aids in identifying and referencing the specific market segment covered.
12. How do I determine which pricing option suits my needs best?
The pricing options vary based on user requirements and access needs. Individual users may opt for single-user licenses, while businesses requiring broader access may choose multi-user or enterprise licenses for cost-effective access to the report.
13. Are there any additional resources or data provided in the Magnetic Resonance Imaging Market in US report?
While the report offers comprehensive insights, it's advisable to review the specific contents or supplementary materials provided to ascertain if additional resources or data are available.
14. How can I stay updated on further developments or reports in the Magnetic Resonance Imaging Market in US?
To stay informed about further developments, trends, and reports in the Magnetic Resonance Imaging Market in US, consider subscribing to industry newsletters, following relevant companies and organizations, or regularly checking reputable industry news sources and publications.
Methodology
Step 1 - Identification of Relevant Samples Size from Population Database


Step 2 - Approaches for Defining Global Market Size (Value, Volume* & Price*)

Note*: In applicable scenarios
Step 3 - Data Sources
Primary Research
- Web Analytics
- Survey Reports
- Research Institute
- Latest Research Reports
- Opinion Leaders
Secondary Research
- Annual Reports
- White Paper
- Latest Press Release
- Industry Association
- Paid Database
- Investor Presentations

Step 4 - Data Triangulation
Involves using different sources of information in order to increase the validity of a study
These sources are likely to be stakeholders in a program - participants, other researchers, program staff, other community members, and so on.
Then we put all data in single framework & apply various statistical tools to find out the dynamic on the market.
During the analysis stage, feedback from the stakeholder groups would be compared to determine areas of agreement as well as areas of divergence
