

Key Insights
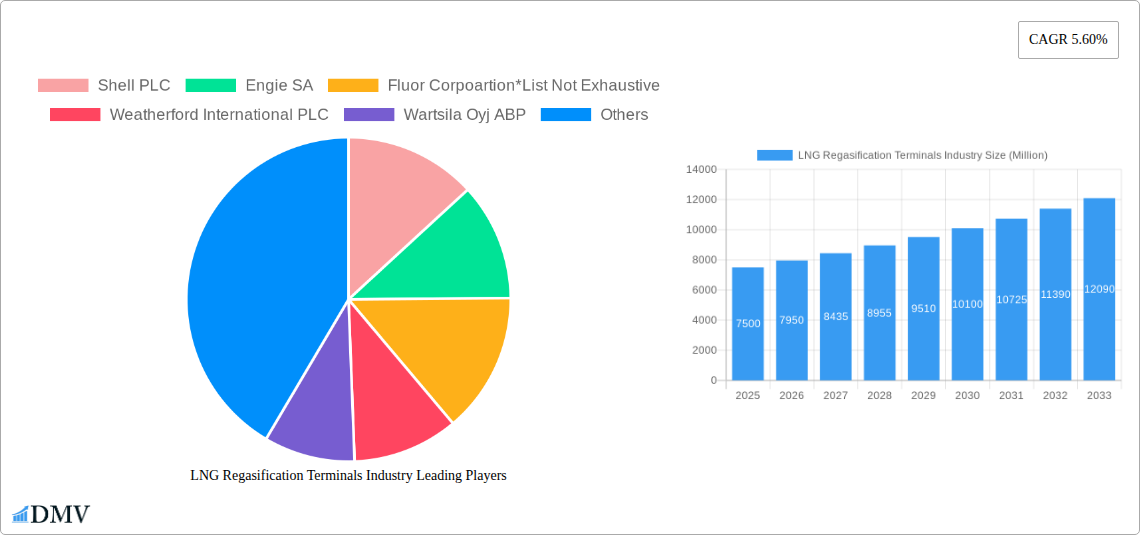
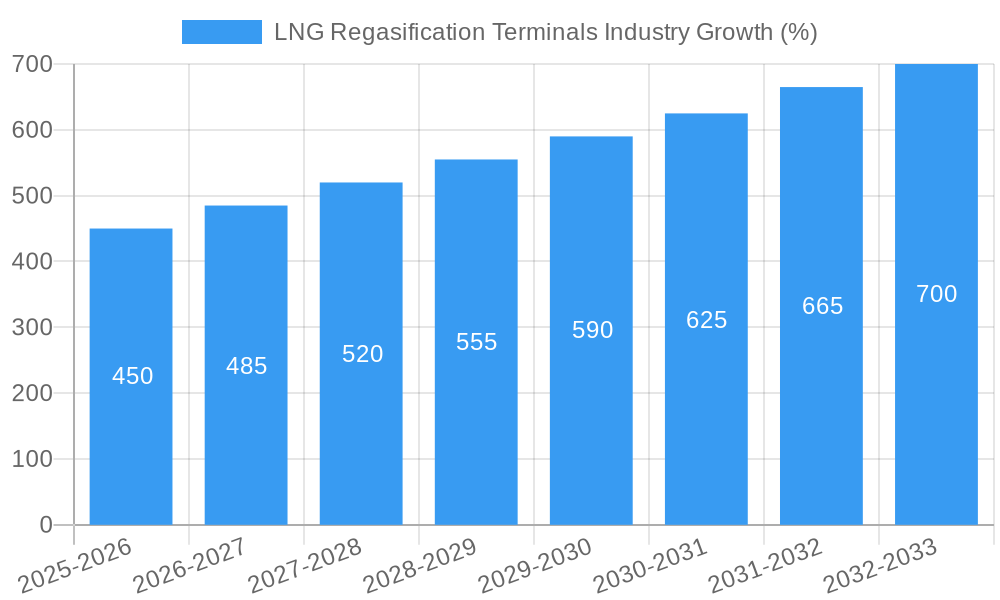
The LNG Regasification Terminals market is experiencing robust growth, driven by increasing global demand for natural gas as a cleaner alternative to coal and oil, particularly in regions facing energy security concerns. The market's Compound Annual Growth Rate (CAGR) of 5.60% from 2019-2024 suggests a steadily expanding market, projected to continue its upward trajectory through 2033. Several factors contribute to this growth, including the rising adoption of LNG as a fuel source for power generation and industrial applications, coupled with supportive government policies aimed at promoting cleaner energy sources and diversifying energy portfolios. The expansion of LNG import infrastructure, including large-scale and small-to-medium-scale terminals, both onshore and floating, is a critical element fueling this market expansion. This is particularly true in regions with limited domestic natural gas resources, making LNG regasification terminals vital for securing energy supplies. Competition among established players like Shell PLC, Engie SA, and Fluor Corporation, alongside other significant players, drives innovation and efficiency improvements within the sector, further enhancing market growth. However, the market faces challenges, including fluctuating LNG prices, geopolitical uncertainties impacting supply chains, and the increasing adoption of renewable energy sources that might moderate the growth rate in the longer term.
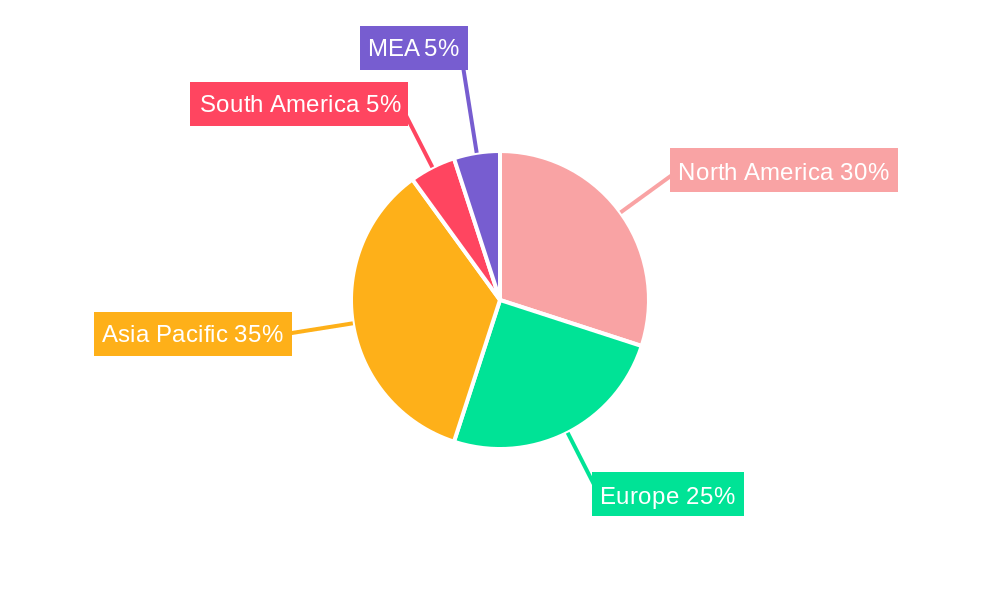
The geographical distribution of LNG regasification terminals is heavily influenced by regional energy demands and import needs. North America, Europe, and Asia Pacific are currently the dominant regions, with significant investments and operational capacity. However, emerging markets in South America and the Middle East and Africa are experiencing increasing demand, which presents substantial growth opportunities for new terminal developments. The segment breakdown reveals a preference for large-scale terminals due to economies of scale, yet the small-to-medium-scale segment demonstrates significant potential in regions requiring more localized and flexible infrastructure solutions. Floating regasification units (FRUs) offer flexibility and cost-effectiveness, especially in areas with challenging geographic conditions or where quicker deployment is needed. The market's continued growth hinges on the interplay of these driving forces, the effective management of potential restraints, and the strategic investments made across different geographical regions and terminal types.
LNG Regasification Terminals Industry Market Report: 2019-2033
This comprehensive report provides an in-depth analysis of the LNG Regasification Terminals industry, offering valuable insights for stakeholders seeking to navigate this dynamic market. The study period covers 2019-2033, with a base year of 2025 and a forecast period of 2025-2033. We analyze market trends, technological advancements, key players, and future opportunities, providing a complete picture of this critical energy infrastructure sector. The report is crucial for investors, industry professionals, and policymakers seeking a detailed understanding of the LNG regasification market's current state and future trajectory. The total market value in 2025 is estimated at $XX Million.
LNG Regasification Terminals Industry Market Composition & Trends
The LNG Regasification Terminals market exhibits a moderately concentrated structure, with key players like Shell PLC, Engie SA, and Fluor Corporation holding significant market share. However, the market is witnessing increased participation from smaller players, particularly in niche segments. Innovation is primarily driven by advancements in FSRU (Floating Storage Regasification Unit) technology, aimed at reducing capital expenditure and deployment time. Regulatory landscapes vary significantly across regions, influencing project development timelines and investment decisions. Substitute products, such as pipeline gas and other energy sources, exert competitive pressure. End-user profiles are diverse, spanning power generation companies, industrial consumers, and city gas distributors. M&A activity has been relatively moderate, with deal values averaging $XX Million in recent years.
- Market Share Distribution (2025): Shell PLC (XX%), Engie SA (XX%), Fluor Corporation (XX%), Others (XX%)
- Average M&A Deal Value (2019-2024): $XX Million
- Key Innovation Catalysts: FSRU technology, automation, remote monitoring
- Major Regulatory Influences: Permitting processes, environmental regulations, gas pricing policies
LNG Regasification Terminals Industry Industry Evolution
The LNG regasification terminals market has witnessed significant growth from 2019 to 2024, with a Compound Annual Growth Rate (CAGR) of XX%. This growth is attributed to increasing global LNG demand driven by the transition away from coal and other fossil fuels, coupled with rising energy consumption in developing nations. Technological advancements, including the adoption of modular and standardized designs for terminals, are facilitating faster project deployment and cost reduction. Shifting consumer demands favor flexible and efficient LNG supply solutions, leading to increased interest in floating terminals. We project a CAGR of XX% for the period of 2025-2033, with the market reaching $XX Million by 2033. This projection considers the impact of ongoing geopolitical shifts, renewable energy integration, and evolving regulatory policies.
Leading Regions, Countries, or Segments in LNG Regasification Terminals Industry
The Asia-Pacific region dominates the LNG regasification terminals market, driven by rapid economic growth and substantial energy demand from countries like China, Japan, and South Korea. Within this region, large-scale onshore terminals represent the largest segment due to their ability to handle high volumes. However, floating terminals are gaining traction in regions with limited onshore infrastructure or where rapid deployment is critical.
Key Drivers:
- Asia-Pacific: High energy demand, supportive government policies, substantial investments in LNG infrastructure.
- Europe: Energy security concerns, increasing LNG imports to diversify energy sources.
- North America: Growth driven by LNG export projects and increasing domestic demand.
Segment Dominance:
- Terminal Type: Large-scale terminals dominate due to economies of scale, but the small to medium scale segment is expanding rapidly, driven by growing demand from smaller consumers.
- Deployment: Onshore terminals currently hold a larger market share, but the floating segment is experiencing rapid growth.
LNG Regasification Terminals Industry Product Innovations
Recent innovations focus on enhancing terminal efficiency, reducing environmental impact, and improving safety. This includes advancements in regasification technologies, automated control systems, and advanced safety features. The adoption of FSRUs significantly improves deployment speed and reduces capital expenditures, offering a compelling value proposition. Furthermore, the development of smaller-scale terminals, designed for flexibility and adaptability, caters to emerging markets with less significant infrastructure needs.
Propelling Factors for LNG Regasification Terminals Industry Growth
The LNG regasification terminals market is propelled by several key factors. Firstly, the increasing global demand for natural gas as a cleaner alternative to coal significantly drives growth. Secondly, supportive government policies and regulations incentivize LNG infrastructure development, aiding investment. Finally, technological advancements in FSRU technology are accelerating the deployment of regasification facilities.
Obstacles in the LNG Regasification Terminals Industry Market
Significant obstacles include obtaining necessary permits and approvals, which can lead to delays and increased costs. The global supply chain disruptions significantly impact project timelines and budgets. Moreover, intense competition from other energy sources and the volatility of LNG prices create challenges for investors and operators.
Future Opportunities in LNG Regasification Terminals Industry
Future opportunities lie in expanding into emerging markets, particularly in Africa and South America. Advancements in modular and small-scale terminals offer greater adaptability and cost-effectiveness. Additionally, the integration of renewable energy sources within LNG terminal complexes creates new synergy opportunities.
Major Players in the LNG Regasification Terminals Industry Ecosystem
- Shell PLC
- Engie SA
- Fluor Corporation
- Weatherford International PLC
- Wartsila Oyj ABP
- Linde plc
- Baker Hughes Company
- Schlumberger Limited
Key Developments in LNG Regasification Terminals Industry Industry
- September 2021: South Africa announces plans for its first LNG import and distribution terminal, opting for an FSRU configuration.
- January 2021: ExxonMobil and Royal Vopak sign an MOU to study the feasibility of an LNG regasification terminal in South Africa.
Strategic LNG Regasification Terminals Industry Market Forecast
The LNG regasification terminals market is poised for sustained growth, driven by rising global LNG demand and the growing adoption of FSRUs. Emerging markets and technological advancements present substantial opportunities. The market's future trajectory hinges on geopolitical stability, regulatory frameworks, and the continued transition towards cleaner energy sources. This creates significant potential for expansion and investment within the sector.
LNG Regasification Terminals Industry Segmentation
-
1. Terminal Type
- 1.1. large Scale
- 1.2. Small Scale & Medium
-
2. Deployment
- 2.1. Onshore
- 2.2. Floating
LNG Regasification Terminals Industry Segmentation By Geography
- 1. North America
- 2. South America
- 3. Asia Pacific
- 4. Europe
- 5. Middle East and Africa
LNG Regasification Terminals Industry REPORT HIGHLIGHTS
| Aspects | Details |
|---|---|
| Study Period | 2019-2033 |
| Base Year | 2024 |
| Estimated Year | 2025 |
| Forecast Period | 2025-2033 |
| Historical Period | 2019-2024 |
| Growth Rate | CAGR of 5.60% from 2019-2033 |
| Segmentation |
|
Table of Contents
- 1. Introduction
- 1.1. Research Scope
- 1.2. Market Segmentation
- 1.3. Research Methodology
- 1.4. Definitions and Assumptions
- 2. Executive Summary
- 2.1. Introduction
- 3. Market Dynamics
- 3.1. Introduction
- 3.2. Market Drivers
- 3.2.1. 4.; The Rise in Oil and Gas Drilling Activities4.; Increased Shale Gas Exploration
- 3.3. Market Restrains
- 3.3.1. 4.; Increasing Share of Renewable Energy
- 3.4. Market Trends
- 3.4.1. The Floating Regasification Terminals Segment is Expected to Dominate the Market
- 4. Market Factor Analysis
- 4.1. Porters Five Forces
- 4.2. Supply/Value Chain
- 4.3. PESTEL analysis
- 4.4. Market Entropy
- 4.5. Patent/Trademark Analysis
- 5. Global LNG Regasification Terminals Industry Analysis, Insights and Forecast, 2019-2031
- 5.1. Market Analysis, Insights and Forecast - by Terminal Type
- 5.1.1. large Scale
- 5.1.2. Small Scale & Medium
- 5.2. Market Analysis, Insights and Forecast - by Deployment
- 5.2.1. Onshore
- 5.2.2. Floating
- 5.3. Market Analysis, Insights and Forecast - by Region
- 5.3.1. North America
- 5.3.2. South America
- 5.3.3. Asia Pacific
- 5.3.4. Europe
- 5.3.5. Middle East and Africa
- 5.1. Market Analysis, Insights and Forecast - by Terminal Type
- 6. North America LNG Regasification Terminals Industry Analysis, Insights and Forecast, 2019-2031
- 6.1. Market Analysis, Insights and Forecast - by Terminal Type
- 6.1.1. large Scale
- 6.1.2. Small Scale & Medium
- 6.2. Market Analysis, Insights and Forecast - by Deployment
- 6.2.1. Onshore
- 6.2.2. Floating
- 6.1. Market Analysis, Insights and Forecast - by Terminal Type
- 7. South America LNG Regasification Terminals Industry Analysis, Insights and Forecast, 2019-2031
- 7.1. Market Analysis, Insights and Forecast - by Terminal Type
- 7.1.1. large Scale
- 7.1.2. Small Scale & Medium
- 7.2. Market Analysis, Insights and Forecast - by Deployment
- 7.2.1. Onshore
- 7.2.2. Floating
- 7.1. Market Analysis, Insights and Forecast - by Terminal Type
- 8. Asia Pacific LNG Regasification Terminals Industry Analysis, Insights and Forecast, 2019-2031
- 8.1. Market Analysis, Insights and Forecast - by Terminal Type
- 8.1.1. large Scale
- 8.1.2. Small Scale & Medium
- 8.2. Market Analysis, Insights and Forecast - by Deployment
- 8.2.1. Onshore
- 8.2.2. Floating
- 8.1. Market Analysis, Insights and Forecast - by Terminal Type
- 9. Europe LNG Regasification Terminals Industry Analysis, Insights and Forecast, 2019-2031
- 9.1. Market Analysis, Insights and Forecast - by Terminal Type
- 9.1.1. large Scale
- 9.1.2. Small Scale & Medium
- 9.2. Market Analysis, Insights and Forecast - by Deployment
- 9.2.1. Onshore
- 9.2.2. Floating
- 9.1. Market Analysis, Insights and Forecast - by Terminal Type
- 10. Middle East and Africa LNG Regasification Terminals Industry Analysis, Insights and Forecast, 2019-2031
- 10.1. Market Analysis, Insights and Forecast - by Terminal Type
- 10.1.1. large Scale
- 10.1.2. Small Scale & Medium
- 10.2. Market Analysis, Insights and Forecast - by Deployment
- 10.2.1. Onshore
- 10.2.2. Floating
- 10.1. Market Analysis, Insights and Forecast - by Terminal Type
- 11. North America LNG Regasification Terminals Industry Analysis, Insights and Forecast, 2019-2031
- 11.1. Market Analysis, Insights and Forecast - By Country/Sub-region
- 11.1.1 United States
- 11.1.2 Canada
- 11.1.3 Mexico
- 12. Europe LNG Regasification Terminals Industry Analysis, Insights and Forecast, 2019-2031
- 12.1. Market Analysis, Insights and Forecast - By Country/Sub-region
- 12.1.1 Germany
- 12.1.2 United Kingdom
- 12.1.3 France
- 12.1.4 Spain
- 12.1.5 Italy
- 12.1.6 Spain
- 12.1.7 Belgium
- 12.1.8 Netherland
- 12.1.9 Nordics
- 12.1.10 Rest of Europe
- 13. Asia Pacific LNG Regasification Terminals Industry Analysis, Insights and Forecast, 2019-2031
- 13.1. Market Analysis, Insights and Forecast - By Country/Sub-region
- 13.1.1 China
- 13.1.2 Japan
- 13.1.3 India
- 13.1.4 South Korea
- 13.1.5 Southeast Asia
- 13.1.6 Australia
- 13.1.7 Indonesia
- 13.1.8 Phillipes
- 13.1.9 Singapore
- 13.1.10 Thailandc
- 13.1.11 Rest of Asia Pacific
- 14. South America LNG Regasification Terminals Industry Analysis, Insights and Forecast, 2019-2031
- 14.1. Market Analysis, Insights and Forecast - By Country/Sub-region
- 14.1.1 Brazil
- 14.1.2 Argentina
- 14.1.3 Peru
- 14.1.4 Chile
- 14.1.5 Colombia
- 14.1.6 Ecuador
- 14.1.7 Venezuela
- 14.1.8 Rest of South America
- 15. North America LNG Regasification Terminals Industry Analysis, Insights and Forecast, 2019-2031
- 15.1. Market Analysis, Insights and Forecast - By Country/Sub-region
- 15.1.1 United States
- 15.1.2 Canada
- 15.1.3 Mexico
- 16. MEA LNG Regasification Terminals Industry Analysis, Insights and Forecast, 2019-2031
- 16.1. Market Analysis, Insights and Forecast - By Country/Sub-region
- 16.1.1 United Arab Emirates
- 16.1.2 Saudi Arabia
- 16.1.3 South Africa
- 16.1.4 Rest of Middle East and Africa
- 17. Competitive Analysis
- 17.1. Global Market Share Analysis 2024
- 17.2. Company Profiles
- 17.2.1 Shell PLC
- 17.2.1.1. Overview
- 17.2.1.2. Products
- 17.2.1.3. SWOT Analysis
- 17.2.1.4. Recent Developments
- 17.2.1.5. Financials (Based on Availability)
- 17.2.2 Engie SA
- 17.2.2.1. Overview
- 17.2.2.2. Products
- 17.2.2.3. SWOT Analysis
- 17.2.2.4. Recent Developments
- 17.2.2.5. Financials (Based on Availability)
- 17.2.3 Fluor Corpoartion*List Not Exhaustive
- 17.2.3.1. Overview
- 17.2.3.2. Products
- 17.2.3.3. SWOT Analysis
- 17.2.3.4. Recent Developments
- 17.2.3.5. Financials (Based on Availability)
- 17.2.4 Weatherford International PLC
- 17.2.4.1. Overview
- 17.2.4.2. Products
- 17.2.4.3. SWOT Analysis
- 17.2.4.4. Recent Developments
- 17.2.4.5. Financials (Based on Availability)
- 17.2.5 Wartsila Oyj ABP
- 17.2.5.1. Overview
- 17.2.5.2. Products
- 17.2.5.3. SWOT Analysis
- 17.2.5.4. Recent Developments
- 17.2.5.5. Financials (Based on Availability)
- 17.2.6 Linde plc
- 17.2.6.1. Overview
- 17.2.6.2. Products
- 17.2.6.3. SWOT Analysis
- 17.2.6.4. Recent Developments
- 17.2.6.5. Financials (Based on Availability)
- 17.2.7 Baker Hughes Company
- 17.2.7.1. Overview
- 17.2.7.2. Products
- 17.2.7.3. SWOT Analysis
- 17.2.7.4. Recent Developments
- 17.2.7.5. Financials (Based on Availability)
- 17.2.8 Schlumberger Limited
- 17.2.8.1. Overview
- 17.2.8.2. Products
- 17.2.8.3. SWOT Analysis
- 17.2.8.4. Recent Developments
- 17.2.8.5. Financials (Based on Availability)
- 17.2.1 Shell PLC
List of Figures
- Figure 1: Global LNG Regasification Terminals Industry Revenue Breakdown (Million, %) by Region 2024 & 2032
- Figure 2: North America LNG Regasification Terminals Industry Revenue (Million), by Country 2024 & 2032
- Figure 3: North America LNG Regasification Terminals Industry Revenue Share (%), by Country 2024 & 2032
- Figure 4: Europe LNG Regasification Terminals Industry Revenue (Million), by Country 2024 & 2032
- Figure 5: Europe LNG Regasification Terminals Industry Revenue Share (%), by Country 2024 & 2032
- Figure 6: Asia Pacific LNG Regasification Terminals Industry Revenue (Million), by Country 2024 & 2032
- Figure 7: Asia Pacific LNG Regasification Terminals Industry Revenue Share (%), by Country 2024 & 2032
- Figure 8: South America LNG Regasification Terminals Industry Revenue (Million), by Country 2024 & 2032
- Figure 9: South America LNG Regasification Terminals Industry Revenue Share (%), by Country 2024 & 2032
- Figure 10: North America LNG Regasification Terminals Industry Revenue (Million), by Country 2024 & 2032
- Figure 11: North America LNG Regasification Terminals Industry Revenue Share (%), by Country 2024 & 2032
- Figure 12: MEA LNG Regasification Terminals Industry Revenue (Million), by Country 2024 & 2032
- Figure 13: MEA LNG Regasification Terminals Industry Revenue Share (%), by Country 2024 & 2032
- Figure 14: North America LNG Regasification Terminals Industry Revenue (Million), by Terminal Type 2024 & 2032
- Figure 15: North America LNG Regasification Terminals Industry Revenue Share (%), by Terminal Type 2024 & 2032
- Figure 16: North America LNG Regasification Terminals Industry Revenue (Million), by Deployment 2024 & 2032
- Figure 17: North America LNG Regasification Terminals Industry Revenue Share (%), by Deployment 2024 & 2032
- Figure 18: North America LNG Regasification Terminals Industry Revenue (Million), by Country 2024 & 2032
- Figure 19: North America LNG Regasification Terminals Industry Revenue Share (%), by Country 2024 & 2032
- Figure 20: South America LNG Regasification Terminals Industry Revenue (Million), by Terminal Type 2024 & 2032
- Figure 21: South America LNG Regasification Terminals Industry Revenue Share (%), by Terminal Type 2024 & 2032
- Figure 22: South America LNG Regasification Terminals Industry Revenue (Million), by Deployment 2024 & 2032
- Figure 23: South America LNG Regasification Terminals Industry Revenue Share (%), by Deployment 2024 & 2032
- Figure 24: South America LNG Regasification Terminals Industry Revenue (Million), by Country 2024 & 2032
- Figure 25: South America LNG Regasification Terminals Industry Revenue Share (%), by Country 2024 & 2032
- Figure 26: Asia Pacific LNG Regasification Terminals Industry Revenue (Million), by Terminal Type 2024 & 2032
- Figure 27: Asia Pacific LNG Regasification Terminals Industry Revenue Share (%), by Terminal Type 2024 & 2032
- Figure 28: Asia Pacific LNG Regasification Terminals Industry Revenue (Million), by Deployment 2024 & 2032
- Figure 29: Asia Pacific LNG Regasification Terminals Industry Revenue Share (%), by Deployment 2024 & 2032
- Figure 30: Asia Pacific LNG Regasification Terminals Industry Revenue (Million), by Country 2024 & 2032
- Figure 31: Asia Pacific LNG Regasification Terminals Industry Revenue Share (%), by Country 2024 & 2032
- Figure 32: Europe LNG Regasification Terminals Industry Revenue (Million), by Terminal Type 2024 & 2032
- Figure 33: Europe LNG Regasification Terminals Industry Revenue Share (%), by Terminal Type 2024 & 2032
- Figure 34: Europe LNG Regasification Terminals Industry Revenue (Million), by Deployment 2024 & 2032
- Figure 35: Europe LNG Regasification Terminals Industry Revenue Share (%), by Deployment 2024 & 2032
- Figure 36: Europe LNG Regasification Terminals Industry Revenue (Million), by Country 2024 & 2032
- Figure 37: Europe LNG Regasification Terminals Industry Revenue Share (%), by Country 2024 & 2032
- Figure 38: Middle East and Africa LNG Regasification Terminals Industry Revenue (Million), by Terminal Type 2024 & 2032
- Figure 39: Middle East and Africa LNG Regasification Terminals Industry Revenue Share (%), by Terminal Type 2024 & 2032
- Figure 40: Middle East and Africa LNG Regasification Terminals Industry Revenue (Million), by Deployment 2024 & 2032
- Figure 41: Middle East and Africa LNG Regasification Terminals Industry Revenue Share (%), by Deployment 2024 & 2032
- Figure 42: Middle East and Africa LNG Regasification Terminals Industry Revenue (Million), by Country 2024 & 2032
- Figure 43: Middle East and Africa LNG Regasification Terminals Industry Revenue Share (%), by Country 2024 & 2032
List of Tables
- Table 1: Global LNG Regasification Terminals Industry Revenue Million Forecast, by Region 2019 & 2032
- Table 2: Global LNG Regasification Terminals Industry Revenue Million Forecast, by Terminal Type 2019 & 2032
- Table 3: Global LNG Regasification Terminals Industry Revenue Million Forecast, by Deployment 2019 & 2032
- Table 4: Global LNG Regasification Terminals Industry Revenue Million Forecast, by Region 2019 & 2032
- Table 5: Global LNG Regasification Terminals Industry Revenue Million Forecast, by Country 2019 & 2032
- Table 6: United States LNG Regasification Terminals Industry Revenue (Million) Forecast, by Application 2019 & 2032
- Table 7: Canada LNG Regasification Terminals Industry Revenue (Million) Forecast, by Application 2019 & 2032
- Table 8: Mexico LNG Regasification Terminals Industry Revenue (Million) Forecast, by Application 2019 & 2032
- Table 9: Global LNG Regasification Terminals Industry Revenue Million Forecast, by Country 2019 & 2032
- Table 10: Germany LNG Regasification Terminals Industry Revenue (Million) Forecast, by Application 2019 & 2032
- Table 11: United Kingdom LNG Regasification Terminals Industry Revenue (Million) Forecast, by Application 2019 & 2032
- Table 12: France LNG Regasification Terminals Industry Revenue (Million) Forecast, by Application 2019 & 2032
- Table 13: Spain LNG Regasification Terminals Industry Revenue (Million) Forecast, by Application 2019 & 2032
- Table 14: Italy LNG Regasification Terminals Industry Revenue (Million) Forecast, by Application 2019 & 2032
- Table 15: Spain LNG Regasification Terminals Industry Revenue (Million) Forecast, by Application 2019 & 2032
- Table 16: Belgium LNG Regasification Terminals Industry Revenue (Million) Forecast, by Application 2019 & 2032
- Table 17: Netherland LNG Regasification Terminals Industry Revenue (Million) Forecast, by Application 2019 & 2032
- Table 18: Nordics LNG Regasification Terminals Industry Revenue (Million) Forecast, by Application 2019 & 2032
- Table 19: Rest of Europe LNG Regasification Terminals Industry Revenue (Million) Forecast, by Application 2019 & 2032
- Table 20: Global LNG Regasification Terminals Industry Revenue Million Forecast, by Country 2019 & 2032
- Table 21: China LNG Regasification Terminals Industry Revenue (Million) Forecast, by Application 2019 & 2032
- Table 22: Japan LNG Regasification Terminals Industry Revenue (Million) Forecast, by Application 2019 & 2032
- Table 23: India LNG Regasification Terminals Industry Revenue (Million) Forecast, by Application 2019 & 2032
- Table 24: South Korea LNG Regasification Terminals Industry Revenue (Million) Forecast, by Application 2019 & 2032
- Table 25: Southeast Asia LNG Regasification Terminals Industry Revenue (Million) Forecast, by Application 2019 & 2032
- Table 26: Australia LNG Regasification Terminals Industry Revenue (Million) Forecast, by Application 2019 & 2032
- Table 27: Indonesia LNG Regasification Terminals Industry Revenue (Million) Forecast, by Application 2019 & 2032
- Table 28: Phillipes LNG Regasification Terminals Industry Revenue (Million) Forecast, by Application 2019 & 2032
- Table 29: Singapore LNG Regasification Terminals Industry Revenue (Million) Forecast, by Application 2019 & 2032
- Table 30: Thailandc LNG Regasification Terminals Industry Revenue (Million) Forecast, by Application 2019 & 2032
- Table 31: Rest of Asia Pacific LNG Regasification Terminals Industry Revenue (Million) Forecast, by Application 2019 & 2032
- Table 32: Global LNG Regasification Terminals Industry Revenue Million Forecast, by Country 2019 & 2032
- Table 33: Brazil LNG Regasification Terminals Industry Revenue (Million) Forecast, by Application 2019 & 2032
- Table 34: Argentina LNG Regasification Terminals Industry Revenue (Million) Forecast, by Application 2019 & 2032
- Table 35: Peru LNG Regasification Terminals Industry Revenue (Million) Forecast, by Application 2019 & 2032
- Table 36: Chile LNG Regasification Terminals Industry Revenue (Million) Forecast, by Application 2019 & 2032
- Table 37: Colombia LNG Regasification Terminals Industry Revenue (Million) Forecast, by Application 2019 & 2032
- Table 38: Ecuador LNG Regasification Terminals Industry Revenue (Million) Forecast, by Application 2019 & 2032
- Table 39: Venezuela LNG Regasification Terminals Industry Revenue (Million) Forecast, by Application 2019 & 2032
- Table 40: Rest of South America LNG Regasification Terminals Industry Revenue (Million) Forecast, by Application 2019 & 2032
- Table 41: Global LNG Regasification Terminals Industry Revenue Million Forecast, by Country 2019 & 2032
- Table 42: United States LNG Regasification Terminals Industry Revenue (Million) Forecast, by Application 2019 & 2032
- Table 43: Canada LNG Regasification Terminals Industry Revenue (Million) Forecast, by Application 2019 & 2032
- Table 44: Mexico LNG Regasification Terminals Industry Revenue (Million) Forecast, by Application 2019 & 2032
- Table 45: Global LNG Regasification Terminals Industry Revenue Million Forecast, by Country 2019 & 2032
- Table 46: United Arab Emirates LNG Regasification Terminals Industry Revenue (Million) Forecast, by Application 2019 & 2032
- Table 47: Saudi Arabia LNG Regasification Terminals Industry Revenue (Million) Forecast, by Application 2019 & 2032
- Table 48: South Africa LNG Regasification Terminals Industry Revenue (Million) Forecast, by Application 2019 & 2032
- Table 49: Rest of Middle East and Africa LNG Regasification Terminals Industry Revenue (Million) Forecast, by Application 2019 & 2032
- Table 50: Global LNG Regasification Terminals Industry Revenue Million Forecast, by Terminal Type 2019 & 2032
- Table 51: Global LNG Regasification Terminals Industry Revenue Million Forecast, by Deployment 2019 & 2032
- Table 52: Global LNG Regasification Terminals Industry Revenue Million Forecast, by Country 2019 & 2032
- Table 53: Global LNG Regasification Terminals Industry Revenue Million Forecast, by Terminal Type 2019 & 2032
- Table 54: Global LNG Regasification Terminals Industry Revenue Million Forecast, by Deployment 2019 & 2032
- Table 55: Global LNG Regasification Terminals Industry Revenue Million Forecast, by Country 2019 & 2032
- Table 56: Global LNG Regasification Terminals Industry Revenue Million Forecast, by Terminal Type 2019 & 2032
- Table 57: Global LNG Regasification Terminals Industry Revenue Million Forecast, by Deployment 2019 & 2032
- Table 58: Global LNG Regasification Terminals Industry Revenue Million Forecast, by Country 2019 & 2032
- Table 59: Global LNG Regasification Terminals Industry Revenue Million Forecast, by Terminal Type 2019 & 2032
- Table 60: Global LNG Regasification Terminals Industry Revenue Million Forecast, by Deployment 2019 & 2032
- Table 61: Global LNG Regasification Terminals Industry Revenue Million Forecast, by Country 2019 & 2032
- Table 62: Global LNG Regasification Terminals Industry Revenue Million Forecast, by Terminal Type 2019 & 2032
- Table 63: Global LNG Regasification Terminals Industry Revenue Million Forecast, by Deployment 2019 & 2032
- Table 64: Global LNG Regasification Terminals Industry Revenue Million Forecast, by Country 2019 & 2032
Frequently Asked Questions
1. What is the projected Compound Annual Growth Rate (CAGR) of the LNG Regasification Terminals Industry?
The projected CAGR is approximately 5.60%.
2. Which companies are prominent players in the LNG Regasification Terminals Industry?
Key companies in the market include Shell PLC, Engie SA, Fluor Corpoartion*List Not Exhaustive, Weatherford International PLC, Wartsila Oyj ABP, Linde plc, Baker Hughes Company, Schlumberger Limited.
3. What are the main segments of the LNG Regasification Terminals Industry?
The market segments include Terminal Type, Deployment.
4. Can you provide details about the market size?
The market size is estimated to be USD XX Million as of 2022.
5. What are some drivers contributing to market growth?
4.; The Rise in Oil and Gas Drilling Activities4.; Increased Shale Gas Exploration.
6. What are the notable trends driving market growth?
The Floating Regasification Terminals Segment is Expected to Dominate the Market.
7. Are there any restraints impacting market growth?
4.; Increasing Share of Renewable Energy.
8. Can you provide examples of recent developments in the market?
In September 2021, South Africa's state-owned Central Energy Fund (CEF) and its partners, state-owned logistics firm Transnet and the Coega Development Corporation (CDC) joined together for establishing the country's first LNG import and distribution terminal at the Ngqura (Coega) deepwater port in the Eastern Cape. According to the joint committee, A floating storage and regasification unit (FSRU) has been identified as the preferred terminal configuration for LNG import and distribution
9. What pricing options are available for accessing the report?
Pricing options include single-user, multi-user, and enterprise licenses priced at USD 4750, USD 5250, and USD 8750 respectively.
10. Is the market size provided in terms of value or volume?
The market size is provided in terms of value, measured in Million.
11. Are there any specific market keywords associated with the report?
Yes, the market keyword associated with the report is "LNG Regasification Terminals Industry," which aids in identifying and referencing the specific market segment covered.
12. How do I determine which pricing option suits my needs best?
The pricing options vary based on user requirements and access needs. Individual users may opt for single-user licenses, while businesses requiring broader access may choose multi-user or enterprise licenses for cost-effective access to the report.
13. Are there any additional resources or data provided in the LNG Regasification Terminals Industry report?
While the report offers comprehensive insights, it's advisable to review the specific contents or supplementary materials provided to ascertain if additional resources or data are available.
14. How can I stay updated on further developments or reports in the LNG Regasification Terminals Industry?
To stay informed about further developments, trends, and reports in the LNG Regasification Terminals Industry, consider subscribing to industry newsletters, following relevant companies and organizations, or regularly checking reputable industry news sources and publications.
Methodology
Step 1 - Identification of Relevant Samples Size from Population Database


Step 2 - Approaches for Defining Global Market Size (Value, Volume* & Price*)

Note*: In applicable scenarios
Step 3 - Data Sources
Primary Research
- Web Analytics
- Survey Reports
- Research Institute
- Latest Research Reports
- Opinion Leaders
Secondary Research
- Annual Reports
- White Paper
- Latest Press Release
- Industry Association
- Paid Database
- Investor Presentations

Step 4 - Data Triangulation
Involves using different sources of information in order to increase the validity of a study
These sources are likely to be stakeholders in a program - participants, other researchers, program staff, other community members, and so on.
Then we put all data in single framework & apply various statistical tools to find out the dynamic on the market.
During the analysis stage, feedback from the stakeholder groups would be compared to determine areas of agreement as well as areas of divergence
