

Key Insights
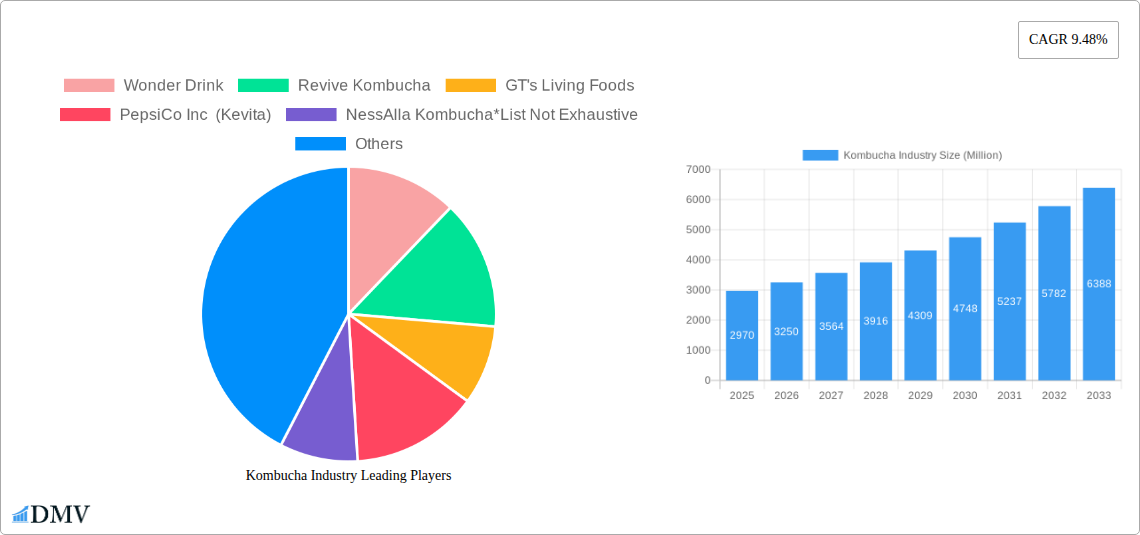
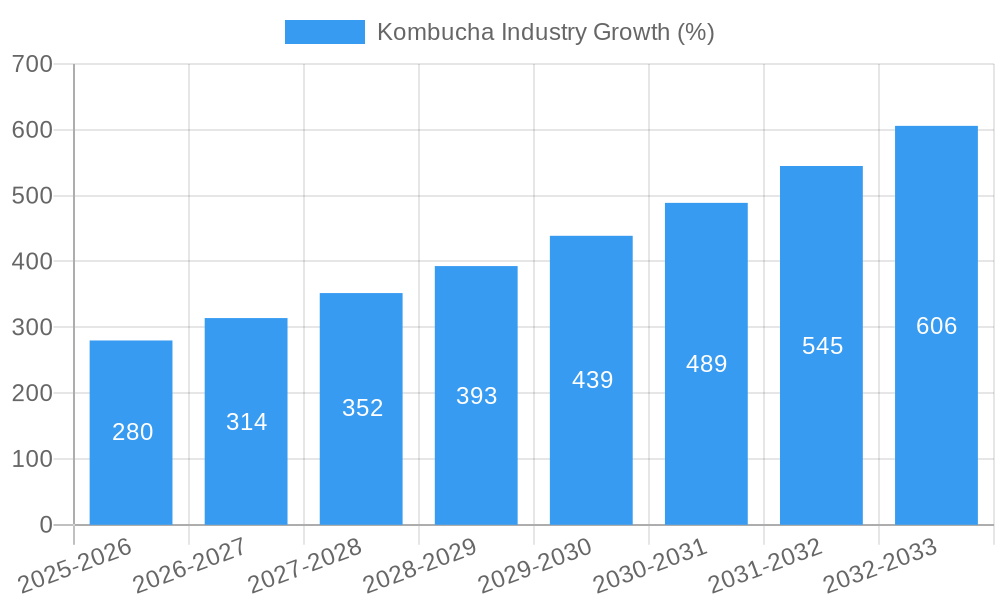
The global kombucha market, valued at $2.97 billion in 2025, is poised for robust growth, exhibiting a Compound Annual Growth Rate (CAGR) of 9.48% from 2025 to 2033. This expansion is fueled by several key factors. Increasing consumer awareness of health and wellness, coupled with the rising popularity of functional beverages, significantly contributes to kombucha's appeal. Consumers are actively seeking alternatives to sugary sodas and energy drinks, and kombucha, with its probiotic benefits and naturally-occurring antioxidants, fits this demand perfectly. The market's segmentation, encompassing various flavors and distribution channels, further facilitates its growth. The availability of kombucha in supermarkets, specialist health food stores, convenience stores, and online retailers broadens its accessibility, catering to diverse consumer preferences and purchasing habits. Furthermore, innovative product development, including unique flavor profiles and convenient packaging options, keeps the market dynamic and appealing to a wider audience. The increasing presence of kombucha brands in both mainstream and specialty retail channels demonstrates its growing market penetration.
However, certain challenges remain. While the health benefits are a major driver, some consumers may be deterred by the slightly acidic taste or the potential for a higher price point compared to conventional beverages. Competition from other functional beverages and the need to maintain consistent quality and production standards across varied distribution channels present ongoing challenges. Nonetheless, the overall market trajectory is positive, indicating significant growth potential driven by the rising demand for healthier, functional beverages and the continued innovation within the kombucha industry. Strategic marketing initiatives that emphasize health benefits and cater to diverse taste preferences will be crucial for success within this competitive yet rapidly evolving market.
This comprehensive report provides a detailed analysis of the Kombucha industry, projecting a market valuation of $XX Million by 2033. The study covers the period from 2019 to 2033, with a base year of 2025 and a forecast period from 2025 to 2033. It offers invaluable insights into market trends, competitive dynamics, and future growth opportunities for stakeholders across the entire value chain. This report is essential for businesses seeking to understand the evolving landscape of the Kombucha market and make informed strategic decisions.
Kombucha Industry Market Composition & Trends
This section analyzes the market concentration, innovation drivers, regulatory environment, substitute products, consumer profiles, and M&A activities within the Kombucha industry. The global Kombucha market is estimated at $XX Million in 2025, exhibiting a moderately fragmented structure. Key players like Wonder Drink, Revive Kombucha, GT's Living Foods, PepsiCo Inc (Kevita), NessAlla Kombucha, Brew Dr Kombucha, Makana Beverages Inc, Hain Celestial, Humm Kombucha LLC, and Health-Ade hold significant market shares, but smaller players are also contributing to market growth.
- Market Share Distribution (2025): Wonder Drink (XX%), GT's Living Foods (XX%), PepsiCo (Kevita) (XX%), Health-Ade (XX%), Others (XX%). These figures are estimates based on available data.
- M&A Activity: The industry has witnessed several mergers and acquisitions in recent years, with deal values totaling $XX Million between 2019 and 2024. These transactions reflect the increasing consolidation within the sector and the strategic expansion plans of major players.
- Innovation Catalysts: Consumer demand for healthier beverages and the functional benefits of Kombucha are driving innovation in flavors, ingredients, and packaging. Technological advancements in fermentation processes are also contributing to enhanced product quality and efficiency.
- Regulatory Landscape: Regulations concerning labeling, ingredients, and production processes vary across different geographies, influencing market dynamics.
- Substitute Products: Other functional beverages, such as fermented teas, fruit juices, and sparkling water, compete with Kombucha.
Kombucha Industry Evolution
This section details the evolution of the Kombucha industry, including its growth trajectory, technological advancements, and changing consumer preferences. The market experienced substantial growth during the historical period (2019-2024), driven by factors like increasing health consciousness, growing demand for functional beverages, and expanding distribution channels. The annual growth rate (CAGR) during this period is estimated to be XX%.
The forecast period (2025-2033) is projected to witness continued expansion, though perhaps at a slightly moderated pace, driven by ongoing innovation in product offerings, a rise in online sales channels, and further market penetration in developing regions. The CAGR for 2025-2033 is projected at XX%. Technological advancements in fermentation techniques, packaging, and preservation are streamlining production and enhancing product quality, furthering market growth. Shifting consumer demands towards healthier, natural, and convenient beverages have positively impacted Kombucha sales.
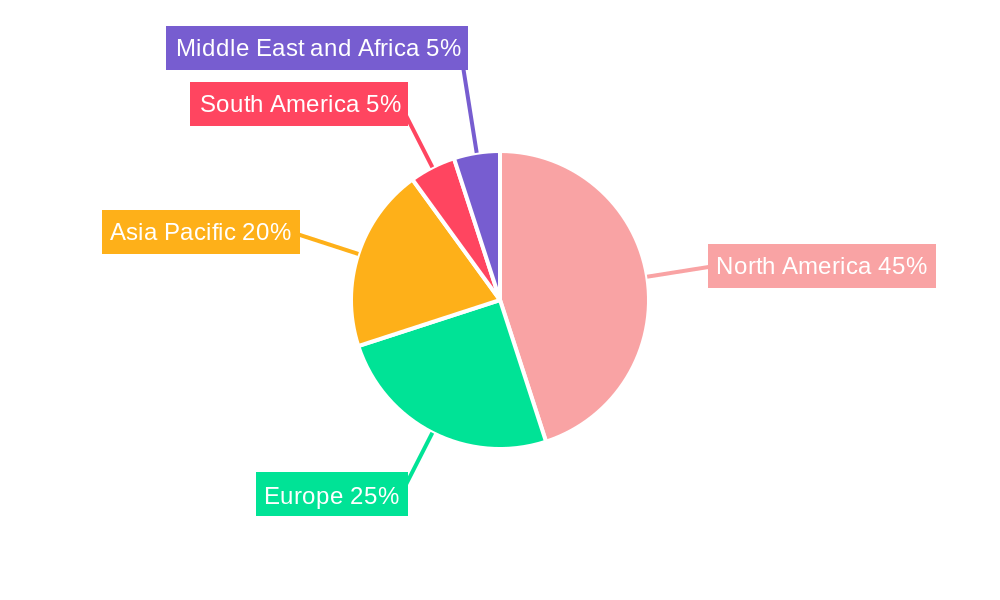
Leading Regions, Countries, or Segments in Kombucha Industry
This section highlights the leading regions, countries, and segments within the Kombucha industry.
By Type: The Flavored segment currently dominates the market, accounting for approximately XX% of total sales in 2025, fueled by the wide variety of taste profiles offered. This contrasts with the Original/Regular segment which makes up XX%. This dominance is expected to continue throughout the forecast period.
By Distribution Channel: Supermarkets/Hypermarkets remain the primary distribution channel in 2025, holding XX% of the market share due to their extensive reach and established consumer base. However, online retailers are showing significant growth, reaching XX% market share, driven by the rising preference for e-commerce and home delivery. Specialist stores contribute another XX%, while Convenience Stores take up XX% and Other Distribution Channels represent XX%.
Key Drivers:
- Investment Trends: Significant private equity and venture capital investments have fueled industry growth and expansion.
- Regulatory Support: Favorable regulations in certain regions have stimulated market development.
- Consumer Preferences: The growing preference for functional beverages, natural ingredients, and convenient options has driven market expansion.
Kombucha Industry Product Innovations
Recent years have witnessed notable innovations in the Kombucha industry, encompassing new flavors, functional ingredients, and enhanced packaging formats. The introduction of "instant Kombucha" formulas offers consumers convenience while Health-Ade’s Kombucha-based cocktail mixers expand product application beyond traditional consumption. These innovations cater to evolving consumer preferences, broadening the appeal of Kombucha and opening new market segments. Companies continuously explore unique selling propositions like using organic ingredients, unique flavor combinations, and sustainable packaging materials.
Propelling Factors for Kombucha Industry Growth
Several factors are driving the growth of the Kombucha industry. Increasing consumer awareness of the health benefits associated with probiotics and fermented foods fuels demand. The growing popularity of functional beverages aligns perfectly with Kombucha's inherent health properties. Furthermore, technological advancements in production methods and packaging are improving efficiency and product quality, driving market expansion.
Obstacles in the Kombucha Industry Market
Despite its growth potential, the Kombucha industry faces certain challenges. The relatively short shelf life of Kombucha can lead to supply chain disruptions and increase costs. Intense competition from established beverage brands and other functional beverages creates a challenging market environment. Regulatory variations across different regions pose hurdles for manufacturers operating across multiple markets.
Future Opportunities in Kombucha Industry
The Kombucha industry presents several promising opportunities. Expanding into new geographical markets with high growth potential offers significant avenues for expansion. Developing innovative products like low-sugar variants, enhanced functional properties (gut health support), or novel flavors caters to diverse consumer preferences. Strategic collaborations and partnerships can accelerate growth and enhance market penetration.
Major Players in the Kombucha Industry Ecosystem
- Wonder Drink
- Revive Kombucha
- GT's Living Foods [Insert Link if Available]
- PepsiCo Inc (Kevita) [Insert Link if Available]
- NessAlla Kombucha
- Brew Dr Kombucha
- Makana Beverages Inc
- Hain Celestial [Insert Link if Available]
- Humm Kombucha LLC
- Health-Ade [Insert Link if Available]
Key Developments in Kombucha Industry
- February 2022: Brew Dr. Kombucha launched "Just Peachy," their first peach-flavored kombucha.
- February 2022: Superfoods Company introduced an "instant Kombucha" formula.
- March 2021: Health-Ade Kombucha expanded its product line with Health-Ade Mixers.
Strategic Kombucha Industry Market Forecast
The Kombucha market is poised for sustained growth, driven by increasing consumer awareness of its health benefits and continuous product innovation. The forecast period (2025-2033) promises substantial expansion, with opportunities for both established and emerging players. This dynamic market warrants strategic positioning, innovation, and effective marketing to capitalize on its growth potential.
Kombucha Industry Segmentation
-
1. Type
- 1.1. Original/Regular
- 1.2. Flavored
-
2. Distribution Channel
- 2.1. Supermarkets/Hypermarkets
- 2.2. Specialist Stores
- 2.3. Convenience Stores
- 2.4. Online Retailers
- 2.5. Other Distribution Channel
Kombucha Industry Segmentation By Geography
-
1. North America
- 1.1. United States
- 1.2. Canada
- 1.3. Mexico
- 1.4. Rest of North America
-
2. Europe
- 2.1. Spain
- 2.2. United Kingdom
- 2.3. Germany
- 2.4. France
- 2.5. Italy
- 2.6. Russia
- 2.7. Rest of Europe
-
3. Asia Pacific
- 3.1. China
- 3.2. Japan
- 3.3. India
- 3.4. Australia
- 3.5. Rest of Asia Pacific
-
4. South America
- 4.1. Brazil
- 4.2. Argentina
- 4.3. Rest of South America
-
5. Middle East and Africa
- 5.1. South Africa
- 5.2. Saudi Arabia
- 5.3. Rest of Middle East and Africa
Kombucha Industry REPORT HIGHLIGHTS
| Aspects | Details |
|---|---|
| Study Period | 2019-2033 |
| Base Year | 2024 |
| Estimated Year | 2025 |
| Forecast Period | 2025-2033 |
| Historical Period | 2019-2024 |
| Growth Rate | CAGR of 9.48% from 2019-2033 |
| Segmentation |
|
Table of Contents
- 1. Introduction
- 1.1. Research Scope
- 1.2. Market Segmentation
- 1.3. Research Methodology
- 1.4. Definitions and Assumptions
- 2. Executive Summary
- 2.1. Introduction
- 3. Market Dynamics
- 3.1. Introduction
- 3.2. Market Drivers
- 3.2.1. Increasing application of Gelatin in healthcare and pharmaceutical sector
- 3.3. Market Restrains
- 3.3.1. Rising demand for clean label products
- 3.4. Market Trends
- 3.4.1. Rising Health Awareness Among Consumers
- 4. Market Factor Analysis
- 4.1. Porters Five Forces
- 4.2. Supply/Value Chain
- 4.3. PESTEL analysis
- 4.4. Market Entropy
- 4.5. Patent/Trademark Analysis
- 5. Global Kombucha Industry Analysis, Insights and Forecast, 2019-2031
- 5.1. Market Analysis, Insights and Forecast - by Type
- 5.1.1. Original/Regular
- 5.1.2. Flavored
- 5.2. Market Analysis, Insights and Forecast - by Distribution Channel
- 5.2.1. Supermarkets/Hypermarkets
- 5.2.2. Specialist Stores
- 5.2.3. Convenience Stores
- 5.2.4. Online Retailers
- 5.2.5. Other Distribution Channel
- 5.3. Market Analysis, Insights and Forecast - by Region
- 5.3.1. North America
- 5.3.2. Europe
- 5.3.3. Asia Pacific
- 5.3.4. South America
- 5.3.5. Middle East and Africa
- 5.1. Market Analysis, Insights and Forecast - by Type
- 6. North America Kombucha Industry Analysis, Insights and Forecast, 2019-2031
- 6.1. Market Analysis, Insights and Forecast - by Type
- 6.1.1. Original/Regular
- 6.1.2. Flavored
- 6.2. Market Analysis, Insights and Forecast - by Distribution Channel
- 6.2.1. Supermarkets/Hypermarkets
- 6.2.2. Specialist Stores
- 6.2.3. Convenience Stores
- 6.2.4. Online Retailers
- 6.2.5. Other Distribution Channel
- 6.1. Market Analysis, Insights and Forecast - by Type
- 7. Europe Kombucha Industry Analysis, Insights and Forecast, 2019-2031
- 7.1. Market Analysis, Insights and Forecast - by Type
- 7.1.1. Original/Regular
- 7.1.2. Flavored
- 7.2. Market Analysis, Insights and Forecast - by Distribution Channel
- 7.2.1. Supermarkets/Hypermarkets
- 7.2.2. Specialist Stores
- 7.2.3. Convenience Stores
- 7.2.4. Online Retailers
- 7.2.5. Other Distribution Channel
- 7.1. Market Analysis, Insights and Forecast - by Type
- 8. Asia Pacific Kombucha Industry Analysis, Insights and Forecast, 2019-2031
- 8.1. Market Analysis, Insights and Forecast - by Type
- 8.1.1. Original/Regular
- 8.1.2. Flavored
- 8.2. Market Analysis, Insights and Forecast - by Distribution Channel
- 8.2.1. Supermarkets/Hypermarkets
- 8.2.2. Specialist Stores
- 8.2.3. Convenience Stores
- 8.2.4. Online Retailers
- 8.2.5. Other Distribution Channel
- 8.1. Market Analysis, Insights and Forecast - by Type
- 9. South America Kombucha Industry Analysis, Insights and Forecast, 2019-2031
- 9.1. Market Analysis, Insights and Forecast - by Type
- 9.1.1. Original/Regular
- 9.1.2. Flavored
- 9.2. Market Analysis, Insights and Forecast - by Distribution Channel
- 9.2.1. Supermarkets/Hypermarkets
- 9.2.2. Specialist Stores
- 9.2.3. Convenience Stores
- 9.2.4. Online Retailers
- 9.2.5. Other Distribution Channel
- 9.1. Market Analysis, Insights and Forecast - by Type
- 10. Middle East and Africa Kombucha Industry Analysis, Insights and Forecast, 2019-2031
- 10.1. Market Analysis, Insights and Forecast - by Type
- 10.1.1. Original/Regular
- 10.1.2. Flavored
- 10.2. Market Analysis, Insights and Forecast - by Distribution Channel
- 10.2.1. Supermarkets/Hypermarkets
- 10.2.2. Specialist Stores
- 10.2.3. Convenience Stores
- 10.2.4. Online Retailers
- 10.2.5. Other Distribution Channel
- 10.1. Market Analysis, Insights and Forecast - by Type
- 11. North America Kombucha Industry Analysis, Insights and Forecast, 2019-2031
- 11.1. Market Analysis, Insights and Forecast - By Country/Sub-region
- 11.1.1 United States
- 11.1.2 Canada
- 11.1.3 Mexico
- 11.1.4 Rest of North America
- 12. Europe Kombucha Industry Analysis, Insights and Forecast, 2019-2031
- 12.1. Market Analysis, Insights and Forecast - By Country/Sub-region
- 12.1.1 Spain
- 12.1.2 United Kingdom
- 12.1.3 Germany
- 12.1.4 France
- 12.1.5 Italy
- 12.1.6 Russia
- 12.1.7 Rest of Europe
- 13. Asia Pacific Kombucha Industry Analysis, Insights and Forecast, 2019-2031
- 13.1. Market Analysis, Insights and Forecast - By Country/Sub-region
- 13.1.1 China
- 13.1.2 Japan
- 13.1.3 India
- 13.1.4 Australia
- 13.1.5 Rest of Asia Pacific
- 14. South America Kombucha Industry Analysis, Insights and Forecast, 2019-2031
- 14.1. Market Analysis, Insights and Forecast - By Country/Sub-region
- 14.1.1 Brazil
- 14.1.2 Argentina
- 14.1.3 Rest of South America
- 15. Middle East and Africa Kombucha Industry Analysis, Insights and Forecast, 2019-2031
- 15.1. Market Analysis, Insights and Forecast - By Country/Sub-region
- 15.1.1 South Africa
- 15.1.2 Saudi Arabia
- 15.1.3 Rest of Middle East and Africa
- 16. Competitive Analysis
- 16.1. Global Market Share Analysis 2024
- 16.2. Company Profiles
- 16.2.1 Wonder Drink
- 16.2.1.1. Overview
- 16.2.1.2. Products
- 16.2.1.3. SWOT Analysis
- 16.2.1.4. Recent Developments
- 16.2.1.5. Financials (Based on Availability)
- 16.2.2 Revive Kombucha
- 16.2.2.1. Overview
- 16.2.2.2. Products
- 16.2.2.3. SWOT Analysis
- 16.2.2.4. Recent Developments
- 16.2.2.5. Financials (Based on Availability)
- 16.2.3 GT's Living Foods
- 16.2.3.1. Overview
- 16.2.3.2. Products
- 16.2.3.3. SWOT Analysis
- 16.2.3.4. Recent Developments
- 16.2.3.5. Financials (Based on Availability)
- 16.2.4 PepsiCo Inc (Kevita)
- 16.2.4.1. Overview
- 16.2.4.2. Products
- 16.2.4.3. SWOT Analysis
- 16.2.4.4. Recent Developments
- 16.2.4.5. Financials (Based on Availability)
- 16.2.5 NessAlla Kombucha*List Not Exhaustive
- 16.2.5.1. Overview
- 16.2.5.2. Products
- 16.2.5.3. SWOT Analysis
- 16.2.5.4. Recent Developments
- 16.2.5.5. Financials (Based on Availability)
- 16.2.6 Brew Dr Kombucha
- 16.2.6.1. Overview
- 16.2.6.2. Products
- 16.2.6.3. SWOT Analysis
- 16.2.6.4. Recent Developments
- 16.2.6.5. Financials (Based on Availability)
- 16.2.7 Makana Beverages Inc
- 16.2.7.1. Overview
- 16.2.7.2. Products
- 16.2.7.3. SWOT Analysis
- 16.2.7.4. Recent Developments
- 16.2.7.5. Financials (Based on Availability)
- 16.2.8 Hain Celestial
- 16.2.8.1. Overview
- 16.2.8.2. Products
- 16.2.8.3. SWOT Analysis
- 16.2.8.4. Recent Developments
- 16.2.8.5. Financials (Based on Availability)
- 16.2.9 Humm Kombucha LLC
- 16.2.9.1. Overview
- 16.2.9.2. Products
- 16.2.9.3. SWOT Analysis
- 16.2.9.4. Recent Developments
- 16.2.9.5. Financials (Based on Availability)
- 16.2.10 Health-Ade
- 16.2.10.1. Overview
- 16.2.10.2. Products
- 16.2.10.3. SWOT Analysis
- 16.2.10.4. Recent Developments
- 16.2.10.5. Financials (Based on Availability)
- 16.2.1 Wonder Drink
List of Figures
- Figure 1: Global Kombucha Industry Revenue Breakdown (Million, %) by Region 2024 & 2032
- Figure 2: North America Kombucha Industry Revenue (Million), by Country 2024 & 2032
- Figure 3: North America Kombucha Industry Revenue Share (%), by Country 2024 & 2032
- Figure 4: Europe Kombucha Industry Revenue (Million), by Country 2024 & 2032
- Figure 5: Europe Kombucha Industry Revenue Share (%), by Country 2024 & 2032
- Figure 6: Asia Pacific Kombucha Industry Revenue (Million), by Country 2024 & 2032
- Figure 7: Asia Pacific Kombucha Industry Revenue Share (%), by Country 2024 & 2032
- Figure 8: South America Kombucha Industry Revenue (Million), by Country 2024 & 2032
- Figure 9: South America Kombucha Industry Revenue Share (%), by Country 2024 & 2032
- Figure 10: Middle East and Africa Kombucha Industry Revenue (Million), by Country 2024 & 2032
- Figure 11: Middle East and Africa Kombucha Industry Revenue Share (%), by Country 2024 & 2032
- Figure 12: North America Kombucha Industry Revenue (Million), by Type 2024 & 2032
- Figure 13: North America Kombucha Industry Revenue Share (%), by Type 2024 & 2032
- Figure 14: North America Kombucha Industry Revenue (Million), by Distribution Channel 2024 & 2032
- Figure 15: North America Kombucha Industry Revenue Share (%), by Distribution Channel 2024 & 2032
- Figure 16: North America Kombucha Industry Revenue (Million), by Country 2024 & 2032
- Figure 17: North America Kombucha Industry Revenue Share (%), by Country 2024 & 2032
- Figure 18: Europe Kombucha Industry Revenue (Million), by Type 2024 & 2032
- Figure 19: Europe Kombucha Industry Revenue Share (%), by Type 2024 & 2032
- Figure 20: Europe Kombucha Industry Revenue (Million), by Distribution Channel 2024 & 2032
- Figure 21: Europe Kombucha Industry Revenue Share (%), by Distribution Channel 2024 & 2032
- Figure 22: Europe Kombucha Industry Revenue (Million), by Country 2024 & 2032
- Figure 23: Europe Kombucha Industry Revenue Share (%), by Country 2024 & 2032
- Figure 24: Asia Pacific Kombucha Industry Revenue (Million), by Type 2024 & 2032
- Figure 25: Asia Pacific Kombucha Industry Revenue Share (%), by Type 2024 & 2032
- Figure 26: Asia Pacific Kombucha Industry Revenue (Million), by Distribution Channel 2024 & 2032
- Figure 27: Asia Pacific Kombucha Industry Revenue Share (%), by Distribution Channel 2024 & 2032
- Figure 28: Asia Pacific Kombucha Industry Revenue (Million), by Country 2024 & 2032
- Figure 29: Asia Pacific Kombucha Industry Revenue Share (%), by Country 2024 & 2032
- Figure 30: South America Kombucha Industry Revenue (Million), by Type 2024 & 2032
- Figure 31: South America Kombucha Industry Revenue Share (%), by Type 2024 & 2032
- Figure 32: South America Kombucha Industry Revenue (Million), by Distribution Channel 2024 & 2032
- Figure 33: South America Kombucha Industry Revenue Share (%), by Distribution Channel 2024 & 2032
- Figure 34: South America Kombucha Industry Revenue (Million), by Country 2024 & 2032
- Figure 35: South America Kombucha Industry Revenue Share (%), by Country 2024 & 2032
- Figure 36: Middle East and Africa Kombucha Industry Revenue (Million), by Type 2024 & 2032
- Figure 37: Middle East and Africa Kombucha Industry Revenue Share (%), by Type 2024 & 2032
- Figure 38: Middle East and Africa Kombucha Industry Revenue (Million), by Distribution Channel 2024 & 2032
- Figure 39: Middle East and Africa Kombucha Industry Revenue Share (%), by Distribution Channel 2024 & 2032
- Figure 40: Middle East and Africa Kombucha Industry Revenue (Million), by Country 2024 & 2032
- Figure 41: Middle East and Africa Kombucha Industry Revenue Share (%), by Country 2024 & 2032
List of Tables
- Table 1: Global Kombucha Industry Revenue Million Forecast, by Region 2019 & 2032
- Table 2: Global Kombucha Industry Revenue Million Forecast, by Type 2019 & 2032
- Table 3: Global Kombucha Industry Revenue Million Forecast, by Distribution Channel 2019 & 2032
- Table 4: Global Kombucha Industry Revenue Million Forecast, by Region 2019 & 2032
- Table 5: Global Kombucha Industry Revenue Million Forecast, by Country 2019 & 2032
- Table 6: United States Kombucha Industry Revenue (Million) Forecast, by Application 2019 & 2032
- Table 7: Canada Kombucha Industry Revenue (Million) Forecast, by Application 2019 & 2032
- Table 8: Mexico Kombucha Industry Revenue (Million) Forecast, by Application 2019 & 2032
- Table 9: Rest of North America Kombucha Industry Revenue (Million) Forecast, by Application 2019 & 2032
- Table 10: Global Kombucha Industry Revenue Million Forecast, by Country 2019 & 2032
- Table 11: Spain Kombucha Industry Revenue (Million) Forecast, by Application 2019 & 2032
- Table 12: United Kingdom Kombucha Industry Revenue (Million) Forecast, by Application 2019 & 2032
- Table 13: Germany Kombucha Industry Revenue (Million) Forecast, by Application 2019 & 2032
- Table 14: France Kombucha Industry Revenue (Million) Forecast, by Application 2019 & 2032
- Table 15: Italy Kombucha Industry Revenue (Million) Forecast, by Application 2019 & 2032
- Table 16: Russia Kombucha Industry Revenue (Million) Forecast, by Application 2019 & 2032
- Table 17: Rest of Europe Kombucha Industry Revenue (Million) Forecast, by Application 2019 & 2032
- Table 18: Global Kombucha Industry Revenue Million Forecast, by Country 2019 & 2032
- Table 19: China Kombucha Industry Revenue (Million) Forecast, by Application 2019 & 2032
- Table 20: Japan Kombucha Industry Revenue (Million) Forecast, by Application 2019 & 2032
- Table 21: India Kombucha Industry Revenue (Million) Forecast, by Application 2019 & 2032
- Table 22: Australia Kombucha Industry Revenue (Million) Forecast, by Application 2019 & 2032
- Table 23: Rest of Asia Pacific Kombucha Industry Revenue (Million) Forecast, by Application 2019 & 2032
- Table 24: Global Kombucha Industry Revenue Million Forecast, by Country 2019 & 2032
- Table 25: Brazil Kombucha Industry Revenue (Million) Forecast, by Application 2019 & 2032
- Table 26: Argentina Kombucha Industry Revenue (Million) Forecast, by Application 2019 & 2032
- Table 27: Rest of South America Kombucha Industry Revenue (Million) Forecast, by Application 2019 & 2032
- Table 28: Global Kombucha Industry Revenue Million Forecast, by Country 2019 & 2032
- Table 29: South Africa Kombucha Industry Revenue (Million) Forecast, by Application 2019 & 2032
- Table 30: Saudi Arabia Kombucha Industry Revenue (Million) Forecast, by Application 2019 & 2032
- Table 31: Rest of Middle East and Africa Kombucha Industry Revenue (Million) Forecast, by Application 2019 & 2032
- Table 32: Global Kombucha Industry Revenue Million Forecast, by Type 2019 & 2032
- Table 33: Global Kombucha Industry Revenue Million Forecast, by Distribution Channel 2019 & 2032
- Table 34: Global Kombucha Industry Revenue Million Forecast, by Country 2019 & 2032
- Table 35: United States Kombucha Industry Revenue (Million) Forecast, by Application 2019 & 2032
- Table 36: Canada Kombucha Industry Revenue (Million) Forecast, by Application 2019 & 2032
- Table 37: Mexico Kombucha Industry Revenue (Million) Forecast, by Application 2019 & 2032
- Table 38: Rest of North America Kombucha Industry Revenue (Million) Forecast, by Application 2019 & 2032
- Table 39: Global Kombucha Industry Revenue Million Forecast, by Type 2019 & 2032
- Table 40: Global Kombucha Industry Revenue Million Forecast, by Distribution Channel 2019 & 2032
- Table 41: Global Kombucha Industry Revenue Million Forecast, by Country 2019 & 2032
- Table 42: Spain Kombucha Industry Revenue (Million) Forecast, by Application 2019 & 2032
- Table 43: United Kingdom Kombucha Industry Revenue (Million) Forecast, by Application 2019 & 2032
- Table 44: Germany Kombucha Industry Revenue (Million) Forecast, by Application 2019 & 2032
- Table 45: France Kombucha Industry Revenue (Million) Forecast, by Application 2019 & 2032
- Table 46: Italy Kombucha Industry Revenue (Million) Forecast, by Application 2019 & 2032
- Table 47: Russia Kombucha Industry Revenue (Million) Forecast, by Application 2019 & 2032
- Table 48: Rest of Europe Kombucha Industry Revenue (Million) Forecast, by Application 2019 & 2032
- Table 49: Global Kombucha Industry Revenue Million Forecast, by Type 2019 & 2032
- Table 50: Global Kombucha Industry Revenue Million Forecast, by Distribution Channel 2019 & 2032
- Table 51: Global Kombucha Industry Revenue Million Forecast, by Country 2019 & 2032
- Table 52: China Kombucha Industry Revenue (Million) Forecast, by Application 2019 & 2032
- Table 53: Japan Kombucha Industry Revenue (Million) Forecast, by Application 2019 & 2032
- Table 54: India Kombucha Industry Revenue (Million) Forecast, by Application 2019 & 2032
- Table 55: Australia Kombucha Industry Revenue (Million) Forecast, by Application 2019 & 2032
- Table 56: Rest of Asia Pacific Kombucha Industry Revenue (Million) Forecast, by Application 2019 & 2032
- Table 57: Global Kombucha Industry Revenue Million Forecast, by Type 2019 & 2032
- Table 58: Global Kombucha Industry Revenue Million Forecast, by Distribution Channel 2019 & 2032
- Table 59: Global Kombucha Industry Revenue Million Forecast, by Country 2019 & 2032
- Table 60: Brazil Kombucha Industry Revenue (Million) Forecast, by Application 2019 & 2032
- Table 61: Argentina Kombucha Industry Revenue (Million) Forecast, by Application 2019 & 2032
- Table 62: Rest of South America Kombucha Industry Revenue (Million) Forecast, by Application 2019 & 2032
- Table 63: Global Kombucha Industry Revenue Million Forecast, by Type 2019 & 2032
- Table 64: Global Kombucha Industry Revenue Million Forecast, by Distribution Channel 2019 & 2032
- Table 65: Global Kombucha Industry Revenue Million Forecast, by Country 2019 & 2032
- Table 66: South Africa Kombucha Industry Revenue (Million) Forecast, by Application 2019 & 2032
- Table 67: Saudi Arabia Kombucha Industry Revenue (Million) Forecast, by Application 2019 & 2032
- Table 68: Rest of Middle East and Africa Kombucha Industry Revenue (Million) Forecast, by Application 2019 & 2032
Frequently Asked Questions
1. What is the projected Compound Annual Growth Rate (CAGR) of the Kombucha Industry?
The projected CAGR is approximately 9.48%.
2. Which companies are prominent players in the Kombucha Industry?
Key companies in the market include Wonder Drink, Revive Kombucha, GT's Living Foods, PepsiCo Inc (Kevita), NessAlla Kombucha*List Not Exhaustive, Brew Dr Kombucha, Makana Beverages Inc, Hain Celestial, Humm Kombucha LLC, Health-Ade.
3. What are the main segments of the Kombucha Industry?
The market segments include Type, Distribution Channel.
4. Can you provide details about the market size?
The market size is estimated to be USD 2.97 Million as of 2022.
5. What are some drivers contributing to market growth?
Increasing application of Gelatin in healthcare and pharmaceutical sector.
6. What are the notable trends driving market growth?
Rising Health Awareness Among Consumers.
7. Are there any restraints impacting market growth?
Rising demand for clean label products.
8. Can you provide examples of recent developments in the market?
February 2022: Brew Dr. launched their first-ever peach-flavored kombucha, Just Peachy. It is made with high-quality loose-leaf green tea and then blends in five varieties of organic peaches. The result is a delicious balance of sweet, ripe, and tart flavors, with hints of honey and summer flowers.
9. What pricing options are available for accessing the report?
Pricing options include single-user, multi-user, and enterprise licenses priced at USD 4750, USD 5250, and USD 8750 respectively.
10. Is the market size provided in terms of value or volume?
The market size is provided in terms of value, measured in Million.
11. Are there any specific market keywords associated with the report?
Yes, the market keyword associated with the report is "Kombucha Industry," which aids in identifying and referencing the specific market segment covered.
12. How do I determine which pricing option suits my needs best?
The pricing options vary based on user requirements and access needs. Individual users may opt for single-user licenses, while businesses requiring broader access may choose multi-user or enterprise licenses for cost-effective access to the report.
13. Are there any additional resources or data provided in the Kombucha Industry report?
While the report offers comprehensive insights, it's advisable to review the specific contents or supplementary materials provided to ascertain if additional resources or data are available.
14. How can I stay updated on further developments or reports in the Kombucha Industry?
To stay informed about further developments, trends, and reports in the Kombucha Industry, consider subscribing to industry newsletters, following relevant companies and organizations, or regularly checking reputable industry news sources and publications.
Methodology
Step 1 - Identification of Relevant Samples Size from Population Database


Step 2 - Approaches for Defining Global Market Size (Value, Volume* & Price*)

Note*: In applicable scenarios
Step 3 - Data Sources
Primary Research
- Web Analytics
- Survey Reports
- Research Institute
- Latest Research Reports
- Opinion Leaders
Secondary Research
- Annual Reports
- White Paper
- Latest Press Release
- Industry Association
- Paid Database
- Investor Presentations

Step 4 - Data Triangulation
Involves using different sources of information in order to increase the validity of a study
These sources are likely to be stakeholders in a program - participants, other researchers, program staff, other community members, and so on.
Then we put all data in single framework & apply various statistical tools to find out the dynamic on the market.
During the analysis stage, feedback from the stakeholder groups would be compared to determine areas of agreement as well as areas of divergence
