

Key Insights
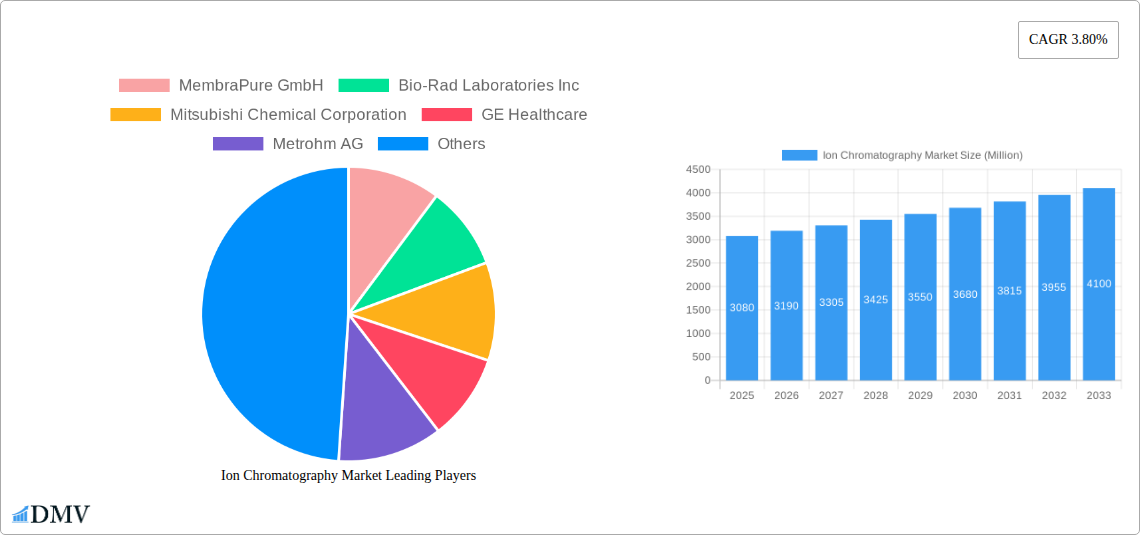
The ion chromatography (IC) market, valued at $3.08 billion in 2025, is projected to experience robust growth, driven by increasing demand across diverse sectors. The pharmaceutical industry's stringent quality control measures and the growing need for precise analyses of impurities and contaminants significantly fuel market expansion. Environmental testing agencies are increasingly relying on IC for accurate detection of pollutants in water and soil samples, further contributing to market growth. The food and beverage industry utilizes IC for quality control and safety assessments, particularly for detecting harmful ions and contaminants. Technological advancements, such as the development of miniaturized and automated IC systems, enhance efficiency and reduce operational costs, making IC more accessible and attractive to a wider range of users. Furthermore, the rising prevalence of chronic diseases globally is indirectly bolstering the demand for advanced analytical techniques in pharmaceutical research and development. The expanding chemicals industry, with its focus on precise composition analysis, also provides a substantial market opportunity. While regulatory hurdles and the relatively high cost of sophisticated IC systems may present some challenges, the overall market outlook remains positive, driven by the aforementioned factors.
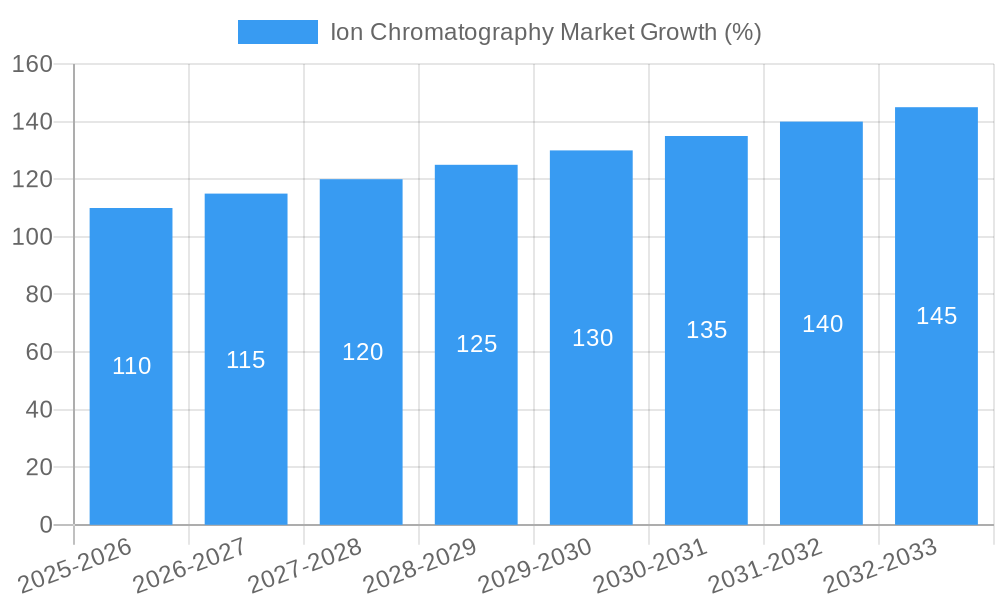
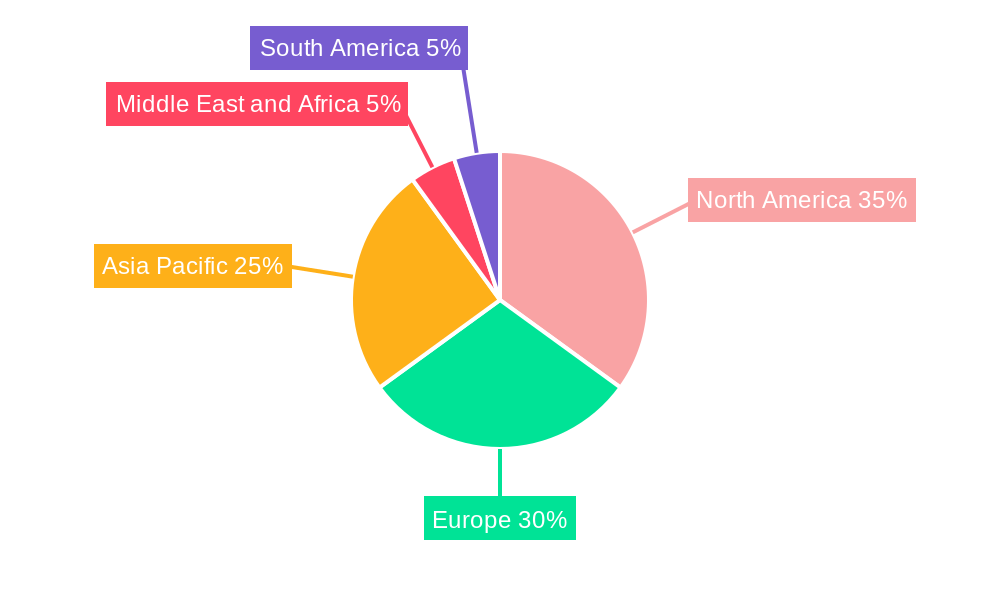
A 3.80% CAGR suggests a steady and predictable market expansion throughout the forecast period (2025-2033). Regional variations are expected, with North America and Europe maintaining significant market shares due to established regulatory frameworks and robust research infrastructure. However, rapidly developing economies in Asia-Pacific, particularly China and India, are anticipated to exhibit faster-than-average growth rates due to increasing industrialization and investment in analytical capabilities. The competitive landscape is characterized by established players like Thermo Fisher Scientific, Agilent Technologies, and Waters, alongside emerging regional players. Competition is primarily driven by innovation, particularly in terms of enhanced sensitivity, selectivity, and automation in IC systems. The continued focus on developing environmentally friendly and cost-effective IC technologies is crucial to further market penetration and sustainability.
Ion Chromatography Market: A Comprehensive Report (2019-2033)
This insightful report provides a detailed analysis of the Ion Chromatography Market, encompassing historical data (2019-2024), the current state (2025), and a comprehensive forecast (2025-2033). It delves into market segmentation, competitive landscapes, technological advancements, and future growth prospects, offering invaluable insights for stakeholders seeking to navigate this dynamic industry. The global Ion Chromatography market is estimated to reach xx Million by 2033, exhibiting a CAGR of xx% during the forecast period.
Ion Chromatography Market Composition & Trends
The Ion Chromatography market is characterized by moderate concentration, with key players holding significant market share, but also presenting opportunities for smaller, specialized companies to thrive. Innovation is driven by the need for higher sensitivity, faster analysis times, and miniaturization. Stringent environmental regulations across various geographies are a major catalyst, particularly in environmental testing and pharmaceutical applications. Substitute techniques exist, such as capillary electrophoresis, but ion chromatography maintains its advantage in specific applications due to its superior selectivity and sensitivity. End-users span diverse sectors, including environmental testing labs, pharmaceutical companies, food and beverage manufacturers, and chemical producers. M&A activities have been relatively frequent, with deal values averaging xx Million per transaction over the past five years, driving consolidation and expansion into new markets.
- Market Share Distribution (2024):
- Top 5 players: xx%
- Remaining players: xx%
- Average M&A Deal Value (2019-2024): xx Million
- Key M&A Activities: (Specific examples of mergers and acquisitions with deal values, if available)
Ion Chromatography Market Industry Evolution
The Ion Chromatography market has experienced consistent growth over the past five years, fueled by increasing demand for accurate and efficient analytical techniques across various industries. Technological advancements, particularly in miniaturization, automation, and improved detector technology, have significantly enhanced the speed, sensitivity, and ease of use of IC systems. Consumer demand is shifting towards higher throughput, reduced operational costs, and environmentally friendly solutions. The market has witnessed a substantial increase in the adoption of advanced ion chromatography techniques, especially in high-growth sectors like pharmaceutical quality control and environmental monitoring. This growth trajectory is expected to continue, driven by stricter regulations and the increasing need for comprehensive quality control and environmental monitoring.
- Market Growth Rate (2019-2024): xx% CAGR
- Adoption Rate of Advanced IC Techniques (2024): xx%
Leading Regions, Countries, or Segments in Ion Chromatography Market
The North American region currently holds the largest share of the Ion Chromatography market, driven by robust regulatory frameworks, a significant concentration of pharmaceutical and biotechnology companies, and considerable investments in environmental monitoring. Within this region, the United States is the leading country. The pharmaceutical industry is the most significant end-user segment globally, owing to its stringent quality control requirements. In terms of technology, Ion-exchange chromatography dominates the market due to its versatility and effectiveness in separating a wide range of ions.
- Key Drivers in North America:
- Stringent environmental regulations (e.g., Clean Water Act)
- Large pharmaceutical and biotechnology industry
- High investment in R&D and advanced analytical techniques
- Key Drivers in Pharmaceutical Industry:
- Stringent quality control requirements in drug manufacturing
- Growing demand for high-throughput analysis
- Need for accurate and reliable quantification of impurities
Ion Chromatography Market Product Innovations
Recent innovations in Ion Chromatography include the development of high-efficiency columns, advanced detectors (e.g., mass spectrometry coupled with IC), and integrated software for automated data analysis. These improvements enhance analytical performance, reduce analysis time, and improve overall efficiency. Miniaturized systems are gaining traction, offering portability and reduced reagent consumption. Unique selling propositions focus on increased sensitivity, speed, and ease of use, enabling broader adoption across diverse industries.
Propelling Factors for Ion Chromatography Market Growth
Several factors are driving the growth of the Ion Chromatography market. Stringent environmental regulations necessitate advanced analytical techniques for water and soil analysis. The increasing demand for high-quality pharmaceuticals necessitates precise impurity detection. Advances in detector technologies, such as mass spectrometry coupling, are significantly enhancing the capabilities of Ion Chromatography. Technological advancements, such as automation and miniaturization, are leading to increased efficiency and cost-effectiveness.
Obstacles in the Ion Chromatography Market
The Ion Chromatography market faces several challenges. The high cost of advanced instruments can limit adoption, especially in resource-constrained settings. Supply chain disruptions impacting the availability of key components can affect production and delivery. Intense competition among established players and emerging technologies can put downward pressure on prices.
Future Opportunities in Ion Chromatography Market
Future opportunities lie in the development of novel stationary phases, improved detector technologies, and applications in emerging fields such as metabolomics and proteomics. Expansion into developing markets, driven by increasing regulatory compliance and industrial growth, presents significant growth potential. The integration of artificial intelligence (AI) and machine learning (ML) into IC systems can enable automation and enhanced data analysis.
Major Players in the Ion Chromatography Market Ecosystem
- MembraPure GmbH
- Bio-Rad Laboratories Inc
- Mitsubishi Chemical Corporation
- GE Healthcare
- Metrohm AG
- Waters
- Tosoh Corporation
- Agilent Technologies Inc
- Qingdao Shenghan
- Thermo Fisher Scientific
- Shimadzu Corporation
- Perkin Elmer Inc
Key Developments in Ion Chromatography Market Industry
- June 2022: Bio-Rad launched EconoFit Chromatography Column packs, offering various resins in a prepacked format.
- May 2022: Thermo Fisher launched quat pesticide determination and quantitation workflows for food safety.
Strategic Ion Chromatography Market Forecast
The Ion Chromatography market is poised for continued growth, driven by technological advancements, expanding applications, and increasing regulatory pressures. The market's future will be shaped by innovations in miniaturization, automation, and detector sensitivity, creating opportunities for both established players and new entrants. The focus on sustainable and environmentally friendly solutions will further contribute to the market's expansion in the coming years.
Ion Chromatography Market Segmentation
-
1. Technology
- 1.1. Ion-exchange Chromatography
- 1.2. Ion-exclusion Chromatography
- 1.3. Ion-pair Chromatography
-
2. Application
- 2.1. Environmental Testing
- 2.2. Pharmaceutical Industry
- 2.3. Food Industry
- 2.4. Chemicals Industry
- 2.5. Other Applications
Ion Chromatography Market Segmentation By Geography
-
1. North America
- 1.1. United States
- 1.2. Canada
- 1.3. Mexico
-
2. Europe
- 2.1. Germany
- 2.2. United Kingdom
- 2.3. France
- 2.4. Italy
- 2.5. Spain
- 2.6. Rest of Europe
-
3. Asia Pacific
- 3.1. China
- 3.2. Japan
- 3.3. India
- 3.4. Australia
- 3.5. South korea
- 3.6. Rest of Asia Pacific
-
4. Middle East and Africa
- 4.1. GCC
- 4.2. South Africa
- 4.3. Rest of Middle East and Africa
-
5. South America
- 5.1. Brazil
- 5.2. Argentina
- 5.3. Rest of South America
Ion Chromatography Market REPORT HIGHLIGHTS
| Aspects | Details |
|---|---|
| Study Period | 2019-2033 |
| Base Year | 2024 |
| Estimated Year | 2025 |
| Forecast Period | 2025-2033 |
| Historical Period | 2019-2024 |
| Growth Rate | CAGR of 3.80% from 2019-2033 |
| Segmentation |
|
Table of Contents
- 1. Introduction
- 1.1. Research Scope
- 1.2. Market Segmentation
- 1.3. Research Methodology
- 1.4. Definitions and Assumptions
- 2. Executive Summary
- 2.1. Introduction
- 3. Market Dynamics
- 3.1. Introduction
- 3.2. Market Drivers
- 3.2.1. Increasing Academic and Commercial R&D Spending on Pharmaceuticals; Increasing Use of Ion Chromatography Technique in Various Fields; Technological Advancements in Ion Chromatography
- 3.3. Market Restrains
- 3.3.1. High Cost of Instruments; Lack of Skilled Personnel to Handle Equipment
- 3.4. Market Trends
- 3.4.1. Application in Pharmaceutical Industry is Expected to Exhibit Fastest Growth Over the Forecast Period
- 4. Market Factor Analysis
- 4.1. Porters Five Forces
- 4.2. Supply/Value Chain
- 4.3. PESTEL analysis
- 4.4. Market Entropy
- 4.5. Patent/Trademark Analysis
- 5. Global Ion Chromatography Market Analysis, Insights and Forecast, 2019-2031
- 5.1. Market Analysis, Insights and Forecast - by Technology
- 5.1.1. Ion-exchange Chromatography
- 5.1.2. Ion-exclusion Chromatography
- 5.1.3. Ion-pair Chromatography
- 5.2. Market Analysis, Insights and Forecast - by Application
- 5.2.1. Environmental Testing
- 5.2.2. Pharmaceutical Industry
- 5.2.3. Food Industry
- 5.2.4. Chemicals Industry
- 5.2.5. Other Applications
- 5.3. Market Analysis, Insights and Forecast - by Region
- 5.3.1. North America
- 5.3.2. Europe
- 5.3.3. Asia Pacific
- 5.3.4. Middle East and Africa
- 5.3.5. South America
- 5.1. Market Analysis, Insights and Forecast - by Technology
- 6. North America Ion Chromatography Market Analysis, Insights and Forecast, 2019-2031
- 6.1. Market Analysis, Insights and Forecast - by Technology
- 6.1.1. Ion-exchange Chromatography
- 6.1.2. Ion-exclusion Chromatography
- 6.1.3. Ion-pair Chromatography
- 6.2. Market Analysis, Insights and Forecast - by Application
- 6.2.1. Environmental Testing
- 6.2.2. Pharmaceutical Industry
- 6.2.3. Food Industry
- 6.2.4. Chemicals Industry
- 6.2.5. Other Applications
- 6.1. Market Analysis, Insights and Forecast - by Technology
- 7. Europe Ion Chromatography Market Analysis, Insights and Forecast, 2019-2031
- 7.1. Market Analysis, Insights and Forecast - by Technology
- 7.1.1. Ion-exchange Chromatography
- 7.1.2. Ion-exclusion Chromatography
- 7.1.3. Ion-pair Chromatography
- 7.2. Market Analysis, Insights and Forecast - by Application
- 7.2.1. Environmental Testing
- 7.2.2. Pharmaceutical Industry
- 7.2.3. Food Industry
- 7.2.4. Chemicals Industry
- 7.2.5. Other Applications
- 7.1. Market Analysis, Insights and Forecast - by Technology
- 8. Asia Pacific Ion Chromatography Market Analysis, Insights and Forecast, 2019-2031
- 8.1. Market Analysis, Insights and Forecast - by Technology
- 8.1.1. Ion-exchange Chromatography
- 8.1.2. Ion-exclusion Chromatography
- 8.1.3. Ion-pair Chromatography
- 8.2. Market Analysis, Insights and Forecast - by Application
- 8.2.1. Environmental Testing
- 8.2.2. Pharmaceutical Industry
- 8.2.3. Food Industry
- 8.2.4. Chemicals Industry
- 8.2.5. Other Applications
- 8.1. Market Analysis, Insights and Forecast - by Technology
- 9. Middle East and Africa Ion Chromatography Market Analysis, Insights and Forecast, 2019-2031
- 9.1. Market Analysis, Insights and Forecast - by Technology
- 9.1.1. Ion-exchange Chromatography
- 9.1.2. Ion-exclusion Chromatography
- 9.1.3. Ion-pair Chromatography
- 9.2. Market Analysis, Insights and Forecast - by Application
- 9.2.1. Environmental Testing
- 9.2.2. Pharmaceutical Industry
- 9.2.3. Food Industry
- 9.2.4. Chemicals Industry
- 9.2.5. Other Applications
- 9.1. Market Analysis, Insights and Forecast - by Technology
- 10. South America Ion Chromatography Market Analysis, Insights and Forecast, 2019-2031
- 10.1. Market Analysis, Insights and Forecast - by Technology
- 10.1.1. Ion-exchange Chromatography
- 10.1.2. Ion-exclusion Chromatography
- 10.1.3. Ion-pair Chromatography
- 10.2. Market Analysis, Insights and Forecast - by Application
- 10.2.1. Environmental Testing
- 10.2.2. Pharmaceutical Industry
- 10.2.3. Food Industry
- 10.2.4. Chemicals Industry
- 10.2.5. Other Applications
- 10.1. Market Analysis, Insights and Forecast - by Technology
- 11. North America Ion Chromatography Market Analysis, Insights and Forecast, 2019-2031
- 11.1. Market Analysis, Insights and Forecast - By Country/Sub-region
- 11.1.1 United States
- 11.1.2 Canada
- 11.1.3 Mexico
- 12. Europe Ion Chromatography Market Analysis, Insights and Forecast, 2019-2031
- 12.1. Market Analysis, Insights and Forecast - By Country/Sub-region
- 12.1.1 Germany
- 12.1.2 United Kingdom
- 12.1.3 France
- 12.1.4 Italy
- 12.1.5 Spain
- 12.1.6 Rest of Europe
- 13. Asia Pacific Ion Chromatography Market Analysis, Insights and Forecast, 2019-2031
- 13.1. Market Analysis, Insights and Forecast - By Country/Sub-region
- 13.1.1 China
- 13.1.2 Japan
- 13.1.3 India
- 13.1.4 Australia
- 13.1.5 South korea
- 13.1.6 Rest of Asia Pacific
- 14. Middle East and Africa Ion Chromatography Market Analysis, Insights and Forecast, 2019-2031
- 14.1. Market Analysis, Insights and Forecast - By Country/Sub-region
- 14.1.1 GCC
- 14.1.2 South Africa
- 14.1.3 Rest of Middle East and Africa
- 15. South America Ion Chromatography Market Analysis, Insights and Forecast, 2019-2031
- 15.1. Market Analysis, Insights and Forecast - By Country/Sub-region
- 15.1.1 Brazil
- 15.1.2 Argentina
- 15.1.3 Rest of South America
- 16. Competitive Analysis
- 16.1. Global Market Share Analysis 2024
- 16.2. Company Profiles
- 16.2.1 MembraPure GmbH
- 16.2.1.1. Overview
- 16.2.1.2. Products
- 16.2.1.3. SWOT Analysis
- 16.2.1.4. Recent Developments
- 16.2.1.5. Financials (Based on Availability)
- 16.2.2 Bio-Rad Laboratories Inc
- 16.2.2.1. Overview
- 16.2.2.2. Products
- 16.2.2.3. SWOT Analysis
- 16.2.2.4. Recent Developments
- 16.2.2.5. Financials (Based on Availability)
- 16.2.3 Mitsubishi Chemical Corporation
- 16.2.3.1. Overview
- 16.2.3.2. Products
- 16.2.3.3. SWOT Analysis
- 16.2.3.4. Recent Developments
- 16.2.3.5. Financials (Based on Availability)
- 16.2.4 GE Healthcare
- 16.2.4.1. Overview
- 16.2.4.2. Products
- 16.2.4.3. SWOT Analysis
- 16.2.4.4. Recent Developments
- 16.2.4.5. Financials (Based on Availability)
- 16.2.5 Metrohm AG
- 16.2.5.1. Overview
- 16.2.5.2. Products
- 16.2.5.3. SWOT Analysis
- 16.2.5.4. Recent Developments
- 16.2.5.5. Financials (Based on Availability)
- 16.2.6 Waters
- 16.2.6.1. Overview
- 16.2.6.2. Products
- 16.2.6.3. SWOT Analysis
- 16.2.6.4. Recent Developments
- 16.2.6.5. Financials (Based on Availability)
- 16.2.7 Tosoh Corporation
- 16.2.7.1. Overview
- 16.2.7.2. Products
- 16.2.7.3. SWOT Analysis
- 16.2.7.4. Recent Developments
- 16.2.7.5. Financials (Based on Availability)
- 16.2.8 Agilent Technologies Inc
- 16.2.8.1. Overview
- 16.2.8.2. Products
- 16.2.8.3. SWOT Analysis
- 16.2.8.4. Recent Developments
- 16.2.8.5. Financials (Based on Availability)
- 16.2.9 Qingdao Shenghan
- 16.2.9.1. Overview
- 16.2.9.2. Products
- 16.2.9.3. SWOT Analysis
- 16.2.9.4. Recent Developments
- 16.2.9.5. Financials (Based on Availability)
- 16.2.10 Thermo Fisher Scientific
- 16.2.10.1. Overview
- 16.2.10.2. Products
- 16.2.10.3. SWOT Analysis
- 16.2.10.4. Recent Developments
- 16.2.10.5. Financials (Based on Availability)
- 16.2.11 Shimadzu Corporation
- 16.2.11.1. Overview
- 16.2.11.2. Products
- 16.2.11.3. SWOT Analysis
- 16.2.11.4. Recent Developments
- 16.2.11.5. Financials (Based on Availability)
- 16.2.12 Perkin Elmer Inc
- 16.2.12.1. Overview
- 16.2.12.2. Products
- 16.2.12.3. SWOT Analysis
- 16.2.12.4. Recent Developments
- 16.2.12.5. Financials (Based on Availability)
- 16.2.1 MembraPure GmbH
List of Figures
- Figure 1: Global Ion Chromatography Market Revenue Breakdown (Million, %) by Region 2024 & 2032
- Figure 2: Global Ion Chromatography Market Volume Breakdown (K Unit, %) by Region 2024 & 2032
- Figure 3: North America Ion Chromatography Market Revenue (Million), by Country 2024 & 2032
- Figure 4: North America Ion Chromatography Market Volume (K Unit), by Country 2024 & 2032
- Figure 5: North America Ion Chromatography Market Revenue Share (%), by Country 2024 & 2032
- Figure 6: North America Ion Chromatography Market Volume Share (%), by Country 2024 & 2032
- Figure 7: Europe Ion Chromatography Market Revenue (Million), by Country 2024 & 2032
- Figure 8: Europe Ion Chromatography Market Volume (K Unit), by Country 2024 & 2032
- Figure 9: Europe Ion Chromatography Market Revenue Share (%), by Country 2024 & 2032
- Figure 10: Europe Ion Chromatography Market Volume Share (%), by Country 2024 & 2032
- Figure 11: Asia Pacific Ion Chromatography Market Revenue (Million), by Country 2024 & 2032
- Figure 12: Asia Pacific Ion Chromatography Market Volume (K Unit), by Country 2024 & 2032
- Figure 13: Asia Pacific Ion Chromatography Market Revenue Share (%), by Country 2024 & 2032
- Figure 14: Asia Pacific Ion Chromatography Market Volume Share (%), by Country 2024 & 2032
- Figure 15: Middle East and Africa Ion Chromatography Market Revenue (Million), by Country 2024 & 2032
- Figure 16: Middle East and Africa Ion Chromatography Market Volume (K Unit), by Country 2024 & 2032
- Figure 17: Middle East and Africa Ion Chromatography Market Revenue Share (%), by Country 2024 & 2032
- Figure 18: Middle East and Africa Ion Chromatography Market Volume Share (%), by Country 2024 & 2032
- Figure 19: South America Ion Chromatography Market Revenue (Million), by Country 2024 & 2032
- Figure 20: South America Ion Chromatography Market Volume (K Unit), by Country 2024 & 2032
- Figure 21: South America Ion Chromatography Market Revenue Share (%), by Country 2024 & 2032
- Figure 22: South America Ion Chromatography Market Volume Share (%), by Country 2024 & 2032
- Figure 23: North America Ion Chromatography Market Revenue (Million), by Technology 2024 & 2032
- Figure 24: North America Ion Chromatography Market Volume (K Unit), by Technology 2024 & 2032
- Figure 25: North America Ion Chromatography Market Revenue Share (%), by Technology 2024 & 2032
- Figure 26: North America Ion Chromatography Market Volume Share (%), by Technology 2024 & 2032
- Figure 27: North America Ion Chromatography Market Revenue (Million), by Application 2024 & 2032
- Figure 28: North America Ion Chromatography Market Volume (K Unit), by Application 2024 & 2032
- Figure 29: North America Ion Chromatography Market Revenue Share (%), by Application 2024 & 2032
- Figure 30: North America Ion Chromatography Market Volume Share (%), by Application 2024 & 2032
- Figure 31: North America Ion Chromatography Market Revenue (Million), by Country 2024 & 2032
- Figure 32: North America Ion Chromatography Market Volume (K Unit), by Country 2024 & 2032
- Figure 33: North America Ion Chromatography Market Revenue Share (%), by Country 2024 & 2032
- Figure 34: North America Ion Chromatography Market Volume Share (%), by Country 2024 & 2032
- Figure 35: Europe Ion Chromatography Market Revenue (Million), by Technology 2024 & 2032
- Figure 36: Europe Ion Chromatography Market Volume (K Unit), by Technology 2024 & 2032
- Figure 37: Europe Ion Chromatography Market Revenue Share (%), by Technology 2024 & 2032
- Figure 38: Europe Ion Chromatography Market Volume Share (%), by Technology 2024 & 2032
- Figure 39: Europe Ion Chromatography Market Revenue (Million), by Application 2024 & 2032
- Figure 40: Europe Ion Chromatography Market Volume (K Unit), by Application 2024 & 2032
- Figure 41: Europe Ion Chromatography Market Revenue Share (%), by Application 2024 & 2032
- Figure 42: Europe Ion Chromatography Market Volume Share (%), by Application 2024 & 2032
- Figure 43: Europe Ion Chromatography Market Revenue (Million), by Country 2024 & 2032
- Figure 44: Europe Ion Chromatography Market Volume (K Unit), by Country 2024 & 2032
- Figure 45: Europe Ion Chromatography Market Revenue Share (%), by Country 2024 & 2032
- Figure 46: Europe Ion Chromatography Market Volume Share (%), by Country 2024 & 2032
- Figure 47: Asia Pacific Ion Chromatography Market Revenue (Million), by Technology 2024 & 2032
- Figure 48: Asia Pacific Ion Chromatography Market Volume (K Unit), by Technology 2024 & 2032
- Figure 49: Asia Pacific Ion Chromatography Market Revenue Share (%), by Technology 2024 & 2032
- Figure 50: Asia Pacific Ion Chromatography Market Volume Share (%), by Technology 2024 & 2032
- Figure 51: Asia Pacific Ion Chromatography Market Revenue (Million), by Application 2024 & 2032
- Figure 52: Asia Pacific Ion Chromatography Market Volume (K Unit), by Application 2024 & 2032
- Figure 53: Asia Pacific Ion Chromatography Market Revenue Share (%), by Application 2024 & 2032
- Figure 54: Asia Pacific Ion Chromatography Market Volume Share (%), by Application 2024 & 2032
- Figure 55: Asia Pacific Ion Chromatography Market Revenue (Million), by Country 2024 & 2032
- Figure 56: Asia Pacific Ion Chromatography Market Volume (K Unit), by Country 2024 & 2032
- Figure 57: Asia Pacific Ion Chromatography Market Revenue Share (%), by Country 2024 & 2032
- Figure 58: Asia Pacific Ion Chromatography Market Volume Share (%), by Country 2024 & 2032
- Figure 59: Middle East and Africa Ion Chromatography Market Revenue (Million), by Technology 2024 & 2032
- Figure 60: Middle East and Africa Ion Chromatography Market Volume (K Unit), by Technology 2024 & 2032
- Figure 61: Middle East and Africa Ion Chromatography Market Revenue Share (%), by Technology 2024 & 2032
- Figure 62: Middle East and Africa Ion Chromatography Market Volume Share (%), by Technology 2024 & 2032
- Figure 63: Middle East and Africa Ion Chromatography Market Revenue (Million), by Application 2024 & 2032
- Figure 64: Middle East and Africa Ion Chromatography Market Volume (K Unit), by Application 2024 & 2032
- Figure 65: Middle East and Africa Ion Chromatography Market Revenue Share (%), by Application 2024 & 2032
- Figure 66: Middle East and Africa Ion Chromatography Market Volume Share (%), by Application 2024 & 2032
- Figure 67: Middle East and Africa Ion Chromatography Market Revenue (Million), by Country 2024 & 2032
- Figure 68: Middle East and Africa Ion Chromatography Market Volume (K Unit), by Country 2024 & 2032
- Figure 69: Middle East and Africa Ion Chromatography Market Revenue Share (%), by Country 2024 & 2032
- Figure 70: Middle East and Africa Ion Chromatography Market Volume Share (%), by Country 2024 & 2032
- Figure 71: South America Ion Chromatography Market Revenue (Million), by Technology 2024 & 2032
- Figure 72: South America Ion Chromatography Market Volume (K Unit), by Technology 2024 & 2032
- Figure 73: South America Ion Chromatography Market Revenue Share (%), by Technology 2024 & 2032
- Figure 74: South America Ion Chromatography Market Volume Share (%), by Technology 2024 & 2032
- Figure 75: South America Ion Chromatography Market Revenue (Million), by Application 2024 & 2032
- Figure 76: South America Ion Chromatography Market Volume (K Unit), by Application 2024 & 2032
- Figure 77: South America Ion Chromatography Market Revenue Share (%), by Application 2024 & 2032
- Figure 78: South America Ion Chromatography Market Volume Share (%), by Application 2024 & 2032
- Figure 79: South America Ion Chromatography Market Revenue (Million), by Country 2024 & 2032
- Figure 80: South America Ion Chromatography Market Volume (K Unit), by Country 2024 & 2032
- Figure 81: South America Ion Chromatography Market Revenue Share (%), by Country 2024 & 2032
- Figure 82: South America Ion Chromatography Market Volume Share (%), by Country 2024 & 2032
List of Tables
- Table 1: Global Ion Chromatography Market Revenue Million Forecast, by Region 2019 & 2032
- Table 2: Global Ion Chromatography Market Volume K Unit Forecast, by Region 2019 & 2032
- Table 3: Global Ion Chromatography Market Revenue Million Forecast, by Technology 2019 & 2032
- Table 4: Global Ion Chromatography Market Volume K Unit Forecast, by Technology 2019 & 2032
- Table 5: Global Ion Chromatography Market Revenue Million Forecast, by Application 2019 & 2032
- Table 6: Global Ion Chromatography Market Volume K Unit Forecast, by Application 2019 & 2032
- Table 7: Global Ion Chromatography Market Revenue Million Forecast, by Region 2019 & 2032
- Table 8: Global Ion Chromatography Market Volume K Unit Forecast, by Region 2019 & 2032
- Table 9: Global Ion Chromatography Market Revenue Million Forecast, by Country 2019 & 2032
- Table 10: Global Ion Chromatography Market Volume K Unit Forecast, by Country 2019 & 2032
- Table 11: United States Ion Chromatography Market Revenue (Million) Forecast, by Application 2019 & 2032
- Table 12: United States Ion Chromatography Market Volume (K Unit) Forecast, by Application 2019 & 2032
- Table 13: Canada Ion Chromatography Market Revenue (Million) Forecast, by Application 2019 & 2032
- Table 14: Canada Ion Chromatography Market Volume (K Unit) Forecast, by Application 2019 & 2032
- Table 15: Mexico Ion Chromatography Market Revenue (Million) Forecast, by Application 2019 & 2032
- Table 16: Mexico Ion Chromatography Market Volume (K Unit) Forecast, by Application 2019 & 2032
- Table 17: Global Ion Chromatography Market Revenue Million Forecast, by Country 2019 & 2032
- Table 18: Global Ion Chromatography Market Volume K Unit Forecast, by Country 2019 & 2032
- Table 19: Germany Ion Chromatography Market Revenue (Million) Forecast, by Application 2019 & 2032
- Table 20: Germany Ion Chromatography Market Volume (K Unit) Forecast, by Application 2019 & 2032
- Table 21: United Kingdom Ion Chromatography Market Revenue (Million) Forecast, by Application 2019 & 2032
- Table 22: United Kingdom Ion Chromatography Market Volume (K Unit) Forecast, by Application 2019 & 2032
- Table 23: France Ion Chromatography Market Revenue (Million) Forecast, by Application 2019 & 2032
- Table 24: France Ion Chromatography Market Volume (K Unit) Forecast, by Application 2019 & 2032
- Table 25: Italy Ion Chromatography Market Revenue (Million) Forecast, by Application 2019 & 2032
- Table 26: Italy Ion Chromatography Market Volume (K Unit) Forecast, by Application 2019 & 2032
- Table 27: Spain Ion Chromatography Market Revenue (Million) Forecast, by Application 2019 & 2032
- Table 28: Spain Ion Chromatography Market Volume (K Unit) Forecast, by Application 2019 & 2032
- Table 29: Rest of Europe Ion Chromatography Market Revenue (Million) Forecast, by Application 2019 & 2032
- Table 30: Rest of Europe Ion Chromatography Market Volume (K Unit) Forecast, by Application 2019 & 2032
- Table 31: Global Ion Chromatography Market Revenue Million Forecast, by Country 2019 & 2032
- Table 32: Global Ion Chromatography Market Volume K Unit Forecast, by Country 2019 & 2032
- Table 33: China Ion Chromatography Market Revenue (Million) Forecast, by Application 2019 & 2032
- Table 34: China Ion Chromatography Market Volume (K Unit) Forecast, by Application 2019 & 2032
- Table 35: Japan Ion Chromatography Market Revenue (Million) Forecast, by Application 2019 & 2032
- Table 36: Japan Ion Chromatography Market Volume (K Unit) Forecast, by Application 2019 & 2032
- Table 37: India Ion Chromatography Market Revenue (Million) Forecast, by Application 2019 & 2032
- Table 38: India Ion Chromatography Market Volume (K Unit) Forecast, by Application 2019 & 2032
- Table 39: Australia Ion Chromatography Market Revenue (Million) Forecast, by Application 2019 & 2032
- Table 40: Australia Ion Chromatography Market Volume (K Unit) Forecast, by Application 2019 & 2032
- Table 41: South korea Ion Chromatography Market Revenue (Million) Forecast, by Application 2019 & 2032
- Table 42: South korea Ion Chromatography Market Volume (K Unit) Forecast, by Application 2019 & 2032
- Table 43: Rest of Asia Pacific Ion Chromatography Market Revenue (Million) Forecast, by Application 2019 & 2032
- Table 44: Rest of Asia Pacific Ion Chromatography Market Volume (K Unit) Forecast, by Application 2019 & 2032
- Table 45: Global Ion Chromatography Market Revenue Million Forecast, by Country 2019 & 2032
- Table 46: Global Ion Chromatography Market Volume K Unit Forecast, by Country 2019 & 2032
- Table 47: GCC Ion Chromatography Market Revenue (Million) Forecast, by Application 2019 & 2032
- Table 48: GCC Ion Chromatography Market Volume (K Unit) Forecast, by Application 2019 & 2032
- Table 49: South Africa Ion Chromatography Market Revenue (Million) Forecast, by Application 2019 & 2032
- Table 50: South Africa Ion Chromatography Market Volume (K Unit) Forecast, by Application 2019 & 2032
- Table 51: Rest of Middle East and Africa Ion Chromatography Market Revenue (Million) Forecast, by Application 2019 & 2032
- Table 52: Rest of Middle East and Africa Ion Chromatography Market Volume (K Unit) Forecast, by Application 2019 & 2032
- Table 53: Global Ion Chromatography Market Revenue Million Forecast, by Country 2019 & 2032
- Table 54: Global Ion Chromatography Market Volume K Unit Forecast, by Country 2019 & 2032
- Table 55: Brazil Ion Chromatography Market Revenue (Million) Forecast, by Application 2019 & 2032
- Table 56: Brazil Ion Chromatography Market Volume (K Unit) Forecast, by Application 2019 & 2032
- Table 57: Argentina Ion Chromatography Market Revenue (Million) Forecast, by Application 2019 & 2032
- Table 58: Argentina Ion Chromatography Market Volume (K Unit) Forecast, by Application 2019 & 2032
- Table 59: Rest of South America Ion Chromatography Market Revenue (Million) Forecast, by Application 2019 & 2032
- Table 60: Rest of South America Ion Chromatography Market Volume (K Unit) Forecast, by Application 2019 & 2032
- Table 61: Global Ion Chromatography Market Revenue Million Forecast, by Technology 2019 & 2032
- Table 62: Global Ion Chromatography Market Volume K Unit Forecast, by Technology 2019 & 2032
- Table 63: Global Ion Chromatography Market Revenue Million Forecast, by Application 2019 & 2032
- Table 64: Global Ion Chromatography Market Volume K Unit Forecast, by Application 2019 & 2032
- Table 65: Global Ion Chromatography Market Revenue Million Forecast, by Country 2019 & 2032
- Table 66: Global Ion Chromatography Market Volume K Unit Forecast, by Country 2019 & 2032
- Table 67: United States Ion Chromatography Market Revenue (Million) Forecast, by Application 2019 & 2032
- Table 68: United States Ion Chromatography Market Volume (K Unit) Forecast, by Application 2019 & 2032
- Table 69: Canada Ion Chromatography Market Revenue (Million) Forecast, by Application 2019 & 2032
- Table 70: Canada Ion Chromatography Market Volume (K Unit) Forecast, by Application 2019 & 2032
- Table 71: Mexico Ion Chromatography Market Revenue (Million) Forecast, by Application 2019 & 2032
- Table 72: Mexico Ion Chromatography Market Volume (K Unit) Forecast, by Application 2019 & 2032
- Table 73: Global Ion Chromatography Market Revenue Million Forecast, by Technology 2019 & 2032
- Table 74: Global Ion Chromatography Market Volume K Unit Forecast, by Technology 2019 & 2032
- Table 75: Global Ion Chromatography Market Revenue Million Forecast, by Application 2019 & 2032
- Table 76: Global Ion Chromatography Market Volume K Unit Forecast, by Application 2019 & 2032
- Table 77: Global Ion Chromatography Market Revenue Million Forecast, by Country 2019 & 2032
- Table 78: Global Ion Chromatography Market Volume K Unit Forecast, by Country 2019 & 2032
- Table 79: Germany Ion Chromatography Market Revenue (Million) Forecast, by Application 2019 & 2032
- Table 80: Germany Ion Chromatography Market Volume (K Unit) Forecast, by Application 2019 & 2032
- Table 81: United Kingdom Ion Chromatography Market Revenue (Million) Forecast, by Application 2019 & 2032
- Table 82: United Kingdom Ion Chromatography Market Volume (K Unit) Forecast, by Application 2019 & 2032
- Table 83: France Ion Chromatography Market Revenue (Million) Forecast, by Application 2019 & 2032
- Table 84: France Ion Chromatography Market Volume (K Unit) Forecast, by Application 2019 & 2032
- Table 85: Italy Ion Chromatography Market Revenue (Million) Forecast, by Application 2019 & 2032
- Table 86: Italy Ion Chromatography Market Volume (K Unit) Forecast, by Application 2019 & 2032
- Table 87: Spain Ion Chromatography Market Revenue (Million) Forecast, by Application 2019 & 2032
- Table 88: Spain Ion Chromatography Market Volume (K Unit) Forecast, by Application 2019 & 2032
- Table 89: Rest of Europe Ion Chromatography Market Revenue (Million) Forecast, by Application 2019 & 2032
- Table 90: Rest of Europe Ion Chromatography Market Volume (K Unit) Forecast, by Application 2019 & 2032
- Table 91: Global Ion Chromatography Market Revenue Million Forecast, by Technology 2019 & 2032
- Table 92: Global Ion Chromatography Market Volume K Unit Forecast, by Technology 2019 & 2032
- Table 93: Global Ion Chromatography Market Revenue Million Forecast, by Application 2019 & 2032
- Table 94: Global Ion Chromatography Market Volume K Unit Forecast, by Application 2019 & 2032
- Table 95: Global Ion Chromatography Market Revenue Million Forecast, by Country 2019 & 2032
- Table 96: Global Ion Chromatography Market Volume K Unit Forecast, by Country 2019 & 2032
- Table 97: China Ion Chromatography Market Revenue (Million) Forecast, by Application 2019 & 2032
- Table 98: China Ion Chromatography Market Volume (K Unit) Forecast, by Application 2019 & 2032
- Table 99: Japan Ion Chromatography Market Revenue (Million) Forecast, by Application 2019 & 2032
- Table 100: Japan Ion Chromatography Market Volume (K Unit) Forecast, by Application 2019 & 2032
- Table 101: India Ion Chromatography Market Revenue (Million) Forecast, by Application 2019 & 2032
- Table 102: India Ion Chromatography Market Volume (K Unit) Forecast, by Application 2019 & 2032
- Table 103: Australia Ion Chromatography Market Revenue (Million) Forecast, by Application 2019 & 2032
- Table 104: Australia Ion Chromatography Market Volume (K Unit) Forecast, by Application 2019 & 2032
- Table 105: South korea Ion Chromatography Market Revenue (Million) Forecast, by Application 2019 & 2032
- Table 106: South korea Ion Chromatography Market Volume (K Unit) Forecast, by Application 2019 & 2032
- Table 107: Rest of Asia Pacific Ion Chromatography Market Revenue (Million) Forecast, by Application 2019 & 2032
- Table 108: Rest of Asia Pacific Ion Chromatography Market Volume (K Unit) Forecast, by Application 2019 & 2032
- Table 109: Global Ion Chromatography Market Revenue Million Forecast, by Technology 2019 & 2032
- Table 110: Global Ion Chromatography Market Volume K Unit Forecast, by Technology 2019 & 2032
- Table 111: Global Ion Chromatography Market Revenue Million Forecast, by Application 2019 & 2032
- Table 112: Global Ion Chromatography Market Volume K Unit Forecast, by Application 2019 & 2032
- Table 113: Global Ion Chromatography Market Revenue Million Forecast, by Country 2019 & 2032
- Table 114: Global Ion Chromatography Market Volume K Unit Forecast, by Country 2019 & 2032
- Table 115: GCC Ion Chromatography Market Revenue (Million) Forecast, by Application 2019 & 2032
- Table 116: GCC Ion Chromatography Market Volume (K Unit) Forecast, by Application 2019 & 2032
- Table 117: South Africa Ion Chromatography Market Revenue (Million) Forecast, by Application 2019 & 2032
- Table 118: South Africa Ion Chromatography Market Volume (K Unit) Forecast, by Application 2019 & 2032
- Table 119: Rest of Middle East and Africa Ion Chromatography Market Revenue (Million) Forecast, by Application 2019 & 2032
- Table 120: Rest of Middle East and Africa Ion Chromatography Market Volume (K Unit) Forecast, by Application 2019 & 2032
- Table 121: Global Ion Chromatography Market Revenue Million Forecast, by Technology 2019 & 2032
- Table 122: Global Ion Chromatography Market Volume K Unit Forecast, by Technology 2019 & 2032
- Table 123: Global Ion Chromatography Market Revenue Million Forecast, by Application 2019 & 2032
- Table 124: Global Ion Chromatography Market Volume K Unit Forecast, by Application 2019 & 2032
- Table 125: Global Ion Chromatography Market Revenue Million Forecast, by Country 2019 & 2032
- Table 126: Global Ion Chromatography Market Volume K Unit Forecast, by Country 2019 & 2032
- Table 127: Brazil Ion Chromatography Market Revenue (Million) Forecast, by Application 2019 & 2032
- Table 128: Brazil Ion Chromatography Market Volume (K Unit) Forecast, by Application 2019 & 2032
- Table 129: Argentina Ion Chromatography Market Revenue (Million) Forecast, by Application 2019 & 2032
- Table 130: Argentina Ion Chromatography Market Volume (K Unit) Forecast, by Application 2019 & 2032
- Table 131: Rest of South America Ion Chromatography Market Revenue (Million) Forecast, by Application 2019 & 2032
- Table 132: Rest of South America Ion Chromatography Market Volume (K Unit) Forecast, by Application 2019 & 2032
Frequently Asked Questions
1. What is the projected Compound Annual Growth Rate (CAGR) of the Ion Chromatography Market?
The projected CAGR is approximately 3.80%.
2. Which companies are prominent players in the Ion Chromatography Market?
Key companies in the market include MembraPure GmbH, Bio-Rad Laboratories Inc, Mitsubishi Chemical Corporation, GE Healthcare, Metrohm AG, Waters, Tosoh Corporation, Agilent Technologies Inc, Qingdao Shenghan, Thermo Fisher Scientific, Shimadzu Corporation, Perkin Elmer Inc.
3. What are the main segments of the Ion Chromatography Market?
The market segments include Technology, Application.
4. Can you provide details about the market size?
The market size is estimated to be USD 3.08 Million as of 2022.
5. What are some drivers contributing to market growth?
Increasing Academic and Commercial R&D Spending on Pharmaceuticals; Increasing Use of Ion Chromatography Technique in Various Fields; Technological Advancements in Ion Chromatography.
6. What are the notable trends driving market growth?
Application in Pharmaceutical Industry is Expected to Exhibit Fastest Growth Over the Forecast Period.
7. Are there any restraints impacting market growth?
High Cost of Instruments; Lack of Skilled Personnel to Handle Equipment.
8. Can you provide examples of recent developments in the market?
In June 2022, Bio-Rad launched EconoFit Chromatography Column packs, that offer various resins in a prepacked format, including mixed-mode, cation, and anion exchange resin columns, as well as a pack designed for polyhistidine protein purification
9. What pricing options are available for accessing the report?
Pricing options include single-user, multi-user, and enterprise licenses priced at USD 4750, USD 5250, and USD 8750 respectively.
10. Is the market size provided in terms of value or volume?
The market size is provided in terms of value, measured in Million and volume, measured in K Unit.
11. Are there any specific market keywords associated with the report?
Yes, the market keyword associated with the report is "Ion Chromatography Market," which aids in identifying and referencing the specific market segment covered.
12. How do I determine which pricing option suits my needs best?
The pricing options vary based on user requirements and access needs. Individual users may opt for single-user licenses, while businesses requiring broader access may choose multi-user or enterprise licenses for cost-effective access to the report.
13. Are there any additional resources or data provided in the Ion Chromatography Market report?
While the report offers comprehensive insights, it's advisable to review the specific contents or supplementary materials provided to ascertain if additional resources or data are available.
14. How can I stay updated on further developments or reports in the Ion Chromatography Market?
To stay informed about further developments, trends, and reports in the Ion Chromatography Market, consider subscribing to industry newsletters, following relevant companies and organizations, or regularly checking reputable industry news sources and publications.
Methodology
Step 1 - Identification of Relevant Samples Size from Population Database


Step 2 - Approaches for Defining Global Market Size (Value, Volume* & Price*)

Note*: In applicable scenarios
Step 3 - Data Sources
Primary Research
- Web Analytics
- Survey Reports
- Research Institute
- Latest Research Reports
- Opinion Leaders
Secondary Research
- Annual Reports
- White Paper
- Latest Press Release
- Industry Association
- Paid Database
- Investor Presentations

Step 4 - Data Triangulation
Involves using different sources of information in order to increase the validity of a study
These sources are likely to be stakeholders in a program - participants, other researchers, program staff, other community members, and so on.
Then we put all data in single framework & apply various statistical tools to find out the dynamic on the market.
During the analysis stage, feedback from the stakeholder groups would be compared to determine areas of agreement as well as areas of divergence
