

Key Insights
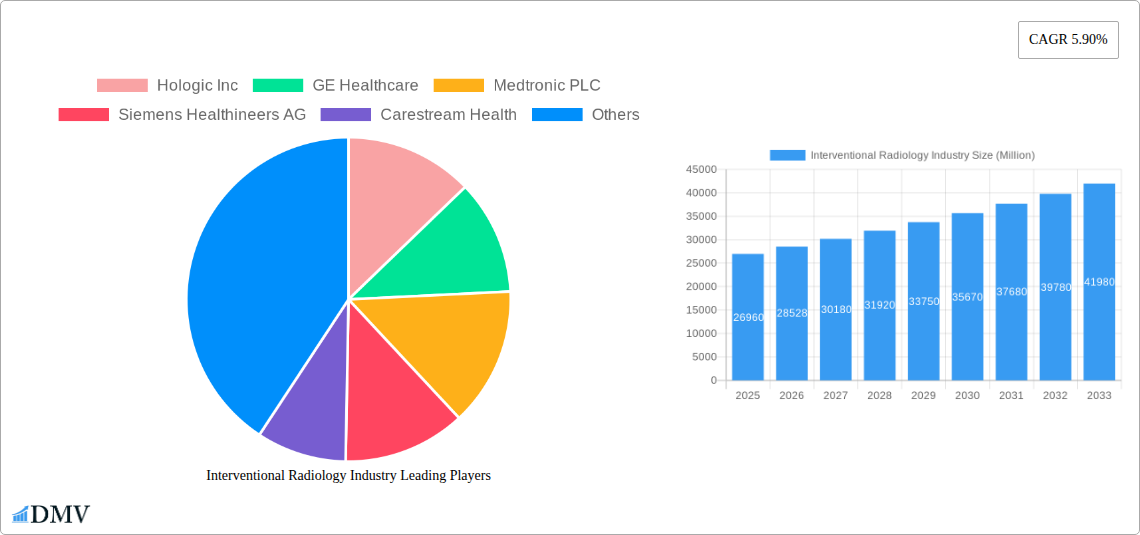
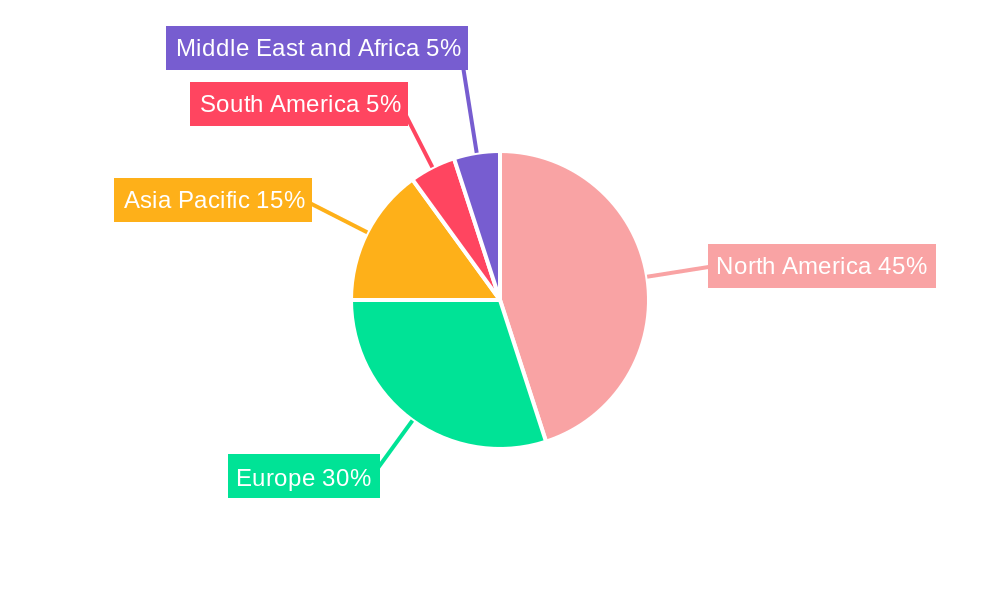
The interventional radiology market, valued at $26.96 billion in 2025, is projected to experience robust growth, driven by several key factors. Technological advancements, such as minimally invasive procedures and advanced imaging techniques (like improved MRI and CT scanners), are significantly enhancing diagnostic capabilities and treatment efficacy. This leads to a higher demand for interventional radiology services, particularly in cardiology, oncology, and gastroenterology. The aging global population, coupled with rising prevalence of chronic diseases like cardiovascular disease and cancer, further fuels market expansion. Furthermore, increasing healthcare expenditure and the adoption of sophisticated medical devices contribute to market growth. However, high costs associated with advanced imaging equipment and procedures, stringent regulatory approvals, and the potential risks associated with minimally invasive interventions act as market restraints. Geographic variations exist, with North America and Europe currently dominating market share due to higher adoption rates of advanced technologies and well-established healthcare infrastructure. However, emerging economies in Asia-Pacific and other regions present significant growth opportunities as healthcare infrastructure develops and awareness of interventional radiology increases. The market segmentation indicates a strong demand across various product categories, with MRI systems, ultrasound imaging systems, and CT scanners leading the way. This diversified demand reflects the wide range of applications within interventional radiology.
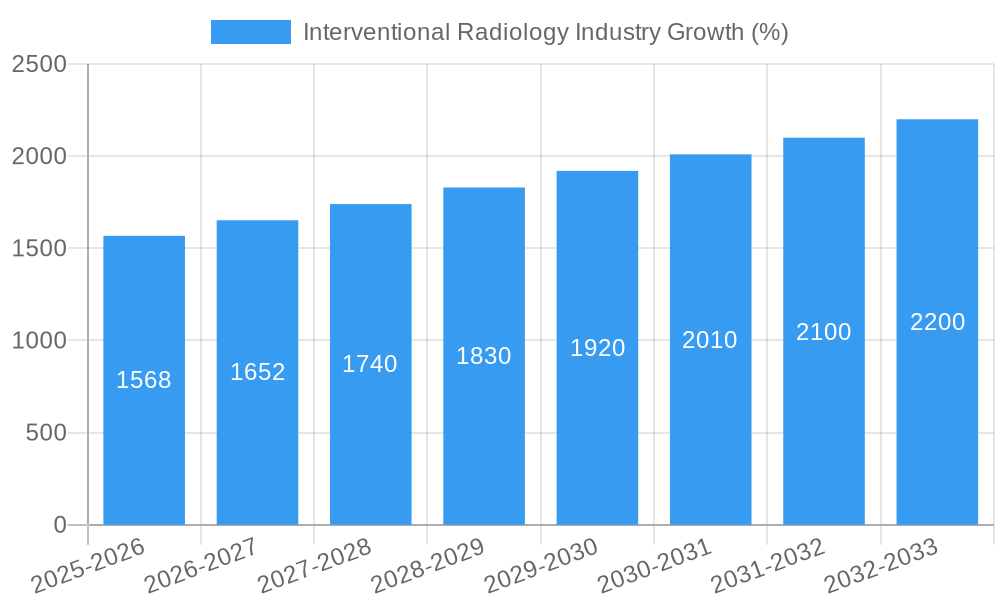
The forecast period (2025-2033) anticipates a consistent expansion based on the 5.90% CAGR. This growth will likely be fueled by continued technological innovation, improved patient outcomes, and increasing investment in healthcare infrastructure globally. Strategic collaborations between medical device manufacturers and healthcare providers will also play a crucial role in shaping market dynamics. While challenges related to costs and regulations remain, the overall outlook for the interventional radiology market is positive, signifying significant potential for market participants and investors. The focus will continue to shift towards minimally invasive techniques, personalized medicine, and improved patient experiences. Competition among established players and emerging companies will be intense, driving innovation and enhancing the overall quality of interventional radiology services.
Interventional Radiology Industry Market Report: 2019-2033
This comprehensive report provides an in-depth analysis of the Interventional Radiology industry, encompassing market size, growth drivers, competitive landscape, and future trends from 2019 to 2033. The study period covers the historical period (2019-2024), the base year (2025), and the forecast period (2025-2033). This report is essential for stakeholders seeking a detailed understanding of this dynamic market, valued at $xx Million in 2025 and projected to reach $xx Million by 2033.
Interventional Radiology Industry Market Composition & Trends
The interventional radiology market is characterized by moderate concentration, with key players like GE Healthcare, Medtronic PLC, and Siemens Healthineers AG holding significant market share. The market share distribution is dynamic, with ongoing mergers and acquisitions (M&A) reshaping the competitive landscape. Total M&A deal value in the past five years exceeded $xx Million. Innovation is a key driver, fueled by advancements in imaging technology, minimally invasive procedures, and AI-driven diagnostics. The regulatory landscape plays a crucial role, influencing product approvals and reimbursement policies. Substitute products, such as open surgery, pose some competition but are generally limited by their invasiveness. The end-user profile is broad, encompassing hospitals, clinics, and ambulatory surgical centers.
- Market Concentration: Moderately concentrated, with top 5 players holding approximately xx% market share in 2025.
- Innovation Catalysts: AI integration, advanced imaging modalities, miniaturization of devices.
- Regulatory Landscape: Stringent regulatory approvals, reimbursement policies impacting market access.
- Substitute Products: Open surgery, competing on invasiveness and recovery time.
- End-User Profile: Hospitals (60%), Clinics (25%), Ambulatory Surgical Centers (15%).
- M&A Activity: Significant M&A activity in recent years, with total deal value exceeding $xx Million (2020-2024).
Interventional Radiology Industry Industry Evolution
The interventional radiology market has witnessed robust growth from 2019 to 2024, with a CAGR of xx%. This growth is primarily driven by technological advancements leading to improved diagnostic capabilities and minimally invasive procedures. The increasing prevalence of chronic diseases, aging population, and rising healthcare expenditure contribute significantly. Consumer demand is shifting toward less invasive, faster recovery procedures, fueled by patient preference for improved outcomes and shorter hospital stays. Adoption rates for advanced imaging technologies like AI-powered systems are steadily increasing, demonstrating a preference for enhanced precision and efficiency. Technological advancements, including AI-powered image analysis and robotic-assisted interventions, are fundamentally transforming the field. The market is projected to experience continued growth, driven by factors such as an increase in the prevalence of chronic diseases, technological advancements, and rising healthcare spending.
Leading Regions, Countries, or Segments in Interventional Radiology Industry
North America currently dominates the interventional radiology market, driven by high healthcare expenditure, technological advancements, and a strong regulatory framework. Within product segments, Angiography Systems and Ultrasound Imaging Systems hold the largest market share. The Cardiology application segment leads in terms of revenue, followed by Oncology.
Key Drivers (North America):
- High healthcare expenditure.
- Advanced technological infrastructure.
- Strong regulatory support for innovative technologies.
- High prevalence of chronic diseases.
Dominant Product Segments: Angiography Systems, Ultrasound Imaging Systems
Dominant Application Segments: Cardiology, Oncology
Regional Analysis: North America (xx%), Europe (xx%), Asia Pacific (xx%), Rest of World (xx%).
Interventional Radiology Industry Product Innovations
Recent product innovations include AI-powered image analysis tools for improved diagnostic accuracy, miniaturized biopsy devices for less invasive procedures, and advanced angiography systems with enhanced resolution and functionality. These advancements improve procedural efficacy, reduce patient discomfort, and shorten recovery times, representing a significant shift towards minimally invasive treatments. Unique selling propositions focus on reduced procedure time, improved image quality, and enhanced patient safety features.
Propelling Factors for Interventional Radiology Industry Growth
Technological advancements, such as AI-powered image analysis and robotic-assisted interventions, are key growth drivers. Rising prevalence of chronic diseases, an aging global population, and increasing healthcare expenditure further propel market expansion. Favorable regulatory environments and government initiatives supporting minimally invasive procedures also contribute significantly.
Obstacles in the Interventional Radiology Industry Market
Stringent regulatory approvals for new technologies can lead to delays in market entry, impacting overall growth. Supply chain disruptions related to the manufacturing of components and raw materials can affect production and availability. Intense competition among established players and the emergence of new entrants create pricing pressures and market share challenges.
Future Opportunities in Interventional Radiology Industry
Emerging opportunities lie in the expansion into untapped markets, the development of AI-powered diagnostic tools for early disease detection, and the integration of tele-interventional radiology for improved access to care in remote areas. Furthermore, the development of personalized medicine approaches tailored to individual patient needs offers promising avenues for growth.
Major Players in the Interventional Radiology Industry Ecosystem
- Hologic Inc
- GE Healthcare
- Medtronic PLC
- Siemens Healthineers AG
- Carestream Health
- Koninklijke Philips NV
- Canon Medical Systems Corporation
- Cook Medical
- Esaote SPA
- Shimadzu Corporation
- Samsung Medison (Samsung Electronics Co Ltd)
- Fujifilm Holdings Corporation
Key Developments in Interventional Radiology Industry Industry
- November 2022: Konica Minolta Healthcare Americas launched the Sonimage MX1 Platinum point-of-care ultrasound system, expanding access to diagnostic imaging.
- November 2022: Fujifilm Healthcare Americas Corporation launched the Scenaria View Focus Edition CT system with Cardio StillShot, enhancing cardiac imaging capabilities.
- October 2022: GE Healthcare launched the Omni Legend all-digital PET/CT platform, improving operational efficiency.
Strategic Interventional Radiology Industry Market Forecast
The interventional radiology market is poised for significant growth, driven by continuous technological advancements, increased adoption of minimally invasive procedures, and the rising prevalence of chronic diseases globally. The market is expected to witness substantial expansion, particularly in emerging economies with growing healthcare infrastructure. Further innovation in AI and robotics will drive market penetration and expand the range of applications.
Interventional Radiology Industry Segmentation
-
1. Product
- 1.1. MRI Systems
- 1.2. Ultrasound Imaging Systems
- 1.3. CT Scanners
- 1.4. Angiography Systems
- 1.5. Fluoroscopy Systems
- 1.6. Biopsy Devices
- 1.7. Other Products
-
2. Application
- 2.1. Cardiology
- 2.2. Urology and Nephrology
- 2.3. Oncology
- 2.4. Gastroenterology
- 2.5. Other Applications
Interventional Radiology Industry Segmentation By Geography
-
1. North America
- 1.1. United States
- 1.2. Canada
- 1.3. Mexico
-
2. Europe
- 2.1. Germany
- 2.2. United Kingdom
- 2.3. France
- 2.4. Italy
- 2.5. Spain
- 2.6. Rest of Europe
-
3. Asia Pacific
- 3.1. China
- 3.2. Japan
- 3.3. India
- 3.4. Australia
- 3.5. South Korea
- 3.6. Rest of Asia Pacific
-
4. Middle East and Africa
- 4.1. GCC
- 4.2. South Africa
- 4.3. Rest of Middle East and Africa
-
5. South America
- 5.1. Brazil
- 5.2. Argentina
- 5.3. Rest of South America
Interventional Radiology Industry REPORT HIGHLIGHTS
| Aspects | Details |
|---|---|
| Study Period | 2019-2033 |
| Base Year | 2024 |
| Estimated Year | 2025 |
| Forecast Period | 2025-2033 |
| Historical Period | 2019-2024 |
| Growth Rate | CAGR of 5.90% from 2019-2033 |
| Segmentation |
|
Table of Contents
- 1. Introduction
- 1.1. Research Scope
- 1.2. Market Segmentation
- 1.3. Research Methodology
- 1.4. Definitions and Assumptions
- 2. Executive Summary
- 2.1. Introduction
- 3. Market Dynamics
- 3.1. Introduction
- 3.2. Market Drivers
- 3.2.1. Increasing Burden of Chronic Diseases; Technological Advancements in Interventional Radiology Devices
- 3.3. Market Restrains
- 3.3.1. Risk of High Radiation Exposure; High Cost of Equipment
- 3.4. Market Trends
- 3.4.1. The Cardiology Application is Expected to Witness High Growth Over the Forecast Period
- 4. Market Factor Analysis
- 4.1. Porters Five Forces
- 4.2. Supply/Value Chain
- 4.3. PESTEL analysis
- 4.4. Market Entropy
- 4.5. Patent/Trademark Analysis
- 5. Global Interventional Radiology Industry Analysis, Insights and Forecast, 2019-2031
- 5.1. Market Analysis, Insights and Forecast - by Product
- 5.1.1. MRI Systems
- 5.1.2. Ultrasound Imaging Systems
- 5.1.3. CT Scanners
- 5.1.4. Angiography Systems
- 5.1.5. Fluoroscopy Systems
- 5.1.6. Biopsy Devices
- 5.1.7. Other Products
- 5.2. Market Analysis, Insights and Forecast - by Application
- 5.2.1. Cardiology
- 5.2.2. Urology and Nephrology
- 5.2.3. Oncology
- 5.2.4. Gastroenterology
- 5.2.5. Other Applications
- 5.3. Market Analysis, Insights and Forecast - by Region
- 5.3.1. North America
- 5.3.2. Europe
- 5.3.3. Asia Pacific
- 5.3.4. Middle East and Africa
- 5.3.5. South America
- 5.1. Market Analysis, Insights and Forecast - by Product
- 6. North America Interventional Radiology Industry Analysis, Insights and Forecast, 2019-2031
- 6.1. Market Analysis, Insights and Forecast - by Product
- 6.1.1. MRI Systems
- 6.1.2. Ultrasound Imaging Systems
- 6.1.3. CT Scanners
- 6.1.4. Angiography Systems
- 6.1.5. Fluoroscopy Systems
- 6.1.6. Biopsy Devices
- 6.1.7. Other Products
- 6.2. Market Analysis, Insights and Forecast - by Application
- 6.2.1. Cardiology
- 6.2.2. Urology and Nephrology
- 6.2.3. Oncology
- 6.2.4. Gastroenterology
- 6.2.5. Other Applications
- 6.1. Market Analysis, Insights and Forecast - by Product
- 7. Europe Interventional Radiology Industry Analysis, Insights and Forecast, 2019-2031
- 7.1. Market Analysis, Insights and Forecast - by Product
- 7.1.1. MRI Systems
- 7.1.2. Ultrasound Imaging Systems
- 7.1.3. CT Scanners
- 7.1.4. Angiography Systems
- 7.1.5. Fluoroscopy Systems
- 7.1.6. Biopsy Devices
- 7.1.7. Other Products
- 7.2. Market Analysis, Insights and Forecast - by Application
- 7.2.1. Cardiology
- 7.2.2. Urology and Nephrology
- 7.2.3. Oncology
- 7.2.4. Gastroenterology
- 7.2.5. Other Applications
- 7.1. Market Analysis, Insights and Forecast - by Product
- 8. Asia Pacific Interventional Radiology Industry Analysis, Insights and Forecast, 2019-2031
- 8.1. Market Analysis, Insights and Forecast - by Product
- 8.1.1. MRI Systems
- 8.1.2. Ultrasound Imaging Systems
- 8.1.3. CT Scanners
- 8.1.4. Angiography Systems
- 8.1.5. Fluoroscopy Systems
- 8.1.6. Biopsy Devices
- 8.1.7. Other Products
- 8.2. Market Analysis, Insights and Forecast - by Application
- 8.2.1. Cardiology
- 8.2.2. Urology and Nephrology
- 8.2.3. Oncology
- 8.2.4. Gastroenterology
- 8.2.5. Other Applications
- 8.1. Market Analysis, Insights and Forecast - by Product
- 9. Middle East and Africa Interventional Radiology Industry Analysis, Insights and Forecast, 2019-2031
- 9.1. Market Analysis, Insights and Forecast - by Product
- 9.1.1. MRI Systems
- 9.1.2. Ultrasound Imaging Systems
- 9.1.3. CT Scanners
- 9.1.4. Angiography Systems
- 9.1.5. Fluoroscopy Systems
- 9.1.6. Biopsy Devices
- 9.1.7. Other Products
- 9.2. Market Analysis, Insights and Forecast - by Application
- 9.2.1. Cardiology
- 9.2.2. Urology and Nephrology
- 9.2.3. Oncology
- 9.2.4. Gastroenterology
- 9.2.5. Other Applications
- 9.1. Market Analysis, Insights and Forecast - by Product
- 10. South America Interventional Radiology Industry Analysis, Insights and Forecast, 2019-2031
- 10.1. Market Analysis, Insights and Forecast - by Product
- 10.1.1. MRI Systems
- 10.1.2. Ultrasound Imaging Systems
- 10.1.3. CT Scanners
- 10.1.4. Angiography Systems
- 10.1.5. Fluoroscopy Systems
- 10.1.6. Biopsy Devices
- 10.1.7. Other Products
- 10.2. Market Analysis, Insights and Forecast - by Application
- 10.2.1. Cardiology
- 10.2.2. Urology and Nephrology
- 10.2.3. Oncology
- 10.2.4. Gastroenterology
- 10.2.5. Other Applications
- 10.1. Market Analysis, Insights and Forecast - by Product
- 11. North America Interventional Radiology Industry Analysis, Insights and Forecast, 2019-2031
- 11.1. Market Analysis, Insights and Forecast - By Country/Sub-region
- 11.1.1 United States
- 11.1.2 Canada
- 11.1.3 Mexico
- 12. Europe Interventional Radiology Industry Analysis, Insights and Forecast, 2019-2031
- 12.1. Market Analysis, Insights and Forecast - By Country/Sub-region
- 12.1.1 Germany
- 12.1.2 United Kingdom
- 12.1.3 France
- 12.1.4 Italy
- 12.1.5 Spain
- 12.1.6 Rest of Europe
- 13. Asia Pacific Interventional Radiology Industry Analysis, Insights and Forecast, 2019-2031
- 13.1. Market Analysis, Insights and Forecast - By Country/Sub-region
- 13.1.1 China
- 13.1.2 Japan
- 13.1.3 India
- 13.1.4 Australia
- 13.1.5 South Korea
- 13.1.6 Rest of Asia Pacific
- 14. South America Interventional Radiology Industry Analysis, Insights and Forecast, 2019-2031
- 14.1. Market Analysis, Insights and Forecast - By Country/Sub-region
- 14.1.1 Brazil
- 14.1.2 Argentina
- 14.1.3 Rest of South America
- 15. Middle East and Africa Interventional Radiology Industry Analysis, Insights and Forecast, 2019-2031
- 15.1. Market Analysis, Insights and Forecast - By Country/Sub-region
- 15.1.1 GCC
- 15.1.2 South Africa
- 15.1.3 Rest of Middle East and Africa
- 16. Competitive Analysis
- 16.1. Global Market Share Analysis 2024
- 16.2. Company Profiles
- 16.2.1 Hologic Inc
- 16.2.1.1. Overview
- 16.2.1.2. Products
- 16.2.1.3. SWOT Analysis
- 16.2.1.4. Recent Developments
- 16.2.1.5. Financials (Based on Availability)
- 16.2.2 GE Healthcare
- 16.2.2.1. Overview
- 16.2.2.2. Products
- 16.2.2.3. SWOT Analysis
- 16.2.2.4. Recent Developments
- 16.2.2.5. Financials (Based on Availability)
- 16.2.3 Medtronic PLC
- 16.2.3.1. Overview
- 16.2.3.2. Products
- 16.2.3.3. SWOT Analysis
- 16.2.3.4. Recent Developments
- 16.2.3.5. Financials (Based on Availability)
- 16.2.4 Siemens Healthineers AG
- 16.2.4.1. Overview
- 16.2.4.2. Products
- 16.2.4.3. SWOT Analysis
- 16.2.4.4. Recent Developments
- 16.2.4.5. Financials (Based on Availability)
- 16.2.5 Carestream Health
- 16.2.5.1. Overview
- 16.2.5.2. Products
- 16.2.5.3. SWOT Analysis
- 16.2.5.4. Recent Developments
- 16.2.5.5. Financials (Based on Availability)
- 16.2.6 Koninklijke Philips NV
- 16.2.6.1. Overview
- 16.2.6.2. Products
- 16.2.6.3. SWOT Analysis
- 16.2.6.4. Recent Developments
- 16.2.6.5. Financials (Based on Availability)
- 16.2.7 Canon Medical Systems Corporation
- 16.2.7.1. Overview
- 16.2.7.2. Products
- 16.2.7.3. SWOT Analysis
- 16.2.7.4. Recent Developments
- 16.2.7.5. Financials (Based on Availability)
- 16.2.8 Cook Medical
- 16.2.8.1. Overview
- 16.2.8.2. Products
- 16.2.8.3. SWOT Analysis
- 16.2.8.4. Recent Developments
- 16.2.8.5. Financials (Based on Availability)
- 16.2.9 Esaote SPA
- 16.2.9.1. Overview
- 16.2.9.2. Products
- 16.2.9.3. SWOT Analysis
- 16.2.9.4. Recent Developments
- 16.2.9.5. Financials (Based on Availability)
- 16.2.10 Shimadzu Corporation
- 16.2.10.1. Overview
- 16.2.10.2. Products
- 16.2.10.3. SWOT Analysis
- 16.2.10.4. Recent Developments
- 16.2.10.5. Financials (Based on Availability)
- 16.2.11 Samsung Medison (Samsung Electronics Co Ltd)
- 16.2.11.1. Overview
- 16.2.11.2. Products
- 16.2.11.3. SWOT Analysis
- 16.2.11.4. Recent Developments
- 16.2.11.5. Financials (Based on Availability)
- 16.2.12 Fujifilm Holdings Corporation
- 16.2.12.1. Overview
- 16.2.12.2. Products
- 16.2.12.3. SWOT Analysis
- 16.2.12.4. Recent Developments
- 16.2.12.5. Financials (Based on Availability)
- 16.2.1 Hologic Inc
List of Figures
- Figure 1: Global Interventional Radiology Industry Revenue Breakdown (Million, %) by Region 2024 & 2032
- Figure 2: North America Interventional Radiology Industry Revenue (Million), by Country 2024 & 2032
- Figure 3: North America Interventional Radiology Industry Revenue Share (%), by Country 2024 & 2032
- Figure 4: Europe Interventional Radiology Industry Revenue (Million), by Country 2024 & 2032
- Figure 5: Europe Interventional Radiology Industry Revenue Share (%), by Country 2024 & 2032
- Figure 6: Asia Pacific Interventional Radiology Industry Revenue (Million), by Country 2024 & 2032
- Figure 7: Asia Pacific Interventional Radiology Industry Revenue Share (%), by Country 2024 & 2032
- Figure 8: South America Interventional Radiology Industry Revenue (Million), by Country 2024 & 2032
- Figure 9: South America Interventional Radiology Industry Revenue Share (%), by Country 2024 & 2032
- Figure 10: Middle East and Africa Interventional Radiology Industry Revenue (Million), by Country 2024 & 2032
- Figure 11: Middle East and Africa Interventional Radiology Industry Revenue Share (%), by Country 2024 & 2032
- Figure 12: North America Interventional Radiology Industry Revenue (Million), by Product 2024 & 2032
- Figure 13: North America Interventional Radiology Industry Revenue Share (%), by Product 2024 & 2032
- Figure 14: North America Interventional Radiology Industry Revenue (Million), by Application 2024 & 2032
- Figure 15: North America Interventional Radiology Industry Revenue Share (%), by Application 2024 & 2032
- Figure 16: North America Interventional Radiology Industry Revenue (Million), by Country 2024 & 2032
- Figure 17: North America Interventional Radiology Industry Revenue Share (%), by Country 2024 & 2032
- Figure 18: Europe Interventional Radiology Industry Revenue (Million), by Product 2024 & 2032
- Figure 19: Europe Interventional Radiology Industry Revenue Share (%), by Product 2024 & 2032
- Figure 20: Europe Interventional Radiology Industry Revenue (Million), by Application 2024 & 2032
- Figure 21: Europe Interventional Radiology Industry Revenue Share (%), by Application 2024 & 2032
- Figure 22: Europe Interventional Radiology Industry Revenue (Million), by Country 2024 & 2032
- Figure 23: Europe Interventional Radiology Industry Revenue Share (%), by Country 2024 & 2032
- Figure 24: Asia Pacific Interventional Radiology Industry Revenue (Million), by Product 2024 & 2032
- Figure 25: Asia Pacific Interventional Radiology Industry Revenue Share (%), by Product 2024 & 2032
- Figure 26: Asia Pacific Interventional Radiology Industry Revenue (Million), by Application 2024 & 2032
- Figure 27: Asia Pacific Interventional Radiology Industry Revenue Share (%), by Application 2024 & 2032
- Figure 28: Asia Pacific Interventional Radiology Industry Revenue (Million), by Country 2024 & 2032
- Figure 29: Asia Pacific Interventional Radiology Industry Revenue Share (%), by Country 2024 & 2032
- Figure 30: Middle East and Africa Interventional Radiology Industry Revenue (Million), by Product 2024 & 2032
- Figure 31: Middle East and Africa Interventional Radiology Industry Revenue Share (%), by Product 2024 & 2032
- Figure 32: Middle East and Africa Interventional Radiology Industry Revenue (Million), by Application 2024 & 2032
- Figure 33: Middle East and Africa Interventional Radiology Industry Revenue Share (%), by Application 2024 & 2032
- Figure 34: Middle East and Africa Interventional Radiology Industry Revenue (Million), by Country 2024 & 2032
- Figure 35: Middle East and Africa Interventional Radiology Industry Revenue Share (%), by Country 2024 & 2032
- Figure 36: South America Interventional Radiology Industry Revenue (Million), by Product 2024 & 2032
- Figure 37: South America Interventional Radiology Industry Revenue Share (%), by Product 2024 & 2032
- Figure 38: South America Interventional Radiology Industry Revenue (Million), by Application 2024 & 2032
- Figure 39: South America Interventional Radiology Industry Revenue Share (%), by Application 2024 & 2032
- Figure 40: South America Interventional Radiology Industry Revenue (Million), by Country 2024 & 2032
- Figure 41: South America Interventional Radiology Industry Revenue Share (%), by Country 2024 & 2032
List of Tables
- Table 1: Global Interventional Radiology Industry Revenue Million Forecast, by Region 2019 & 2032
- Table 2: Global Interventional Radiology Industry Revenue Million Forecast, by Product 2019 & 2032
- Table 3: Global Interventional Radiology Industry Revenue Million Forecast, by Application 2019 & 2032
- Table 4: Global Interventional Radiology Industry Revenue Million Forecast, by Region 2019 & 2032
- Table 5: Global Interventional Radiology Industry Revenue Million Forecast, by Country 2019 & 2032
- Table 6: United States Interventional Radiology Industry Revenue (Million) Forecast, by Application 2019 & 2032
- Table 7: Canada Interventional Radiology Industry Revenue (Million) Forecast, by Application 2019 & 2032
- Table 8: Mexico Interventional Radiology Industry Revenue (Million) Forecast, by Application 2019 & 2032
- Table 9: Global Interventional Radiology Industry Revenue Million Forecast, by Country 2019 & 2032
- Table 10: Germany Interventional Radiology Industry Revenue (Million) Forecast, by Application 2019 & 2032
- Table 11: United Kingdom Interventional Radiology Industry Revenue (Million) Forecast, by Application 2019 & 2032
- Table 12: France Interventional Radiology Industry Revenue (Million) Forecast, by Application 2019 & 2032
- Table 13: Italy Interventional Radiology Industry Revenue (Million) Forecast, by Application 2019 & 2032
- Table 14: Spain Interventional Radiology Industry Revenue (Million) Forecast, by Application 2019 & 2032
- Table 15: Rest of Europe Interventional Radiology Industry Revenue (Million) Forecast, by Application 2019 & 2032
- Table 16: Global Interventional Radiology Industry Revenue Million Forecast, by Country 2019 & 2032
- Table 17: China Interventional Radiology Industry Revenue (Million) Forecast, by Application 2019 & 2032
- Table 18: Japan Interventional Radiology Industry Revenue (Million) Forecast, by Application 2019 & 2032
- Table 19: India Interventional Radiology Industry Revenue (Million) Forecast, by Application 2019 & 2032
- Table 20: Australia Interventional Radiology Industry Revenue (Million) Forecast, by Application 2019 & 2032
- Table 21: South Korea Interventional Radiology Industry Revenue (Million) Forecast, by Application 2019 & 2032
- Table 22: Rest of Asia Pacific Interventional Radiology Industry Revenue (Million) Forecast, by Application 2019 & 2032
- Table 23: Global Interventional Radiology Industry Revenue Million Forecast, by Country 2019 & 2032
- Table 24: Brazil Interventional Radiology Industry Revenue (Million) Forecast, by Application 2019 & 2032
- Table 25: Argentina Interventional Radiology Industry Revenue (Million) Forecast, by Application 2019 & 2032
- Table 26: Rest of South America Interventional Radiology Industry Revenue (Million) Forecast, by Application 2019 & 2032
- Table 27: Global Interventional Radiology Industry Revenue Million Forecast, by Country 2019 & 2032
- Table 28: GCC Interventional Radiology Industry Revenue (Million) Forecast, by Application 2019 & 2032
- Table 29: South Africa Interventional Radiology Industry Revenue (Million) Forecast, by Application 2019 & 2032
- Table 30: Rest of Middle East and Africa Interventional Radiology Industry Revenue (Million) Forecast, by Application 2019 & 2032
- Table 31: Global Interventional Radiology Industry Revenue Million Forecast, by Product 2019 & 2032
- Table 32: Global Interventional Radiology Industry Revenue Million Forecast, by Application 2019 & 2032
- Table 33: Global Interventional Radiology Industry Revenue Million Forecast, by Country 2019 & 2032
- Table 34: United States Interventional Radiology Industry Revenue (Million) Forecast, by Application 2019 & 2032
- Table 35: Canada Interventional Radiology Industry Revenue (Million) Forecast, by Application 2019 & 2032
- Table 36: Mexico Interventional Radiology Industry Revenue (Million) Forecast, by Application 2019 & 2032
- Table 37: Global Interventional Radiology Industry Revenue Million Forecast, by Product 2019 & 2032
- Table 38: Global Interventional Radiology Industry Revenue Million Forecast, by Application 2019 & 2032
- Table 39: Global Interventional Radiology Industry Revenue Million Forecast, by Country 2019 & 2032
- Table 40: Germany Interventional Radiology Industry Revenue (Million) Forecast, by Application 2019 & 2032
- Table 41: United Kingdom Interventional Radiology Industry Revenue (Million) Forecast, by Application 2019 & 2032
- Table 42: France Interventional Radiology Industry Revenue (Million) Forecast, by Application 2019 & 2032
- Table 43: Italy Interventional Radiology Industry Revenue (Million) Forecast, by Application 2019 & 2032
- Table 44: Spain Interventional Radiology Industry Revenue (Million) Forecast, by Application 2019 & 2032
- Table 45: Rest of Europe Interventional Radiology Industry Revenue (Million) Forecast, by Application 2019 & 2032
- Table 46: Global Interventional Radiology Industry Revenue Million Forecast, by Product 2019 & 2032
- Table 47: Global Interventional Radiology Industry Revenue Million Forecast, by Application 2019 & 2032
- Table 48: Global Interventional Radiology Industry Revenue Million Forecast, by Country 2019 & 2032
- Table 49: China Interventional Radiology Industry Revenue (Million) Forecast, by Application 2019 & 2032
- Table 50: Japan Interventional Radiology Industry Revenue (Million) Forecast, by Application 2019 & 2032
- Table 51: India Interventional Radiology Industry Revenue (Million) Forecast, by Application 2019 & 2032
- Table 52: Australia Interventional Radiology Industry Revenue (Million) Forecast, by Application 2019 & 2032
- Table 53: South Korea Interventional Radiology Industry Revenue (Million) Forecast, by Application 2019 & 2032
- Table 54: Rest of Asia Pacific Interventional Radiology Industry Revenue (Million) Forecast, by Application 2019 & 2032
- Table 55: Global Interventional Radiology Industry Revenue Million Forecast, by Product 2019 & 2032
- Table 56: Global Interventional Radiology Industry Revenue Million Forecast, by Application 2019 & 2032
- Table 57: Global Interventional Radiology Industry Revenue Million Forecast, by Country 2019 & 2032
- Table 58: GCC Interventional Radiology Industry Revenue (Million) Forecast, by Application 2019 & 2032
- Table 59: South Africa Interventional Radiology Industry Revenue (Million) Forecast, by Application 2019 & 2032
- Table 60: Rest of Middle East and Africa Interventional Radiology Industry Revenue (Million) Forecast, by Application 2019 & 2032
- Table 61: Global Interventional Radiology Industry Revenue Million Forecast, by Product 2019 & 2032
- Table 62: Global Interventional Radiology Industry Revenue Million Forecast, by Application 2019 & 2032
- Table 63: Global Interventional Radiology Industry Revenue Million Forecast, by Country 2019 & 2032
- Table 64: Brazil Interventional Radiology Industry Revenue (Million) Forecast, by Application 2019 & 2032
- Table 65: Argentina Interventional Radiology Industry Revenue (Million) Forecast, by Application 2019 & 2032
- Table 66: Rest of South America Interventional Radiology Industry Revenue (Million) Forecast, by Application 2019 & 2032
Frequently Asked Questions
1. What is the projected Compound Annual Growth Rate (CAGR) of the Interventional Radiology Industry?
The projected CAGR is approximately 5.90%.
2. Which companies are prominent players in the Interventional Radiology Industry?
Key companies in the market include Hologic Inc, GE Healthcare, Medtronic PLC, Siemens Healthineers AG, Carestream Health, Koninklijke Philips NV, Canon Medical Systems Corporation, Cook Medical, Esaote SPA, Shimadzu Corporation, Samsung Medison (Samsung Electronics Co Ltd), Fujifilm Holdings Corporation.
3. What are the main segments of the Interventional Radiology Industry?
The market segments include Product, Application.
4. Can you provide details about the market size?
The market size is estimated to be USD 26.96 Million as of 2022.
5. What are some drivers contributing to market growth?
Increasing Burden of Chronic Diseases; Technological Advancements in Interventional Radiology Devices.
6. What are the notable trends driving market growth?
The Cardiology Application is Expected to Witness High Growth Over the Forecast Period.
7. Are there any restraints impacting market growth?
Risk of High Radiation Exposure; High Cost of Equipment.
8. Can you provide examples of recent developments in the market?
November 2022: Konica Minolta Healthcare Americas launched a new point-of-care ultrasound system called Sonimage MX1 Platinum.
9. What pricing options are available for accessing the report?
Pricing options include single-user, multi-user, and enterprise licenses priced at USD 4750, USD 5250, and USD 8750 respectively.
10. Is the market size provided in terms of value or volume?
The market size is provided in terms of value, measured in Million.
11. Are there any specific market keywords associated with the report?
Yes, the market keyword associated with the report is "Interventional Radiology Industry," which aids in identifying and referencing the specific market segment covered.
12. How do I determine which pricing option suits my needs best?
The pricing options vary based on user requirements and access needs. Individual users may opt for single-user licenses, while businesses requiring broader access may choose multi-user or enterprise licenses for cost-effective access to the report.
13. Are there any additional resources or data provided in the Interventional Radiology Industry report?
While the report offers comprehensive insights, it's advisable to review the specific contents or supplementary materials provided to ascertain if additional resources or data are available.
14. How can I stay updated on further developments or reports in the Interventional Radiology Industry?
To stay informed about further developments, trends, and reports in the Interventional Radiology Industry, consider subscribing to industry newsletters, following relevant companies and organizations, or regularly checking reputable industry news sources and publications.
Methodology
Step 1 - Identification of Relevant Samples Size from Population Database


Step 2 - Approaches for Defining Global Market Size (Value, Volume* & Price*)

Note*: In applicable scenarios
Step 3 - Data Sources
Primary Research
- Web Analytics
- Survey Reports
- Research Institute
- Latest Research Reports
- Opinion Leaders
Secondary Research
- Annual Reports
- White Paper
- Latest Press Release
- Industry Association
- Paid Database
- Investor Presentations

Step 4 - Data Triangulation
Involves using different sources of information in order to increase the validity of a study
These sources are likely to be stakeholders in a program - participants, other researchers, program staff, other community members, and so on.
Then we put all data in single framework & apply various statistical tools to find out the dynamic on the market.
During the analysis stage, feedback from the stakeholder groups would be compared to determine areas of agreement as well as areas of divergence
