

Key Insights
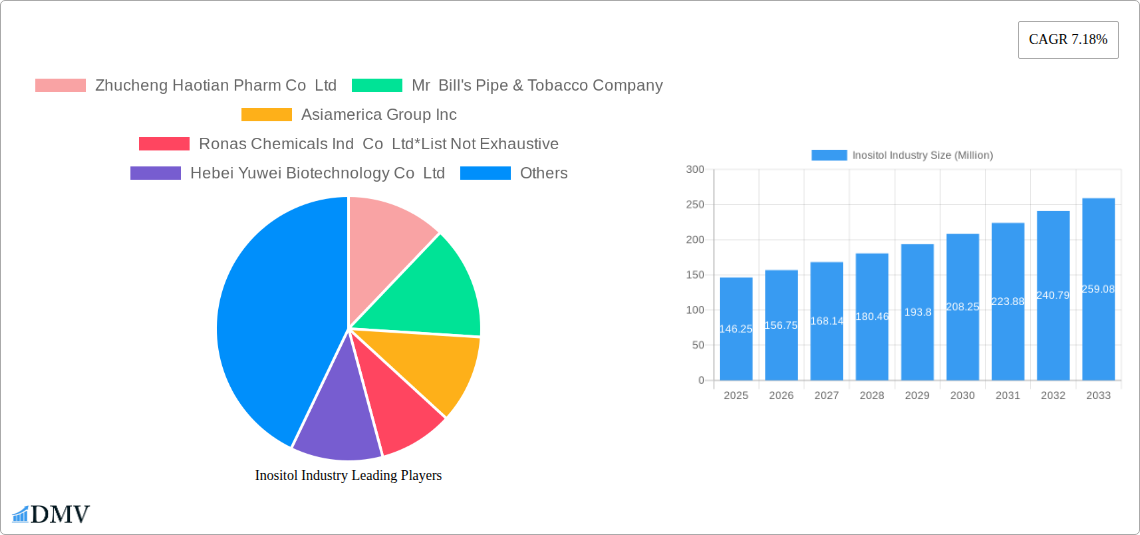
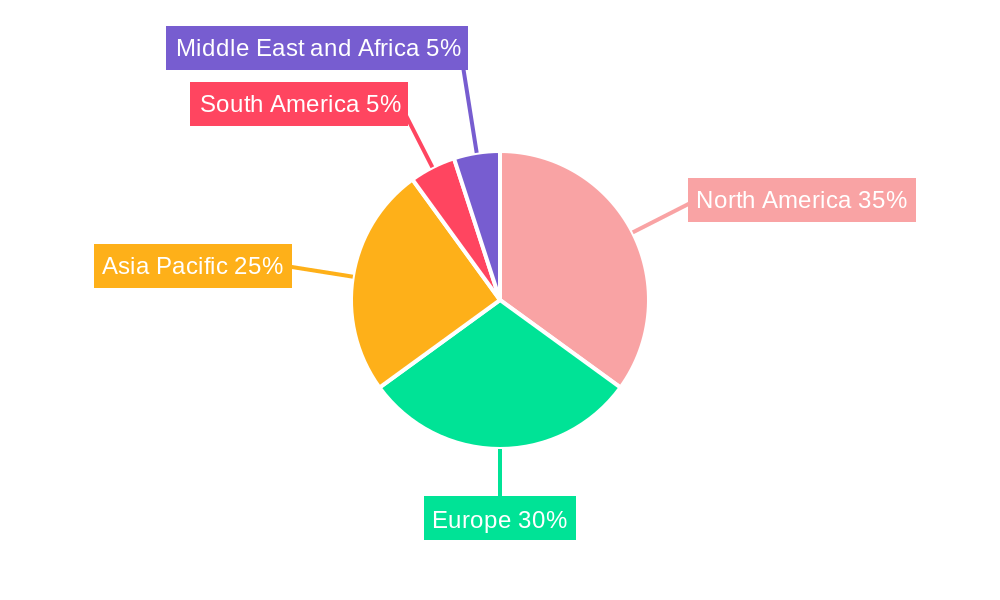
The inositol market, valued at $146.25 million in 2025, is projected to experience robust growth, driven by increasing demand across diverse applications. The compound annual growth rate (CAGR) of 7.18% from 2025 to 2033 indicates a significant expansion opportunity. Key growth drivers include the rising popularity of dietary supplements, particularly among health-conscious consumers seeking improved mental well-being and metabolic health. The burgeoning beverage industry's incorporation of inositol as a functional ingredient further fuels market expansion. The feed industry's utilization of inositol as a nutritional supplement for livestock also contributes to market growth. While the pharmaceutical industry represents a smaller segment currently, its potential for growth is significant, driven by ongoing research exploring inositol's therapeutic applications. Plant-based inositol sources are gaining traction due to increasing consumer preference for natural and sustainable products. However, price volatility in raw materials and stringent regulatory requirements might pose challenges to market growth. The market is geographically diverse, with North America and Europe currently holding significant market shares, but Asia-Pacific is anticipated to exhibit substantial growth in the coming years, driven by increasing awareness and adoption in emerging economies. Competition is likely to intensify, with both established players and new entrants vying for market share. The forecast period (2025-2033) presents a promising outlook for the inositol market, with continued expansion driven by factors such as increasing consumer awareness, product innovation, and expanding applications.
The segmentation by application highlights the diversified nature of the inositol market. Dietary supplements currently hold a substantial share, reflecting the increasing consumer interest in natural health solutions. The beverage sector is expected to witness significant growth due to the incorporation of inositol in functional beverages targeting specific health benefits. The pharmaceutical industry's adoption of inositol is likely to grow gradually as more clinical research validates its therapeutic potential. Similarly, the feed industry will continue to utilize inositol for animal nutrition, driving steady demand. The source-based segmentation underscores the growing preference for plant-based inositol, driven by sustainability concerns and consumer demand for natural ingredients. The competitive landscape is characterized by a mix of established multinational corporations and regional players. Successful companies are likely to focus on innovation, strategic partnerships, and expanding their geographical reach to capitalize on emerging market opportunities. The forecast indicates a consistent upward trajectory for the market, influenced by several interrelated factors including growing health consciousness, product innovation, and evolving consumer preferences.
Inositol Industry Market Report: 2019-2033
This comprehensive report provides a detailed analysis of the global inositol market, offering invaluable insights for stakeholders across the value chain. With a study period spanning 2019-2033, a base year of 2025, and a forecast period of 2025-2033, this report delivers a precise and future-oriented perspective on this dynamic market. The report covers a market valued at xx Million in 2025, poised for significant growth.
Inositol Industry Market Composition & Trends
This section evaluates the competitive landscape of the inositol market, analyzing market concentration, innovation drivers, regulatory frameworks, substitute products, end-user profiles, and mergers and acquisitions (M&A) activities. The global inositol market is moderately fragmented, with several key players vying for market share. Market share distribution shows a concentration among a handful of large companies and a dispersed segment of smaller producers. M&A activity is moderate, with deal values ranging from xx Million to xx Million in recent years. The regulatory landscape varies across geographies, influencing product approvals and market entry strategies. Innovation is largely driven by the development of novel applications and the refinement of production methods to enhance efficiency and sustainability.
- Market Concentration: Moderately fragmented
- Top 5 Players Market Share: xx%
- Average M&A Deal Value (2019-2024): xx Million
- Key Innovation Areas: Sustainable production, novel applications in nutraceuticals and pharmaceuticals.
- Substitute Products: Other dietary supplements targeting similar health benefits.
Inositol Industry Evolution
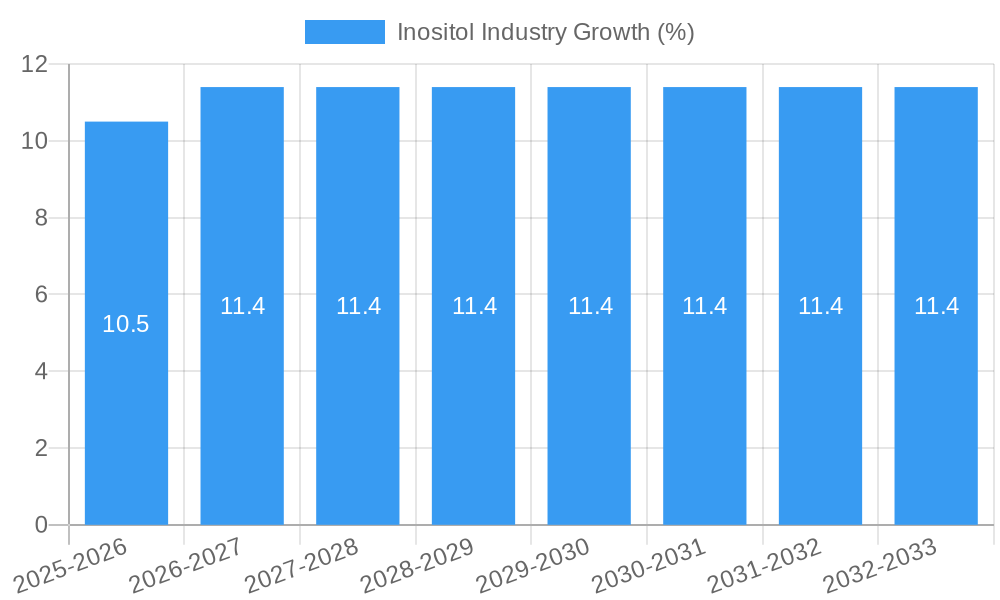
The inositol market has witnessed substantial growth over the historical period (2019-2024), fueled by increasing consumer awareness of health benefits and expanding applications in various industries. Technological advancements in production processes and purification techniques have improved product quality and reduced costs, further driving market expansion. Shifting consumer preferences toward natural and functional ingredients and the growing demand for dietary supplements and nutraceuticals are key factors contributing to market expansion. The market is projected to exhibit a Compound Annual Growth Rate (CAGR) of xx% during the forecast period (2025-2033). This growth is particularly driven by the increasing prevalence of conditions such as PCOS and the rising demand for effective management solutions. Furthermore, the pharmaceutical sector's interest in inositol's therapeutic potential is stimulating innovation and driving market expansion.
Leading Regions, Countries, or Segments in Inositol Industry
The report identifies key regions, countries, and application segments dominating the inositol market. The Dietary Supplement segment currently holds the largest market share, followed by the Pharmaceutical and Feed industries. Plant-based inositol is the predominant source. North America and Europe are significant markets due to high consumer awareness and robust regulatory frameworks.
- Dominant Region: North America
- Fastest-Growing Region: Asia-Pacific
- Largest Application Segment: Dietary Supplements
- Key Drivers for Dietary Supplement Segment: Rising consumer health consciousness, increasing prevalence of PCOS, and strong marketing efforts by companies like MD Logic Health and Veera Wellness.
- Key Drivers for Pharmaceutical Segment: Growing research into inositol's therapeutic potential, particularly for mental health conditions.
- Key Drivers for Feed Industry Segment: Increasing demand for animal feed additives that enhance animal health and productivity.
Inositol Industry Product Innovations
Recent product innovations include the launch of specialized inositol formulations tailored for specific health concerns, such as PCOS and anxiety. These products often highlight clinically studied dosages and incorporate unique delivery systems for enhanced bioavailability. Technological advancements have led to the production of higher-purity inositol with improved efficacy and reduced side effects. These innovations are key to expanding market penetration and driving premium pricing strategies.
Propelling Factors for Inositol Industry Growth
Several factors are driving the inositol market's growth trajectory. Rising consumer health awareness and demand for natural and functional food and supplements are paramount. Expanding research on inositol's therapeutic benefits is boosting adoption within the pharmaceutical sector. Furthermore, supportive regulatory frameworks in several regions streamline market entry and boost product development.
Obstacles in the Inositol Industry Market
Despite significant growth potential, challenges exist. Price volatility in raw materials and supply chain disruptions can impact production costs and product availability. Intense competition among established players and new entrants creates price pressures. Varying regulatory landscapes across regions add complexity to market entry and product approval processes.
Future Opportunities in Inositol Industry
Future growth will be driven by increasing demand in emerging markets, expansion into new applications (e.g., cosmetics), and the development of innovative formulations with enhanced efficacy and bioavailability. Furthermore, technological advancements in sustainable production processes will enhance the industry's environmental footprint and attract environmentally conscious consumers.
Major Players in the Inositol Industry Ecosystem
- Zhucheng Haotian Pharm Co Ltd
- Mr Bill's Pipe & Tobacco Company
- Asiamerica Group Inc
- Ronas Chemicals Ind Co Ltd
- Hebei Yuwei Biotechnology Co Ltd
- Charles Bowman & Company
- Koninklijke DSM NV
- Shandong Runde Biotechnology Co
- T J Clark & Company
- Jingkai Biotechnology
Key Developments in Inositol Industry
- March 2023: MD Logic Health launches "Inositol by Cynthia Thurlow," a physician-recommended dietary supplement.
- March 2023: Veera Wellness introduces VeeVital PCOS support, a nutraceutical containing clinically studied Myo-inositol dosages.
- February 2023: Pro360 launches FemCare+ and HPHF product lines incorporating myo-inositol.
Strategic Inositol Industry Market Forecast
The inositol market is projected to experience sustained growth, driven by increased consumer demand, technological innovation, and expansion into new applications. The rising prevalence of chronic diseases and the increasing adoption of natural health solutions will create substantial opportunities for market expansion. The market's future will be shaped by companies focusing on product innovation, efficient production processes, and strategic market expansion into key regions.
Inositol Industry Segmentation
-
1. Source
- 1.1. Plant-based Inositol
- 1.2. Synthetic Inositol
-
2. Application
- 2.1. Dietary Supplement
- 2.2. Beverage
- 2.3. Feed Industry
- 2.4. Pharmaceutical Industry
- 2.5. Other Applications
Inositol Industry Segmentation By Geography
-
1. North America
- 1.1. United States
- 1.2. Canada
- 1.3. Mexico
- 1.4. Rest of North America
-
2. Europe
- 2.1. United Kingdom
- 2.2. Germany
- 2.3. France
- 2.4. Russia
- 2.5. Italy
- 2.6. Spain
- 2.7. Rest of Europe
-
3. Asia Pacific
- 3.1. India
- 3.2. China
- 3.3. Japan
- 3.4. Australia
- 3.5. Rest of Asia Pacific
-
4. South America
- 4.1. Brazil
- 4.2. Argentina
- 4.3. Rest of South America
-
5. Middle East and Africa
- 5.1. South Africa
- 5.2. Saudi Arabia
- 5.3. Rest of Middle East and Africa
Inositol Industry REPORT HIGHLIGHTS
| Aspects | Details |
|---|---|
| Study Period | 2019-2033 |
| Base Year | 2024 |
| Estimated Year | 2025 |
| Forecast Period | 2025-2033 |
| Historical Period | 2019-2024 |
| Growth Rate | CAGR of 7.18% from 2019-2033 |
| Segmentation |
|
Table of Contents
- 1. Introduction
- 1.1. Research Scope
- 1.2. Market Segmentation
- 1.3. Research Methodology
- 1.4. Definitions and Assumptions
- 2. Executive Summary
- 2.1. Introduction
- 3. Market Dynamics
- 3.1. Introduction
- 3.2. Market Drivers
- 3.2.1. Increasing Demand for Clean Label Bakery Products; Increasing Popularity of Specialty Ingredients
- 3.3. Market Restrains
- 3.3.1. Risk of Allergies
- 3.4. Market Trends
- 3.4.1. Increasing Demand for Inositol in Pharmaceutical Industry
- 4. Market Factor Analysis
- 4.1. Porters Five Forces
- 4.2. Supply/Value Chain
- 4.3. PESTEL analysis
- 4.4. Market Entropy
- 4.5. Patent/Trademark Analysis
- 5. Global Inositol Industry Analysis, Insights and Forecast, 2019-2031
- 5.1. Market Analysis, Insights and Forecast - by Source
- 5.1.1. Plant-based Inositol
- 5.1.2. Synthetic Inositol
- 5.2. Market Analysis, Insights and Forecast - by Application
- 5.2.1. Dietary Supplement
- 5.2.2. Beverage
- 5.2.3. Feed Industry
- 5.2.4. Pharmaceutical Industry
- 5.2.5. Other Applications
- 5.3. Market Analysis, Insights and Forecast - by Region
- 5.3.1. North America
- 5.3.2. Europe
- 5.3.3. Asia Pacific
- 5.3.4. South America
- 5.3.5. Middle East and Africa
- 5.1. Market Analysis, Insights and Forecast - by Source
- 6. North America Inositol Industry Analysis, Insights and Forecast, 2019-2031
- 6.1. Market Analysis, Insights and Forecast - by Source
- 6.1.1. Plant-based Inositol
- 6.1.2. Synthetic Inositol
- 6.2. Market Analysis, Insights and Forecast - by Application
- 6.2.1. Dietary Supplement
- 6.2.2. Beverage
- 6.2.3. Feed Industry
- 6.2.4. Pharmaceutical Industry
- 6.2.5. Other Applications
- 6.1. Market Analysis, Insights and Forecast - by Source
- 7. Europe Inositol Industry Analysis, Insights and Forecast, 2019-2031
- 7.1. Market Analysis, Insights and Forecast - by Source
- 7.1.1. Plant-based Inositol
- 7.1.2. Synthetic Inositol
- 7.2. Market Analysis, Insights and Forecast - by Application
- 7.2.1. Dietary Supplement
- 7.2.2. Beverage
- 7.2.3. Feed Industry
- 7.2.4. Pharmaceutical Industry
- 7.2.5. Other Applications
- 7.1. Market Analysis, Insights and Forecast - by Source
- 8. Asia Pacific Inositol Industry Analysis, Insights and Forecast, 2019-2031
- 8.1. Market Analysis, Insights and Forecast - by Source
- 8.1.1. Plant-based Inositol
- 8.1.2. Synthetic Inositol
- 8.2. Market Analysis, Insights and Forecast - by Application
- 8.2.1. Dietary Supplement
- 8.2.2. Beverage
- 8.2.3. Feed Industry
- 8.2.4. Pharmaceutical Industry
- 8.2.5. Other Applications
- 8.1. Market Analysis, Insights and Forecast - by Source
- 9. South America Inositol Industry Analysis, Insights and Forecast, 2019-2031
- 9.1. Market Analysis, Insights and Forecast - by Source
- 9.1.1. Plant-based Inositol
- 9.1.2. Synthetic Inositol
- 9.2. Market Analysis, Insights and Forecast - by Application
- 9.2.1. Dietary Supplement
- 9.2.2. Beverage
- 9.2.3. Feed Industry
- 9.2.4. Pharmaceutical Industry
- 9.2.5. Other Applications
- 9.1. Market Analysis, Insights and Forecast - by Source
- 10. Middle East and Africa Inositol Industry Analysis, Insights and Forecast, 2019-2031
- 10.1. Market Analysis, Insights and Forecast - by Source
- 10.1.1. Plant-based Inositol
- 10.1.2. Synthetic Inositol
- 10.2. Market Analysis, Insights and Forecast - by Application
- 10.2.1. Dietary Supplement
- 10.2.2. Beverage
- 10.2.3. Feed Industry
- 10.2.4. Pharmaceutical Industry
- 10.2.5. Other Applications
- 10.1. Market Analysis, Insights and Forecast - by Source
- 11. North America Inositol Industry Analysis, Insights and Forecast, 2019-2031
- 11.1. Market Analysis, Insights and Forecast - By Country/Sub-region
- 11.1.1 United States
- 11.1.2 Canada
- 11.1.3 Mexico
- 11.1.4 Rest of North America
- 12. Europe Inositol Industry Analysis, Insights and Forecast, 2019-2031
- 12.1. Market Analysis, Insights and Forecast - By Country/Sub-region
- 12.1.1 United Kingdom
- 12.1.2 Germany
- 12.1.3 France
- 12.1.4 Russia
- 12.1.5 Italy
- 12.1.6 Spain
- 12.1.7 Rest of Europe
- 13. Asia Pacific Inositol Industry Analysis, Insights and Forecast, 2019-2031
- 13.1. Market Analysis, Insights and Forecast - By Country/Sub-region
- 13.1.1 India
- 13.1.2 China
- 13.1.3 Japan
- 13.1.4 Australia
- 13.1.5 Rest of Asia Pacific
- 14. South America Inositol Industry Analysis, Insights and Forecast, 2019-2031
- 14.1. Market Analysis, Insights and Forecast - By Country/Sub-region
- 14.1.1 Brazil
- 14.1.2 Argentina
- 14.1.3 Rest of South America
- 15. Middle East and Africa Inositol Industry Analysis, Insights and Forecast, 2019-2031
- 15.1. Market Analysis, Insights and Forecast - By Country/Sub-region
- 15.1.1 South Africa
- 15.1.2 Saudi Arabia
- 15.1.3 Rest of Middle East and Africa
- 16. Competitive Analysis
- 16.1. Global Market Share Analysis 2024
- 16.2. Company Profiles
- 16.2.1 Zhucheng Haotian Pharm Co Ltd
- 16.2.1.1. Overview
- 16.2.1.2. Products
- 16.2.1.3. SWOT Analysis
- 16.2.1.4. Recent Developments
- 16.2.1.5. Financials (Based on Availability)
- 16.2.2 Mr Bill's Pipe & Tobacco Company
- 16.2.2.1. Overview
- 16.2.2.2. Products
- 16.2.2.3. SWOT Analysis
- 16.2.2.4. Recent Developments
- 16.2.2.5. Financials (Based on Availability)
- 16.2.3 Asiamerica Group Inc
- 16.2.3.1. Overview
- 16.2.3.2. Products
- 16.2.3.3. SWOT Analysis
- 16.2.3.4. Recent Developments
- 16.2.3.5. Financials (Based on Availability)
- 16.2.4 Ronas Chemicals Ind Co Ltd*List Not Exhaustive
- 16.2.4.1. Overview
- 16.2.4.2. Products
- 16.2.4.3. SWOT Analysis
- 16.2.4.4. Recent Developments
- 16.2.4.5. Financials (Based on Availability)
- 16.2.5 Hebei Yuwei Biotechnology Co Ltd
- 16.2.5.1. Overview
- 16.2.5.2. Products
- 16.2.5.3. SWOT Analysis
- 16.2.5.4. Recent Developments
- 16.2.5.5. Financials (Based on Availability)
- 16.2.6 Charles Bowman & Company
- 16.2.6.1. Overview
- 16.2.6.2. Products
- 16.2.6.3. SWOT Analysis
- 16.2.6.4. Recent Developments
- 16.2.6.5. Financials (Based on Availability)
- 16.2.7 Koninklijke DSM NV
- 16.2.7.1. Overview
- 16.2.7.2. Products
- 16.2.7.3. SWOT Analysis
- 16.2.7.4. Recent Developments
- 16.2.7.5. Financials (Based on Availability)
- 16.2.8 Shandong Runde Biotechnology Co
- 16.2.8.1. Overview
- 16.2.8.2. Products
- 16.2.8.3. SWOT Analysis
- 16.2.8.4. Recent Developments
- 16.2.8.5. Financials (Based on Availability)
- 16.2.9 T J Clark & Company
- 16.2.9.1. Overview
- 16.2.9.2. Products
- 16.2.9.3. SWOT Analysis
- 16.2.9.4. Recent Developments
- 16.2.9.5. Financials (Based on Availability)
- 16.2.10 Jingkai Biotechnology
- 16.2.10.1. Overview
- 16.2.10.2. Products
- 16.2.10.3. SWOT Analysis
- 16.2.10.4. Recent Developments
- 16.2.10.5. Financials (Based on Availability)
- 16.2.1 Zhucheng Haotian Pharm Co Ltd
List of Figures
- Figure 1: Global Inositol Industry Revenue Breakdown (Million, %) by Region 2024 & 2032
- Figure 2: North America Inositol Industry Revenue (Million), by Country 2024 & 2032
- Figure 3: North America Inositol Industry Revenue Share (%), by Country 2024 & 2032
- Figure 4: Europe Inositol Industry Revenue (Million), by Country 2024 & 2032
- Figure 5: Europe Inositol Industry Revenue Share (%), by Country 2024 & 2032
- Figure 6: Asia Pacific Inositol Industry Revenue (Million), by Country 2024 & 2032
- Figure 7: Asia Pacific Inositol Industry Revenue Share (%), by Country 2024 & 2032
- Figure 8: South America Inositol Industry Revenue (Million), by Country 2024 & 2032
- Figure 9: South America Inositol Industry Revenue Share (%), by Country 2024 & 2032
- Figure 10: Middle East and Africa Inositol Industry Revenue (Million), by Country 2024 & 2032
- Figure 11: Middle East and Africa Inositol Industry Revenue Share (%), by Country 2024 & 2032
- Figure 12: North America Inositol Industry Revenue (Million), by Source 2024 & 2032
- Figure 13: North America Inositol Industry Revenue Share (%), by Source 2024 & 2032
- Figure 14: North America Inositol Industry Revenue (Million), by Application 2024 & 2032
- Figure 15: North America Inositol Industry Revenue Share (%), by Application 2024 & 2032
- Figure 16: North America Inositol Industry Revenue (Million), by Country 2024 & 2032
- Figure 17: North America Inositol Industry Revenue Share (%), by Country 2024 & 2032
- Figure 18: Europe Inositol Industry Revenue (Million), by Source 2024 & 2032
- Figure 19: Europe Inositol Industry Revenue Share (%), by Source 2024 & 2032
- Figure 20: Europe Inositol Industry Revenue (Million), by Application 2024 & 2032
- Figure 21: Europe Inositol Industry Revenue Share (%), by Application 2024 & 2032
- Figure 22: Europe Inositol Industry Revenue (Million), by Country 2024 & 2032
- Figure 23: Europe Inositol Industry Revenue Share (%), by Country 2024 & 2032
- Figure 24: Asia Pacific Inositol Industry Revenue (Million), by Source 2024 & 2032
- Figure 25: Asia Pacific Inositol Industry Revenue Share (%), by Source 2024 & 2032
- Figure 26: Asia Pacific Inositol Industry Revenue (Million), by Application 2024 & 2032
- Figure 27: Asia Pacific Inositol Industry Revenue Share (%), by Application 2024 & 2032
- Figure 28: Asia Pacific Inositol Industry Revenue (Million), by Country 2024 & 2032
- Figure 29: Asia Pacific Inositol Industry Revenue Share (%), by Country 2024 & 2032
- Figure 30: South America Inositol Industry Revenue (Million), by Source 2024 & 2032
- Figure 31: South America Inositol Industry Revenue Share (%), by Source 2024 & 2032
- Figure 32: South America Inositol Industry Revenue (Million), by Application 2024 & 2032
- Figure 33: South America Inositol Industry Revenue Share (%), by Application 2024 & 2032
- Figure 34: South America Inositol Industry Revenue (Million), by Country 2024 & 2032
- Figure 35: South America Inositol Industry Revenue Share (%), by Country 2024 & 2032
- Figure 36: Middle East and Africa Inositol Industry Revenue (Million), by Source 2024 & 2032
- Figure 37: Middle East and Africa Inositol Industry Revenue Share (%), by Source 2024 & 2032
- Figure 38: Middle East and Africa Inositol Industry Revenue (Million), by Application 2024 & 2032
- Figure 39: Middle East and Africa Inositol Industry Revenue Share (%), by Application 2024 & 2032
- Figure 40: Middle East and Africa Inositol Industry Revenue (Million), by Country 2024 & 2032
- Figure 41: Middle East and Africa Inositol Industry Revenue Share (%), by Country 2024 & 2032
List of Tables
- Table 1: Global Inositol Industry Revenue Million Forecast, by Region 2019 & 2032
- Table 2: Global Inositol Industry Revenue Million Forecast, by Source 2019 & 2032
- Table 3: Global Inositol Industry Revenue Million Forecast, by Application 2019 & 2032
- Table 4: Global Inositol Industry Revenue Million Forecast, by Region 2019 & 2032
- Table 5: Global Inositol Industry Revenue Million Forecast, by Country 2019 & 2032
- Table 6: United States Inositol Industry Revenue (Million) Forecast, by Application 2019 & 2032
- Table 7: Canada Inositol Industry Revenue (Million) Forecast, by Application 2019 & 2032
- Table 8: Mexico Inositol Industry Revenue (Million) Forecast, by Application 2019 & 2032
- Table 9: Rest of North America Inositol Industry Revenue (Million) Forecast, by Application 2019 & 2032
- Table 10: Global Inositol Industry Revenue Million Forecast, by Country 2019 & 2032
- Table 11: United Kingdom Inositol Industry Revenue (Million) Forecast, by Application 2019 & 2032
- Table 12: Germany Inositol Industry Revenue (Million) Forecast, by Application 2019 & 2032
- Table 13: France Inositol Industry Revenue (Million) Forecast, by Application 2019 & 2032
- Table 14: Russia Inositol Industry Revenue (Million) Forecast, by Application 2019 & 2032
- Table 15: Italy Inositol Industry Revenue (Million) Forecast, by Application 2019 & 2032
- Table 16: Spain Inositol Industry Revenue (Million) Forecast, by Application 2019 & 2032
- Table 17: Rest of Europe Inositol Industry Revenue (Million) Forecast, by Application 2019 & 2032
- Table 18: Global Inositol Industry Revenue Million Forecast, by Country 2019 & 2032
- Table 19: India Inositol Industry Revenue (Million) Forecast, by Application 2019 & 2032
- Table 20: China Inositol Industry Revenue (Million) Forecast, by Application 2019 & 2032
- Table 21: Japan Inositol Industry Revenue (Million) Forecast, by Application 2019 & 2032
- Table 22: Australia Inositol Industry Revenue (Million) Forecast, by Application 2019 & 2032
- Table 23: Rest of Asia Pacific Inositol Industry Revenue (Million) Forecast, by Application 2019 & 2032
- Table 24: Global Inositol Industry Revenue Million Forecast, by Country 2019 & 2032
- Table 25: Brazil Inositol Industry Revenue (Million) Forecast, by Application 2019 & 2032
- Table 26: Argentina Inositol Industry Revenue (Million) Forecast, by Application 2019 & 2032
- Table 27: Rest of South America Inositol Industry Revenue (Million) Forecast, by Application 2019 & 2032
- Table 28: Global Inositol Industry Revenue Million Forecast, by Country 2019 & 2032
- Table 29: South Africa Inositol Industry Revenue (Million) Forecast, by Application 2019 & 2032
- Table 30: Saudi Arabia Inositol Industry Revenue (Million) Forecast, by Application 2019 & 2032
- Table 31: Rest of Middle East and Africa Inositol Industry Revenue (Million) Forecast, by Application 2019 & 2032
- Table 32: Global Inositol Industry Revenue Million Forecast, by Source 2019 & 2032
- Table 33: Global Inositol Industry Revenue Million Forecast, by Application 2019 & 2032
- Table 34: Global Inositol Industry Revenue Million Forecast, by Country 2019 & 2032
- Table 35: United States Inositol Industry Revenue (Million) Forecast, by Application 2019 & 2032
- Table 36: Canada Inositol Industry Revenue (Million) Forecast, by Application 2019 & 2032
- Table 37: Mexico Inositol Industry Revenue (Million) Forecast, by Application 2019 & 2032
- Table 38: Rest of North America Inositol Industry Revenue (Million) Forecast, by Application 2019 & 2032
- Table 39: Global Inositol Industry Revenue Million Forecast, by Source 2019 & 2032
- Table 40: Global Inositol Industry Revenue Million Forecast, by Application 2019 & 2032
- Table 41: Global Inositol Industry Revenue Million Forecast, by Country 2019 & 2032
- Table 42: United Kingdom Inositol Industry Revenue (Million) Forecast, by Application 2019 & 2032
- Table 43: Germany Inositol Industry Revenue (Million) Forecast, by Application 2019 & 2032
- Table 44: France Inositol Industry Revenue (Million) Forecast, by Application 2019 & 2032
- Table 45: Russia Inositol Industry Revenue (Million) Forecast, by Application 2019 & 2032
- Table 46: Italy Inositol Industry Revenue (Million) Forecast, by Application 2019 & 2032
- Table 47: Spain Inositol Industry Revenue (Million) Forecast, by Application 2019 & 2032
- Table 48: Rest of Europe Inositol Industry Revenue (Million) Forecast, by Application 2019 & 2032
- Table 49: Global Inositol Industry Revenue Million Forecast, by Source 2019 & 2032
- Table 50: Global Inositol Industry Revenue Million Forecast, by Application 2019 & 2032
- Table 51: Global Inositol Industry Revenue Million Forecast, by Country 2019 & 2032
- Table 52: India Inositol Industry Revenue (Million) Forecast, by Application 2019 & 2032
- Table 53: China Inositol Industry Revenue (Million) Forecast, by Application 2019 & 2032
- Table 54: Japan Inositol Industry Revenue (Million) Forecast, by Application 2019 & 2032
- Table 55: Australia Inositol Industry Revenue (Million) Forecast, by Application 2019 & 2032
- Table 56: Rest of Asia Pacific Inositol Industry Revenue (Million) Forecast, by Application 2019 & 2032
- Table 57: Global Inositol Industry Revenue Million Forecast, by Source 2019 & 2032
- Table 58: Global Inositol Industry Revenue Million Forecast, by Application 2019 & 2032
- Table 59: Global Inositol Industry Revenue Million Forecast, by Country 2019 & 2032
- Table 60: Brazil Inositol Industry Revenue (Million) Forecast, by Application 2019 & 2032
- Table 61: Argentina Inositol Industry Revenue (Million) Forecast, by Application 2019 & 2032
- Table 62: Rest of South America Inositol Industry Revenue (Million) Forecast, by Application 2019 & 2032
- Table 63: Global Inositol Industry Revenue Million Forecast, by Source 2019 & 2032
- Table 64: Global Inositol Industry Revenue Million Forecast, by Application 2019 & 2032
- Table 65: Global Inositol Industry Revenue Million Forecast, by Country 2019 & 2032
- Table 66: South Africa Inositol Industry Revenue (Million) Forecast, by Application 2019 & 2032
- Table 67: Saudi Arabia Inositol Industry Revenue (Million) Forecast, by Application 2019 & 2032
- Table 68: Rest of Middle East and Africa Inositol Industry Revenue (Million) Forecast, by Application 2019 & 2032
Frequently Asked Questions
1. What is the projected Compound Annual Growth Rate (CAGR) of the Inositol Industry?
The projected CAGR is approximately 7.18%.
2. Which companies are prominent players in the Inositol Industry?
Key companies in the market include Zhucheng Haotian Pharm Co Ltd, Mr Bill's Pipe & Tobacco Company, Asiamerica Group Inc, Ronas Chemicals Ind Co Ltd*List Not Exhaustive, Hebei Yuwei Biotechnology Co Ltd, Charles Bowman & Company, Koninklijke DSM NV, Shandong Runde Biotechnology Co, T J Clark & Company, Jingkai Biotechnology.
3. What are the main segments of the Inositol Industry?
The market segments include Source, Application.
4. Can you provide details about the market size?
The market size is estimated to be USD 146.25 Million as of 2022.
5. What are some drivers contributing to market growth?
Increasing Demand for Clean Label Bakery Products; Increasing Popularity of Specialty Ingredients.
6. What are the notable trends driving market growth?
Increasing Demand for Inositol in Pharmaceutical Industry.
7. Are there any restraints impacting market growth?
Risk of Allergies.
8. Can you provide examples of recent developments in the market?
In March 2023, MD Logic Health, a leading provider of USA-made professional-grade nutraceuticals and physician-recommended dietary supplements, announced its second collaboration with Cynthia Thurlow, NP. The latest product developed under this collaboration is Inositol by Cynthia Thurlow, powered by MD Logic Health. Myo-inositol, a naturally occurring organic compound produced by the liver and kidney, is crucial in regulating the body's response and hormones associated with mood and cognition.
9. What pricing options are available for accessing the report?
Pricing options include single-user, multi-user, and enterprise licenses priced at USD 4750, USD 5250, and USD 8750 respectively.
10. Is the market size provided in terms of value or volume?
The market size is provided in terms of value, measured in Million.
11. Are there any specific market keywords associated with the report?
Yes, the market keyword associated with the report is "Inositol Industry," which aids in identifying and referencing the specific market segment covered.
12. How do I determine which pricing option suits my needs best?
The pricing options vary based on user requirements and access needs. Individual users may opt for single-user licenses, while businesses requiring broader access may choose multi-user or enterprise licenses for cost-effective access to the report.
13. Are there any additional resources or data provided in the Inositol Industry report?
While the report offers comprehensive insights, it's advisable to review the specific contents or supplementary materials provided to ascertain if additional resources or data are available.
14. How can I stay updated on further developments or reports in the Inositol Industry?
To stay informed about further developments, trends, and reports in the Inositol Industry, consider subscribing to industry newsletters, following relevant companies and organizations, or regularly checking reputable industry news sources and publications.
Methodology
Step 1 - Identification of Relevant Samples Size from Population Database


Step 2 - Approaches for Defining Global Market Size (Value, Volume* & Price*)

Note*: In applicable scenarios
Step 3 - Data Sources
Primary Research
- Web Analytics
- Survey Reports
- Research Institute
- Latest Research Reports
- Opinion Leaders
Secondary Research
- Annual Reports
- White Paper
- Latest Press Release
- Industry Association
- Paid Database
- Investor Presentations

Step 4 - Data Triangulation
Involves using different sources of information in order to increase the validity of a study
These sources are likely to be stakeholders in a program - participants, other researchers, program staff, other community members, and so on.
Then we put all data in single framework & apply various statistical tools to find out the dynamic on the market.
During the analysis stage, feedback from the stakeholder groups would be compared to determine areas of agreement as well as areas of divergence
