

Key Insights
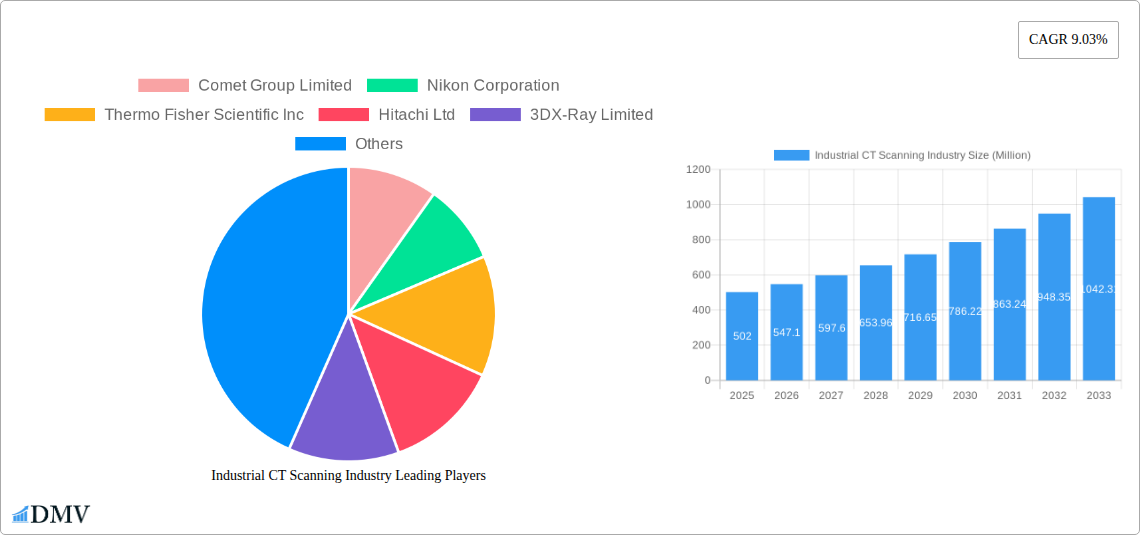
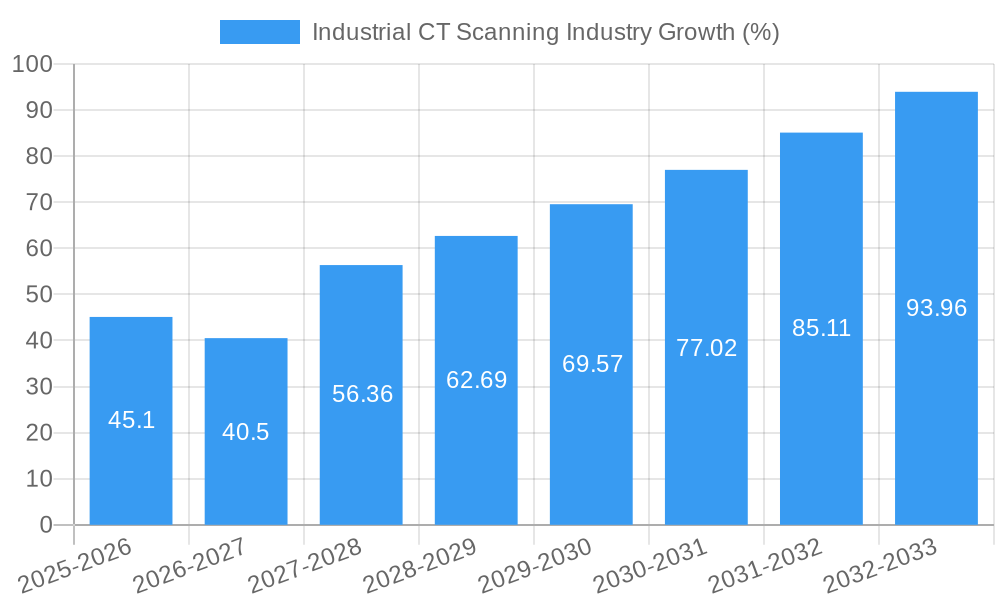
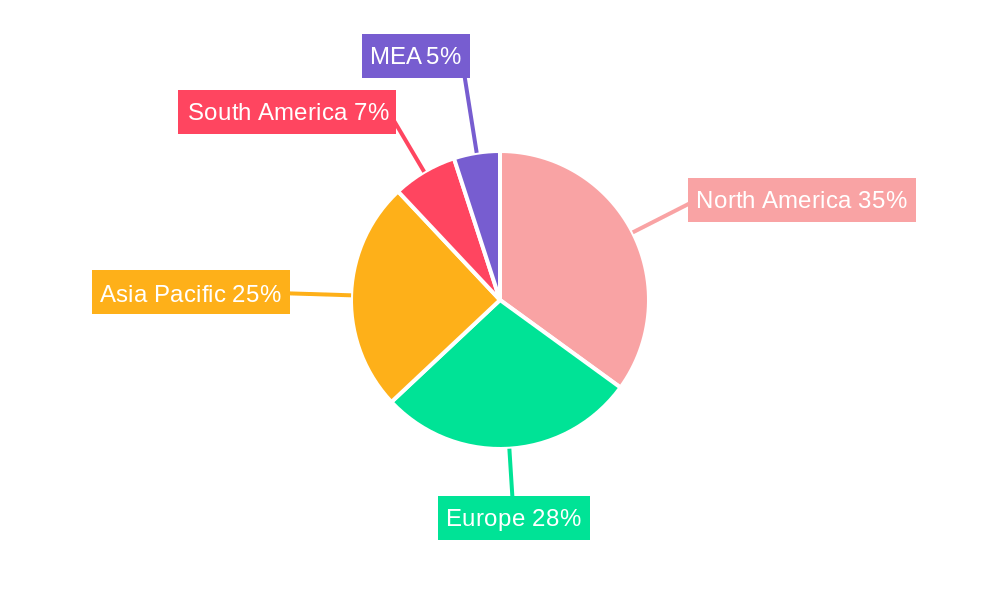
The Industrial CT Scanning market is experiencing robust growth, projected to reach \$502 million in 2025 and maintain a Compound Annual Growth Rate (CAGR) of 9.03% from 2025 to 2033. This expansion is fueled by several key drivers. The increasing demand for enhanced quality control and non-destructive testing (NDT) methods across diverse industries like aerospace, automotive, and electronics is a primary factor. Advanced manufacturing techniques, particularly additive manufacturing (3D printing), necessitate rigorous quality checks, further boosting the adoption of industrial CT scanning. Moreover, the rising need for precise failure analysis to improve product reliability and reduce downtime in critical operations significantly contributes to market growth. Technological advancements, including improvements in image resolution, faster scan times, and the integration of advanced software for data analysis, are also driving market expansion. The market is segmented by application (flaw detection, failure analysis, assembly analysis, and others) and end-user industry (aerospace, automotive, electronics, oil and gas, and others), reflecting the broad applicability of this technology. North America currently holds a significant market share, but the Asia-Pacific region is poised for rapid growth due to increasing industrialization and infrastructure development.
The competitive landscape is characterized by a mix of established players like Nikon Corporation, Thermo Fisher Scientific, and Zeiss International, and specialized companies like 3DX-Ray. These companies are engaged in continuous innovation to enhance the capabilities of their systems, expanding their market share and catering to specific industry needs. While challenges such as high initial investment costs and the need for skilled operators exist, the long-term benefits in terms of improved product quality, reduced production costs, and enhanced safety outweigh these restraints, ensuring continued market expansion throughout the forecast period. The market's growth trajectory suggests that continued investment in R&D, strategic partnerships, and expansion into emerging markets will be crucial for success within this dynamic sector.
Industrial CT Scanning Industry Market Report: 2019-2033
This comprehensive report provides an in-depth analysis of the Industrial CT Scanning industry, projecting a market valued at xx Million by 2033. It covers market size, segmentation, leading players, technological advancements, and future growth prospects, offering crucial insights for stakeholders across the value chain. The study period spans from 2019 to 2033, with 2025 serving as the base and estimated year.
Industrial CT Scanning Industry Market Composition & Trends
The Industrial CT Scanning market, valued at xx Million in 2024, exhibits a moderately consolidated structure with key players holding significant market share. Market concentration is influenced by factors such as technological advancements, regulatory compliance, and the need for specialized expertise. Innovation is a key driver, with ongoing research into higher resolution imaging, faster scan times, and advanced data analysis techniques. The regulatory landscape varies across regions, impacting market access and product approval timelines. Substitute products, such as conventional non-destructive testing (NDT) methods, pose some competitive pressure, although the superior capabilities of CT scanning are often preferred for complex applications. The end-user profile is diverse, spanning various sectors including aerospace, automotive, and electronics manufacturing. M&A activity has been relatively moderate, with deal values averaging xx Million per transaction over the historical period. Strategic partnerships and collaborations are increasingly becoming favored over outright acquisitions to gain access to niche technologies or expand into new markets.
- Market Share Distribution: Top 5 players account for approximately xx% of the global market.
- M&A Deal Value (2019-2024): Averaged xx Million per transaction.
- Key Growth Drivers: Technological advancements, increasing demand for quality control and failure analysis, stringent regulatory standards in certain industries.
Industrial CT Scanning Industry Industry Evolution
The Industrial CT Scanning industry has witnessed significant growth over the past decade, driven by technological advancements and increasing demand across diverse end-user industries. From 2019 to 2024, the market experienced a Compound Annual Growth Rate (CAGR) of xx%, reaching xx Million in 2024. This growth is projected to continue, with a forecasted CAGR of xx% from 2025 to 2033. Technological advancements, such as the development of higher-energy systems capable of scanning larger and denser components, are key drivers. The shift towards higher resolution imaging and faster scan times further enhances productivity and reduces downtime. Growing consumer demand for higher-quality products and stringent quality control requirements across diverse sectors are pushing the adoption of industrial CT scanning solutions. Improved data analytics capabilities are facilitating more efficient defect detection and process optimization. This trend is expected to accelerate the market's growth trajectory in the coming years.
Leading Regions, Countries, or Segments in Industrial CT Scanning Industry
The Aerospace and Automotive sectors are currently the leading end-user industries, driven by rigorous quality control standards and the need for intricate component inspection. Within application segments, Flaw Detection and Inspection holds the largest market share, due to its wide applicability across various industries.
- Key Drivers (Aerospace): Stringent safety regulations, increasing demand for lightweight and high-performance components.
- Key Drivers (Automotive): Growing vehicle production, rising demand for enhanced vehicle safety and performance.
- Key Drivers (Flaw Detection and Inspection): Growing awareness of product quality, demand for higher productivity and lower failure rates.
The dominance of these segments is attributed to factors such as high investment in R&D, stringent regulatory standards, and the substantial cost of defects in these sectors. The North American and European regions are currently the largest markets, while the Asia-Pacific region is expected to witness significant growth in the forecast period due to rapid industrialization and increasing manufacturing activity.
Industrial CT Scanning Industry Product Innovations
Recent innovations focus on enhancing scanning speed, resolution, and penetration capabilities. High-energy CT systems, such as Waygate Technologies' Phoenix Power|scan HE, allow for the inspection of significantly larger and denser components. Micro-CT systems, like the ZEISS Xradia CrystalCT, enable 3D crystallographic imaging, opening new avenues for material science research and advanced component analysis. These advancements deliver improved accuracy, efficiency, and expand the applications of industrial CT scanning.
Propelling Factors for Industrial CT Scanning Industry Growth
Several factors drive the growth of the Industrial CT Scanning market. Technological advancements, including higher energy systems and improved software algorithms, are improving both the speed and quality of scans. The increasing demand for quality control and non-destructive testing across various industries, especially in sectors with stringent safety regulations (aerospace, automotive), contributes significantly. Government regulations and industry standards promoting advanced inspection techniques also fuel growth. Economic factors such as increased manufacturing output in developing economies further stimulate demand.
Obstacles in the Industrial CT Scanning Industry Market
The high initial investment cost of industrial CT scanners can be a barrier to entry for smaller companies. Supply chain disruptions, particularly regarding specialized components and materials, can impact production and delivery timelines. Intense competition among established players and the emergence of new technologies can create pricing pressures and affect profit margins.
Future Opportunities in Industrial CT Scanning Industry
Emerging opportunities lie in the expansion into new applications, such as additive manufacturing quality control and the development of advanced materials. Integrating AI and machine learning into data analysis workflows promises to automate defect identification and improve process optimization. The development of portable and more cost-effective CT systems will open up new market segments.
Major Players in the Industrial CT Scanning Industry Ecosystem
- Comet Group Limited
- Nikon Corporation
- Thermo Fisher Scientific Inc
- Hitachi Ltd
- 3DX-Ray Limited
- Zeiss International
- Omron Corporation
- Waygate Technologies
- Bruker Corporation
- Shimadzu Corporation
Key Developments in Industrial CT Scanning Industry Industry
- December 2020: Waygate Technologies launched the Phoenix Power|scan HE, a high-energy CT system with significantly increased penetration capabilities, expanding the range of inspectable components.
- March 2021: ZEISS introduced the ZEISS Xradia CrystalCT micro-CT system, enabling 3D crystallographic imaging, advancing materials science research and analysis. These developments showcase ongoing innovation within the industry, pushing technological boundaries and broadening application possibilities.
Strategic Industrial CT Scanning Industry Market Forecast
The Industrial CT Scanning market is poised for sustained growth, driven by ongoing technological advancements, increasing demand across diverse sectors, and favorable regulatory environments. New applications, such as additive manufacturing quality control and advanced materials analysis, present significant growth opportunities. The integration of AI and machine learning into data analysis workflows will further enhance efficiency and accuracy, fueling market expansion in the coming years. The market's future is bright, promising considerable returns for stakeholders who capitalize on these emerging trends.
Industrial CT Scanning Industry Segmentation
-
1. Application
- 1.1. Flaw Detection and Inspection
- 1.2. Failure Analysis
- 1.3. Assembly Analysis
- 1.4. Other Applications
-
2. End-user Industry
- 2.1. Aerospace and Defense
- 2.2. Automotive
- 2.3. Electronics
- 2.4. Oil and Gas
- 2.5. Other End-user Industries
Industrial CT Scanning Industry Segmentation By Geography
- 1. North America
- 2. Europe
- 3. Asia
- 4. Australia and New Zealand
- 5. Latin America
- 6. Middle East and Africa
Industrial CT Scanning Industry REPORT HIGHLIGHTS
| Aspects | Details |
|---|---|
| Study Period | 2019-2033 |
| Base Year | 2024 |
| Estimated Year | 2025 |
| Forecast Period | 2025-2033 |
| Historical Period | 2019-2024 |
| Growth Rate | CAGR of 9.03% from 2019-2033 |
| Segmentation |
|
Table of Contents
- 1. Introduction
- 1.1. Research Scope
- 1.2. Market Segmentation
- 1.3. Research Methodology
- 1.4. Definitions and Assumptions
- 2. Executive Summary
- 2.1. Introduction
- 3. Market Dynamics
- 3.1. Introduction
- 3.2. Market Drivers
- 3.2.1. Technology Improvements in Resolution and Image Processing; Intensifying Demand for Portable Radiography Equipment
- 3.3. Market Restrains
- 3.3.1. High Acquisition and Maintenace Cost of Industrial CT systems
- 3.4. Market Trends
- 3.4.1. Aerospace Industry to Drive the Industrial Computed Tomography Market
- 4. Market Factor Analysis
- 4.1. Porters Five Forces
- 4.2. Supply/Value Chain
- 4.3. PESTEL analysis
- 4.4. Market Entropy
- 4.5. Patent/Trademark Analysis
- 5. Global Industrial CT Scanning Industry Analysis, Insights and Forecast, 2019-2031
- 5.1. Market Analysis, Insights and Forecast - by Application
- 5.1.1. Flaw Detection and Inspection
- 5.1.2. Failure Analysis
- 5.1.3. Assembly Analysis
- 5.1.4. Other Applications
- 5.2. Market Analysis, Insights and Forecast - by End-user Industry
- 5.2.1. Aerospace and Defense
- 5.2.2. Automotive
- 5.2.3. Electronics
- 5.2.4. Oil and Gas
- 5.2.5. Other End-user Industries
- 5.3. Market Analysis, Insights and Forecast - by Region
- 5.3.1. North America
- 5.3.2. Europe
- 5.3.3. Asia
- 5.3.4. Australia and New Zealand
- 5.3.5. Latin America
- 5.3.6. Middle East and Africa
- 5.1. Market Analysis, Insights and Forecast - by Application
- 6. North America Industrial CT Scanning Industry Analysis, Insights and Forecast, 2019-2031
- 6.1. Market Analysis, Insights and Forecast - by Application
- 6.1.1. Flaw Detection and Inspection
- 6.1.2. Failure Analysis
- 6.1.3. Assembly Analysis
- 6.1.4. Other Applications
- 6.2. Market Analysis, Insights and Forecast - by End-user Industry
- 6.2.1. Aerospace and Defense
- 6.2.2. Automotive
- 6.2.3. Electronics
- 6.2.4. Oil and Gas
- 6.2.5. Other End-user Industries
- 6.1. Market Analysis, Insights and Forecast - by Application
- 7. Europe Industrial CT Scanning Industry Analysis, Insights and Forecast, 2019-2031
- 7.1. Market Analysis, Insights and Forecast - by Application
- 7.1.1. Flaw Detection and Inspection
- 7.1.2. Failure Analysis
- 7.1.3. Assembly Analysis
- 7.1.4. Other Applications
- 7.2. Market Analysis, Insights and Forecast - by End-user Industry
- 7.2.1. Aerospace and Defense
- 7.2.2. Automotive
- 7.2.3. Electronics
- 7.2.4. Oil and Gas
- 7.2.5. Other End-user Industries
- 7.1. Market Analysis, Insights and Forecast - by Application
- 8. Asia Industrial CT Scanning Industry Analysis, Insights and Forecast, 2019-2031
- 8.1. Market Analysis, Insights and Forecast - by Application
- 8.1.1. Flaw Detection and Inspection
- 8.1.2. Failure Analysis
- 8.1.3. Assembly Analysis
- 8.1.4. Other Applications
- 8.2. Market Analysis, Insights and Forecast - by End-user Industry
- 8.2.1. Aerospace and Defense
- 8.2.2. Automotive
- 8.2.3. Electronics
- 8.2.4. Oil and Gas
- 8.2.5. Other End-user Industries
- 8.1. Market Analysis, Insights and Forecast - by Application
- 9. Australia and New Zealand Industrial CT Scanning Industry Analysis, Insights and Forecast, 2019-2031
- 9.1. Market Analysis, Insights and Forecast - by Application
- 9.1.1. Flaw Detection and Inspection
- 9.1.2. Failure Analysis
- 9.1.3. Assembly Analysis
- 9.1.4. Other Applications
- 9.2. Market Analysis, Insights and Forecast - by End-user Industry
- 9.2.1. Aerospace and Defense
- 9.2.2. Automotive
- 9.2.3. Electronics
- 9.2.4. Oil and Gas
- 9.2.5. Other End-user Industries
- 9.1. Market Analysis, Insights and Forecast - by Application
- 10. Latin America Industrial CT Scanning Industry Analysis, Insights and Forecast, 2019-2031
- 10.1. Market Analysis, Insights and Forecast - by Application
- 10.1.1. Flaw Detection and Inspection
- 10.1.2. Failure Analysis
- 10.1.3. Assembly Analysis
- 10.1.4. Other Applications
- 10.2. Market Analysis, Insights and Forecast - by End-user Industry
- 10.2.1. Aerospace and Defense
- 10.2.2. Automotive
- 10.2.3. Electronics
- 10.2.4. Oil and Gas
- 10.2.5. Other End-user Industries
- 10.1. Market Analysis, Insights and Forecast - by Application
- 11. Middle East and Africa Industrial CT Scanning Industry Analysis, Insights and Forecast, 2019-2031
- 11.1. Market Analysis, Insights and Forecast - by Application
- 11.1.1. Flaw Detection and Inspection
- 11.1.2. Failure Analysis
- 11.1.3. Assembly Analysis
- 11.1.4. Other Applications
- 11.2. Market Analysis, Insights and Forecast - by End-user Industry
- 11.2.1. Aerospace and Defense
- 11.2.2. Automotive
- 11.2.3. Electronics
- 11.2.4. Oil and Gas
- 11.2.5. Other End-user Industries
- 11.1. Market Analysis, Insights and Forecast - by Application
- 12. North America Industrial CT Scanning Industry Analysis, Insights and Forecast, 2019-2031
- 12.1. Market Analysis, Insights and Forecast - By Country/Sub-region
- 12.1.1 United States
- 12.1.2 Canada
- 12.1.3 Mexico
- 13. Europe Industrial CT Scanning Industry Analysis, Insights and Forecast, 2019-2031
- 13.1. Market Analysis, Insights and Forecast - By Country/Sub-region
- 13.1.1 Germany
- 13.1.2 United Kingdom
- 13.1.3 France
- 13.1.4 Spain
- 13.1.5 Italy
- 13.1.6 Spain
- 13.1.7 Belgium
- 13.1.8 Netherland
- 13.1.9 Nordics
- 13.1.10 Rest of Europe
- 14. Asia Pacific Industrial CT Scanning Industry Analysis, Insights and Forecast, 2019-2031
- 14.1. Market Analysis, Insights and Forecast - By Country/Sub-region
- 14.1.1 China
- 14.1.2 Japan
- 14.1.3 India
- 14.1.4 South Korea
- 14.1.5 Southeast Asia
- 14.1.6 Australia
- 14.1.7 Indonesia
- 14.1.8 Phillipes
- 14.1.9 Singapore
- 14.1.10 Thailandc
- 14.1.11 Rest of Asia Pacific
- 15. South America Industrial CT Scanning Industry Analysis, Insights and Forecast, 2019-2031
- 15.1. Market Analysis, Insights and Forecast - By Country/Sub-region
- 15.1.1 Brazil
- 15.1.2 Argentina
- 15.1.3 Peru
- 15.1.4 Chile
- 15.1.5 Colombia
- 15.1.6 Ecuador
- 15.1.7 Venezuela
- 15.1.8 Rest of South America
- 16. North America Industrial CT Scanning Industry Analysis, Insights and Forecast, 2019-2031
- 16.1. Market Analysis, Insights and Forecast - By Country/Sub-region
- 16.1.1 United States
- 16.1.2 Canada
- 16.1.3 Mexico
- 17. MEA Industrial CT Scanning Industry Analysis, Insights and Forecast, 2019-2031
- 17.1. Market Analysis, Insights and Forecast - By Country/Sub-region
- 17.1.1 United Arab Emirates
- 17.1.2 Saudi Arabia
- 17.1.3 South Africa
- 17.1.4 Rest of Middle East and Africa
- 18. Competitive Analysis
- 18.1. Global Market Share Analysis 2024
- 18.2. Company Profiles
- 18.2.1 Comet Group Limited
- 18.2.1.1. Overview
- 18.2.1.2. Products
- 18.2.1.3. SWOT Analysis
- 18.2.1.4. Recent Developments
- 18.2.1.5. Financials (Based on Availability)
- 18.2.2 Nikon Corporation
- 18.2.2.1. Overview
- 18.2.2.2. Products
- 18.2.2.3. SWOT Analysis
- 18.2.2.4. Recent Developments
- 18.2.2.5. Financials (Based on Availability)
- 18.2.3 Thermo Fisher Scientific Inc
- 18.2.3.1. Overview
- 18.2.3.2. Products
- 18.2.3.3. SWOT Analysis
- 18.2.3.4. Recent Developments
- 18.2.3.5. Financials (Based on Availability)
- 18.2.4 Hitachi Ltd
- 18.2.4.1. Overview
- 18.2.4.2. Products
- 18.2.4.3. SWOT Analysis
- 18.2.4.4. Recent Developments
- 18.2.4.5. Financials (Based on Availability)
- 18.2.5 3DX-Ray Limited
- 18.2.5.1. Overview
- 18.2.5.2. Products
- 18.2.5.3. SWOT Analysis
- 18.2.5.4. Recent Developments
- 18.2.5.5. Financials (Based on Availability)
- 18.2.6 Zeiss International
- 18.2.6.1. Overview
- 18.2.6.2. Products
- 18.2.6.3. SWOT Analysis
- 18.2.6.4. Recent Developments
- 18.2.6.5. Financials (Based on Availability)
- 18.2.7 Omron Corporation
- 18.2.7.1. Overview
- 18.2.7.2. Products
- 18.2.7.3. SWOT Analysis
- 18.2.7.4. Recent Developments
- 18.2.7.5. Financials (Based on Availability)
- 18.2.8 Waygate Technologies
- 18.2.8.1. Overview
- 18.2.8.2. Products
- 18.2.8.3. SWOT Analysis
- 18.2.8.4. Recent Developments
- 18.2.8.5. Financials (Based on Availability)
- 18.2.9 Bruker Corporation
- 18.2.9.1. Overview
- 18.2.9.2. Products
- 18.2.9.3. SWOT Analysis
- 18.2.9.4. Recent Developments
- 18.2.9.5. Financials (Based on Availability)
- 18.2.10 Shimadzu Corporation
- 18.2.10.1. Overview
- 18.2.10.2. Products
- 18.2.10.3. SWOT Analysis
- 18.2.10.4. Recent Developments
- 18.2.10.5. Financials (Based on Availability)
- 18.2.1 Comet Group Limited
List of Figures
- Figure 1: Global Industrial CT Scanning Industry Revenue Breakdown (Million, %) by Region 2024 & 2032
- Figure 2: Global Industrial CT Scanning Industry Volume Breakdown (K Unit, %) by Region 2024 & 2032
- Figure 3: North America Industrial CT Scanning Industry Revenue (Million), by Country 2024 & 2032
- Figure 4: North America Industrial CT Scanning Industry Volume (K Unit), by Country 2024 & 2032
- Figure 5: North America Industrial CT Scanning Industry Revenue Share (%), by Country 2024 & 2032
- Figure 6: North America Industrial CT Scanning Industry Volume Share (%), by Country 2024 & 2032
- Figure 7: Europe Industrial CT Scanning Industry Revenue (Million), by Country 2024 & 2032
- Figure 8: Europe Industrial CT Scanning Industry Volume (K Unit), by Country 2024 & 2032
- Figure 9: Europe Industrial CT Scanning Industry Revenue Share (%), by Country 2024 & 2032
- Figure 10: Europe Industrial CT Scanning Industry Volume Share (%), by Country 2024 & 2032
- Figure 11: Asia Pacific Industrial CT Scanning Industry Revenue (Million), by Country 2024 & 2032
- Figure 12: Asia Pacific Industrial CT Scanning Industry Volume (K Unit), by Country 2024 & 2032
- Figure 13: Asia Pacific Industrial CT Scanning Industry Revenue Share (%), by Country 2024 & 2032
- Figure 14: Asia Pacific Industrial CT Scanning Industry Volume Share (%), by Country 2024 & 2032
- Figure 15: South America Industrial CT Scanning Industry Revenue (Million), by Country 2024 & 2032
- Figure 16: South America Industrial CT Scanning Industry Volume (K Unit), by Country 2024 & 2032
- Figure 17: South America Industrial CT Scanning Industry Revenue Share (%), by Country 2024 & 2032
- Figure 18: South America Industrial CT Scanning Industry Volume Share (%), by Country 2024 & 2032
- Figure 19: North America Industrial CT Scanning Industry Revenue (Million), by Country 2024 & 2032
- Figure 20: North America Industrial CT Scanning Industry Volume (K Unit), by Country 2024 & 2032
- Figure 21: North America Industrial CT Scanning Industry Revenue Share (%), by Country 2024 & 2032
- Figure 22: North America Industrial CT Scanning Industry Volume Share (%), by Country 2024 & 2032
- Figure 23: MEA Industrial CT Scanning Industry Revenue (Million), by Country 2024 & 2032
- Figure 24: MEA Industrial CT Scanning Industry Volume (K Unit), by Country 2024 & 2032
- Figure 25: MEA Industrial CT Scanning Industry Revenue Share (%), by Country 2024 & 2032
- Figure 26: MEA Industrial CT Scanning Industry Volume Share (%), by Country 2024 & 2032
- Figure 27: North America Industrial CT Scanning Industry Revenue (Million), by Application 2024 & 2032
- Figure 28: North America Industrial CT Scanning Industry Volume (K Unit), by Application 2024 & 2032
- Figure 29: North America Industrial CT Scanning Industry Revenue Share (%), by Application 2024 & 2032
- Figure 30: North America Industrial CT Scanning Industry Volume Share (%), by Application 2024 & 2032
- Figure 31: North America Industrial CT Scanning Industry Revenue (Million), by End-user Industry 2024 & 2032
- Figure 32: North America Industrial CT Scanning Industry Volume (K Unit), by End-user Industry 2024 & 2032
- Figure 33: North America Industrial CT Scanning Industry Revenue Share (%), by End-user Industry 2024 & 2032
- Figure 34: North America Industrial CT Scanning Industry Volume Share (%), by End-user Industry 2024 & 2032
- Figure 35: North America Industrial CT Scanning Industry Revenue (Million), by Country 2024 & 2032
- Figure 36: North America Industrial CT Scanning Industry Volume (K Unit), by Country 2024 & 2032
- Figure 37: North America Industrial CT Scanning Industry Revenue Share (%), by Country 2024 & 2032
- Figure 38: North America Industrial CT Scanning Industry Volume Share (%), by Country 2024 & 2032
- Figure 39: Europe Industrial CT Scanning Industry Revenue (Million), by Application 2024 & 2032
- Figure 40: Europe Industrial CT Scanning Industry Volume (K Unit), by Application 2024 & 2032
- Figure 41: Europe Industrial CT Scanning Industry Revenue Share (%), by Application 2024 & 2032
- Figure 42: Europe Industrial CT Scanning Industry Volume Share (%), by Application 2024 & 2032
- Figure 43: Europe Industrial CT Scanning Industry Revenue (Million), by End-user Industry 2024 & 2032
- Figure 44: Europe Industrial CT Scanning Industry Volume (K Unit), by End-user Industry 2024 & 2032
- Figure 45: Europe Industrial CT Scanning Industry Revenue Share (%), by End-user Industry 2024 & 2032
- Figure 46: Europe Industrial CT Scanning Industry Volume Share (%), by End-user Industry 2024 & 2032
- Figure 47: Europe Industrial CT Scanning Industry Revenue (Million), by Country 2024 & 2032
- Figure 48: Europe Industrial CT Scanning Industry Volume (K Unit), by Country 2024 & 2032
- Figure 49: Europe Industrial CT Scanning Industry Revenue Share (%), by Country 2024 & 2032
- Figure 50: Europe Industrial CT Scanning Industry Volume Share (%), by Country 2024 & 2032
- Figure 51: Asia Industrial CT Scanning Industry Revenue (Million), by Application 2024 & 2032
- Figure 52: Asia Industrial CT Scanning Industry Volume (K Unit), by Application 2024 & 2032
- Figure 53: Asia Industrial CT Scanning Industry Revenue Share (%), by Application 2024 & 2032
- Figure 54: Asia Industrial CT Scanning Industry Volume Share (%), by Application 2024 & 2032
- Figure 55: Asia Industrial CT Scanning Industry Revenue (Million), by End-user Industry 2024 & 2032
- Figure 56: Asia Industrial CT Scanning Industry Volume (K Unit), by End-user Industry 2024 & 2032
- Figure 57: Asia Industrial CT Scanning Industry Revenue Share (%), by End-user Industry 2024 & 2032
- Figure 58: Asia Industrial CT Scanning Industry Volume Share (%), by End-user Industry 2024 & 2032
- Figure 59: Asia Industrial CT Scanning Industry Revenue (Million), by Country 2024 & 2032
- Figure 60: Asia Industrial CT Scanning Industry Volume (K Unit), by Country 2024 & 2032
- Figure 61: Asia Industrial CT Scanning Industry Revenue Share (%), by Country 2024 & 2032
- Figure 62: Asia Industrial CT Scanning Industry Volume Share (%), by Country 2024 & 2032
- Figure 63: Australia and New Zealand Industrial CT Scanning Industry Revenue (Million), by Application 2024 & 2032
- Figure 64: Australia and New Zealand Industrial CT Scanning Industry Volume (K Unit), by Application 2024 & 2032
- Figure 65: Australia and New Zealand Industrial CT Scanning Industry Revenue Share (%), by Application 2024 & 2032
- Figure 66: Australia and New Zealand Industrial CT Scanning Industry Volume Share (%), by Application 2024 & 2032
- Figure 67: Australia and New Zealand Industrial CT Scanning Industry Revenue (Million), by End-user Industry 2024 & 2032
- Figure 68: Australia and New Zealand Industrial CT Scanning Industry Volume (K Unit), by End-user Industry 2024 & 2032
- Figure 69: Australia and New Zealand Industrial CT Scanning Industry Revenue Share (%), by End-user Industry 2024 & 2032
- Figure 70: Australia and New Zealand Industrial CT Scanning Industry Volume Share (%), by End-user Industry 2024 & 2032
- Figure 71: Australia and New Zealand Industrial CT Scanning Industry Revenue (Million), by Country 2024 & 2032
- Figure 72: Australia and New Zealand Industrial CT Scanning Industry Volume (K Unit), by Country 2024 & 2032
- Figure 73: Australia and New Zealand Industrial CT Scanning Industry Revenue Share (%), by Country 2024 & 2032
- Figure 74: Australia and New Zealand Industrial CT Scanning Industry Volume Share (%), by Country 2024 & 2032
- Figure 75: Latin America Industrial CT Scanning Industry Revenue (Million), by Application 2024 & 2032
- Figure 76: Latin America Industrial CT Scanning Industry Volume (K Unit), by Application 2024 & 2032
- Figure 77: Latin America Industrial CT Scanning Industry Revenue Share (%), by Application 2024 & 2032
- Figure 78: Latin America Industrial CT Scanning Industry Volume Share (%), by Application 2024 & 2032
- Figure 79: Latin America Industrial CT Scanning Industry Revenue (Million), by End-user Industry 2024 & 2032
- Figure 80: Latin America Industrial CT Scanning Industry Volume (K Unit), by End-user Industry 2024 & 2032
- Figure 81: Latin America Industrial CT Scanning Industry Revenue Share (%), by End-user Industry 2024 & 2032
- Figure 82: Latin America Industrial CT Scanning Industry Volume Share (%), by End-user Industry 2024 & 2032
- Figure 83: Latin America Industrial CT Scanning Industry Revenue (Million), by Country 2024 & 2032
- Figure 84: Latin America Industrial CT Scanning Industry Volume (K Unit), by Country 2024 & 2032
- Figure 85: Latin America Industrial CT Scanning Industry Revenue Share (%), by Country 2024 & 2032
- Figure 86: Latin America Industrial CT Scanning Industry Volume Share (%), by Country 2024 & 2032
- Figure 87: Middle East and Africa Industrial CT Scanning Industry Revenue (Million), by Application 2024 & 2032
- Figure 88: Middle East and Africa Industrial CT Scanning Industry Volume (K Unit), by Application 2024 & 2032
- Figure 89: Middle East and Africa Industrial CT Scanning Industry Revenue Share (%), by Application 2024 & 2032
- Figure 90: Middle East and Africa Industrial CT Scanning Industry Volume Share (%), by Application 2024 & 2032
- Figure 91: Middle East and Africa Industrial CT Scanning Industry Revenue (Million), by End-user Industry 2024 & 2032
- Figure 92: Middle East and Africa Industrial CT Scanning Industry Volume (K Unit), by End-user Industry 2024 & 2032
- Figure 93: Middle East and Africa Industrial CT Scanning Industry Revenue Share (%), by End-user Industry 2024 & 2032
- Figure 94: Middle East and Africa Industrial CT Scanning Industry Volume Share (%), by End-user Industry 2024 & 2032
- Figure 95: Middle East and Africa Industrial CT Scanning Industry Revenue (Million), by Country 2024 & 2032
- Figure 96: Middle East and Africa Industrial CT Scanning Industry Volume (K Unit), by Country 2024 & 2032
- Figure 97: Middle East and Africa Industrial CT Scanning Industry Revenue Share (%), by Country 2024 & 2032
- Figure 98: Middle East and Africa Industrial CT Scanning Industry Volume Share (%), by Country 2024 & 2032
List of Tables
- Table 1: Global Industrial CT Scanning Industry Revenue Million Forecast, by Region 2019 & 2032
- Table 2: Global Industrial CT Scanning Industry Volume K Unit Forecast, by Region 2019 & 2032
- Table 3: Global Industrial CT Scanning Industry Revenue Million Forecast, by Application 2019 & 2032
- Table 4: Global Industrial CT Scanning Industry Volume K Unit Forecast, by Application 2019 & 2032
- Table 5: Global Industrial CT Scanning Industry Revenue Million Forecast, by End-user Industry 2019 & 2032
- Table 6: Global Industrial CT Scanning Industry Volume K Unit Forecast, by End-user Industry 2019 & 2032
- Table 7: Global Industrial CT Scanning Industry Revenue Million Forecast, by Region 2019 & 2032
- Table 8: Global Industrial CT Scanning Industry Volume K Unit Forecast, by Region 2019 & 2032
- Table 9: Global Industrial CT Scanning Industry Revenue Million Forecast, by Country 2019 & 2032
- Table 10: Global Industrial CT Scanning Industry Volume K Unit Forecast, by Country 2019 & 2032
- Table 11: United States Industrial CT Scanning Industry Revenue (Million) Forecast, by Application 2019 & 2032
- Table 12: United States Industrial CT Scanning Industry Volume (K Unit) Forecast, by Application 2019 & 2032
- Table 13: Canada Industrial CT Scanning Industry Revenue (Million) Forecast, by Application 2019 & 2032
- Table 14: Canada Industrial CT Scanning Industry Volume (K Unit) Forecast, by Application 2019 & 2032
- Table 15: Mexico Industrial CT Scanning Industry Revenue (Million) Forecast, by Application 2019 & 2032
- Table 16: Mexico Industrial CT Scanning Industry Volume (K Unit) Forecast, by Application 2019 & 2032
- Table 17: Global Industrial CT Scanning Industry Revenue Million Forecast, by Country 2019 & 2032
- Table 18: Global Industrial CT Scanning Industry Volume K Unit Forecast, by Country 2019 & 2032
- Table 19: Germany Industrial CT Scanning Industry Revenue (Million) Forecast, by Application 2019 & 2032
- Table 20: Germany Industrial CT Scanning Industry Volume (K Unit) Forecast, by Application 2019 & 2032
- Table 21: United Kingdom Industrial CT Scanning Industry Revenue (Million) Forecast, by Application 2019 & 2032
- Table 22: United Kingdom Industrial CT Scanning Industry Volume (K Unit) Forecast, by Application 2019 & 2032
- Table 23: France Industrial CT Scanning Industry Revenue (Million) Forecast, by Application 2019 & 2032
- Table 24: France Industrial CT Scanning Industry Volume (K Unit) Forecast, by Application 2019 & 2032
- Table 25: Spain Industrial CT Scanning Industry Revenue (Million) Forecast, by Application 2019 & 2032
- Table 26: Spain Industrial CT Scanning Industry Volume (K Unit) Forecast, by Application 2019 & 2032
- Table 27: Italy Industrial CT Scanning Industry Revenue (Million) Forecast, by Application 2019 & 2032
- Table 28: Italy Industrial CT Scanning Industry Volume (K Unit) Forecast, by Application 2019 & 2032
- Table 29: Spain Industrial CT Scanning Industry Revenue (Million) Forecast, by Application 2019 & 2032
- Table 30: Spain Industrial CT Scanning Industry Volume (K Unit) Forecast, by Application 2019 & 2032
- Table 31: Belgium Industrial CT Scanning Industry Revenue (Million) Forecast, by Application 2019 & 2032
- Table 32: Belgium Industrial CT Scanning Industry Volume (K Unit) Forecast, by Application 2019 & 2032
- Table 33: Netherland Industrial CT Scanning Industry Revenue (Million) Forecast, by Application 2019 & 2032
- Table 34: Netherland Industrial CT Scanning Industry Volume (K Unit) Forecast, by Application 2019 & 2032
- Table 35: Nordics Industrial CT Scanning Industry Revenue (Million) Forecast, by Application 2019 & 2032
- Table 36: Nordics Industrial CT Scanning Industry Volume (K Unit) Forecast, by Application 2019 & 2032
- Table 37: Rest of Europe Industrial CT Scanning Industry Revenue (Million) Forecast, by Application 2019 & 2032
- Table 38: Rest of Europe Industrial CT Scanning Industry Volume (K Unit) Forecast, by Application 2019 & 2032
- Table 39: Global Industrial CT Scanning Industry Revenue Million Forecast, by Country 2019 & 2032
- Table 40: Global Industrial CT Scanning Industry Volume K Unit Forecast, by Country 2019 & 2032
- Table 41: China Industrial CT Scanning Industry Revenue (Million) Forecast, by Application 2019 & 2032
- Table 42: China Industrial CT Scanning Industry Volume (K Unit) Forecast, by Application 2019 & 2032
- Table 43: Japan Industrial CT Scanning Industry Revenue (Million) Forecast, by Application 2019 & 2032
- Table 44: Japan Industrial CT Scanning Industry Volume (K Unit) Forecast, by Application 2019 & 2032
- Table 45: India Industrial CT Scanning Industry Revenue (Million) Forecast, by Application 2019 & 2032
- Table 46: India Industrial CT Scanning Industry Volume (K Unit) Forecast, by Application 2019 & 2032
- Table 47: South Korea Industrial CT Scanning Industry Revenue (Million) Forecast, by Application 2019 & 2032
- Table 48: South Korea Industrial CT Scanning Industry Volume (K Unit) Forecast, by Application 2019 & 2032
- Table 49: Southeast Asia Industrial CT Scanning Industry Revenue (Million) Forecast, by Application 2019 & 2032
- Table 50: Southeast Asia Industrial CT Scanning Industry Volume (K Unit) Forecast, by Application 2019 & 2032
- Table 51: Australia Industrial CT Scanning Industry Revenue (Million) Forecast, by Application 2019 & 2032
- Table 52: Australia Industrial CT Scanning Industry Volume (K Unit) Forecast, by Application 2019 & 2032
- Table 53: Indonesia Industrial CT Scanning Industry Revenue (Million) Forecast, by Application 2019 & 2032
- Table 54: Indonesia Industrial CT Scanning Industry Volume (K Unit) Forecast, by Application 2019 & 2032
- Table 55: Phillipes Industrial CT Scanning Industry Revenue (Million) Forecast, by Application 2019 & 2032
- Table 56: Phillipes Industrial CT Scanning Industry Volume (K Unit) Forecast, by Application 2019 & 2032
- Table 57: Singapore Industrial CT Scanning Industry Revenue (Million) Forecast, by Application 2019 & 2032
- Table 58: Singapore Industrial CT Scanning Industry Volume (K Unit) Forecast, by Application 2019 & 2032
- Table 59: Thailandc Industrial CT Scanning Industry Revenue (Million) Forecast, by Application 2019 & 2032
- Table 60: Thailandc Industrial CT Scanning Industry Volume (K Unit) Forecast, by Application 2019 & 2032
- Table 61: Rest of Asia Pacific Industrial CT Scanning Industry Revenue (Million) Forecast, by Application 2019 & 2032
- Table 62: Rest of Asia Pacific Industrial CT Scanning Industry Volume (K Unit) Forecast, by Application 2019 & 2032
- Table 63: Global Industrial CT Scanning Industry Revenue Million Forecast, by Country 2019 & 2032
- Table 64: Global Industrial CT Scanning Industry Volume K Unit Forecast, by Country 2019 & 2032
- Table 65: Brazil Industrial CT Scanning Industry Revenue (Million) Forecast, by Application 2019 & 2032
- Table 66: Brazil Industrial CT Scanning Industry Volume (K Unit) Forecast, by Application 2019 & 2032
- Table 67: Argentina Industrial CT Scanning Industry Revenue (Million) Forecast, by Application 2019 & 2032
- Table 68: Argentina Industrial CT Scanning Industry Volume (K Unit) Forecast, by Application 2019 & 2032
- Table 69: Peru Industrial CT Scanning Industry Revenue (Million) Forecast, by Application 2019 & 2032
- Table 70: Peru Industrial CT Scanning Industry Volume (K Unit) Forecast, by Application 2019 & 2032
- Table 71: Chile Industrial CT Scanning Industry Revenue (Million) Forecast, by Application 2019 & 2032
- Table 72: Chile Industrial CT Scanning Industry Volume (K Unit) Forecast, by Application 2019 & 2032
- Table 73: Colombia Industrial CT Scanning Industry Revenue (Million) Forecast, by Application 2019 & 2032
- Table 74: Colombia Industrial CT Scanning Industry Volume (K Unit) Forecast, by Application 2019 & 2032
- Table 75: Ecuador Industrial CT Scanning Industry Revenue (Million) Forecast, by Application 2019 & 2032
- Table 76: Ecuador Industrial CT Scanning Industry Volume (K Unit) Forecast, by Application 2019 & 2032
- Table 77: Venezuela Industrial CT Scanning Industry Revenue (Million) Forecast, by Application 2019 & 2032
- Table 78: Venezuela Industrial CT Scanning Industry Volume (K Unit) Forecast, by Application 2019 & 2032
- Table 79: Rest of South America Industrial CT Scanning Industry Revenue (Million) Forecast, by Application 2019 & 2032
- Table 80: Rest of South America Industrial CT Scanning Industry Volume (K Unit) Forecast, by Application 2019 & 2032
- Table 81: Global Industrial CT Scanning Industry Revenue Million Forecast, by Country 2019 & 2032
- Table 82: Global Industrial CT Scanning Industry Volume K Unit Forecast, by Country 2019 & 2032
- Table 83: United States Industrial CT Scanning Industry Revenue (Million) Forecast, by Application 2019 & 2032
- Table 84: United States Industrial CT Scanning Industry Volume (K Unit) Forecast, by Application 2019 & 2032
- Table 85: Canada Industrial CT Scanning Industry Revenue (Million) Forecast, by Application 2019 & 2032
- Table 86: Canada Industrial CT Scanning Industry Volume (K Unit) Forecast, by Application 2019 & 2032
- Table 87: Mexico Industrial CT Scanning Industry Revenue (Million) Forecast, by Application 2019 & 2032
- Table 88: Mexico Industrial CT Scanning Industry Volume (K Unit) Forecast, by Application 2019 & 2032
- Table 89: Global Industrial CT Scanning Industry Revenue Million Forecast, by Country 2019 & 2032
- Table 90: Global Industrial CT Scanning Industry Volume K Unit Forecast, by Country 2019 & 2032
- Table 91: United Arab Emirates Industrial CT Scanning Industry Revenue (Million) Forecast, by Application 2019 & 2032
- Table 92: United Arab Emirates Industrial CT Scanning Industry Volume (K Unit) Forecast, by Application 2019 & 2032
- Table 93: Saudi Arabia Industrial CT Scanning Industry Revenue (Million) Forecast, by Application 2019 & 2032
- Table 94: Saudi Arabia Industrial CT Scanning Industry Volume (K Unit) Forecast, by Application 2019 & 2032
- Table 95: South Africa Industrial CT Scanning Industry Revenue (Million) Forecast, by Application 2019 & 2032
- Table 96: South Africa Industrial CT Scanning Industry Volume (K Unit) Forecast, by Application 2019 & 2032
- Table 97: Rest of Middle East and Africa Industrial CT Scanning Industry Revenue (Million) Forecast, by Application 2019 & 2032
- Table 98: Rest of Middle East and Africa Industrial CT Scanning Industry Volume (K Unit) Forecast, by Application 2019 & 2032
- Table 99: Global Industrial CT Scanning Industry Revenue Million Forecast, by Application 2019 & 2032
- Table 100: Global Industrial CT Scanning Industry Volume K Unit Forecast, by Application 2019 & 2032
- Table 101: Global Industrial CT Scanning Industry Revenue Million Forecast, by End-user Industry 2019 & 2032
- Table 102: Global Industrial CT Scanning Industry Volume K Unit Forecast, by End-user Industry 2019 & 2032
- Table 103: Global Industrial CT Scanning Industry Revenue Million Forecast, by Country 2019 & 2032
- Table 104: Global Industrial CT Scanning Industry Volume K Unit Forecast, by Country 2019 & 2032
- Table 105: Global Industrial CT Scanning Industry Revenue Million Forecast, by Application 2019 & 2032
- Table 106: Global Industrial CT Scanning Industry Volume K Unit Forecast, by Application 2019 & 2032
- Table 107: Global Industrial CT Scanning Industry Revenue Million Forecast, by End-user Industry 2019 & 2032
- Table 108: Global Industrial CT Scanning Industry Volume K Unit Forecast, by End-user Industry 2019 & 2032
- Table 109: Global Industrial CT Scanning Industry Revenue Million Forecast, by Country 2019 & 2032
- Table 110: Global Industrial CT Scanning Industry Volume K Unit Forecast, by Country 2019 & 2032
- Table 111: Global Industrial CT Scanning Industry Revenue Million Forecast, by Application 2019 & 2032
- Table 112: Global Industrial CT Scanning Industry Volume K Unit Forecast, by Application 2019 & 2032
- Table 113: Global Industrial CT Scanning Industry Revenue Million Forecast, by End-user Industry 2019 & 2032
- Table 114: Global Industrial CT Scanning Industry Volume K Unit Forecast, by End-user Industry 2019 & 2032
- Table 115: Global Industrial CT Scanning Industry Revenue Million Forecast, by Country 2019 & 2032
- Table 116: Global Industrial CT Scanning Industry Volume K Unit Forecast, by Country 2019 & 2032
- Table 117: Global Industrial CT Scanning Industry Revenue Million Forecast, by Application 2019 & 2032
- Table 118: Global Industrial CT Scanning Industry Volume K Unit Forecast, by Application 2019 & 2032
- Table 119: Global Industrial CT Scanning Industry Revenue Million Forecast, by End-user Industry 2019 & 2032
- Table 120: Global Industrial CT Scanning Industry Volume K Unit Forecast, by End-user Industry 2019 & 2032
- Table 121: Global Industrial CT Scanning Industry Revenue Million Forecast, by Country 2019 & 2032
- Table 122: Global Industrial CT Scanning Industry Volume K Unit Forecast, by Country 2019 & 2032
- Table 123: Global Industrial CT Scanning Industry Revenue Million Forecast, by Application 2019 & 2032
- Table 124: Global Industrial CT Scanning Industry Volume K Unit Forecast, by Application 2019 & 2032
- Table 125: Global Industrial CT Scanning Industry Revenue Million Forecast, by End-user Industry 2019 & 2032
- Table 126: Global Industrial CT Scanning Industry Volume K Unit Forecast, by End-user Industry 2019 & 2032
- Table 127: Global Industrial CT Scanning Industry Revenue Million Forecast, by Country 2019 & 2032
- Table 128: Global Industrial CT Scanning Industry Volume K Unit Forecast, by Country 2019 & 2032
- Table 129: Global Industrial CT Scanning Industry Revenue Million Forecast, by Application 2019 & 2032
- Table 130: Global Industrial CT Scanning Industry Volume K Unit Forecast, by Application 2019 & 2032
- Table 131: Global Industrial CT Scanning Industry Revenue Million Forecast, by End-user Industry 2019 & 2032
- Table 132: Global Industrial CT Scanning Industry Volume K Unit Forecast, by End-user Industry 2019 & 2032
- Table 133: Global Industrial CT Scanning Industry Revenue Million Forecast, by Country 2019 & 2032
- Table 134: Global Industrial CT Scanning Industry Volume K Unit Forecast, by Country 2019 & 2032
Frequently Asked Questions
1. What is the projected Compound Annual Growth Rate (CAGR) of the Industrial CT Scanning Industry?
The projected CAGR is approximately 9.03%.
2. Which companies are prominent players in the Industrial CT Scanning Industry?
Key companies in the market include Comet Group Limited, Nikon Corporation, Thermo Fisher Scientific Inc, Hitachi Ltd, 3DX-Ray Limited, Zeiss International, Omron Corporation, Waygate Technologies, Bruker Corporation, Shimadzu Corporation.
3. What are the main segments of the Industrial CT Scanning Industry?
The market segments include Application, End-user Industry.
4. Can you provide details about the market size?
The market size is estimated to be USD 502.00 Million as of 2022.
5. What are some drivers contributing to market growth?
Technology Improvements in Resolution and Image Processing; Intensifying Demand for Portable Radiography Equipment.
6. What are the notable trends driving market growth?
Aerospace Industry to Drive the Industrial Computed Tomography Market.
7. Are there any restraints impacting market growth?
High Acquisition and Maintenace Cost of Industrial CT systems.
8. Can you provide examples of recent developments in the market?
March 2021 - ZEISS introduced ZEISS Xradia CrystalCT micro-computed tomography (microCT) system to enable 3D crystallographic imaging of polycrystalline materials for a wide range of metal and alloy, additive manufacturing, ceramic, and pharmaceutical samples in industrial and academic laboratories.
9. What pricing options are available for accessing the report?
Pricing options include single-user, multi-user, and enterprise licenses priced at USD 4750, USD 5250, and USD 8750 respectively.
10. Is the market size provided in terms of value or volume?
The market size is provided in terms of value, measured in Million and volume, measured in K Unit.
11. Are there any specific market keywords associated with the report?
Yes, the market keyword associated with the report is "Industrial CT Scanning Industry," which aids in identifying and referencing the specific market segment covered.
12. How do I determine which pricing option suits my needs best?
The pricing options vary based on user requirements and access needs. Individual users may opt for single-user licenses, while businesses requiring broader access may choose multi-user or enterprise licenses for cost-effective access to the report.
13. Are there any additional resources or data provided in the Industrial CT Scanning Industry report?
While the report offers comprehensive insights, it's advisable to review the specific contents or supplementary materials provided to ascertain if additional resources or data are available.
14. How can I stay updated on further developments or reports in the Industrial CT Scanning Industry?
To stay informed about further developments, trends, and reports in the Industrial CT Scanning Industry, consider subscribing to industry newsletters, following relevant companies and organizations, or regularly checking reputable industry news sources and publications.
Methodology
Step 1 - Identification of Relevant Samples Size from Population Database


Step 2 - Approaches for Defining Global Market Size (Value, Volume* & Price*)

Note*: In applicable scenarios
Step 3 - Data Sources
Primary Research
- Web Analytics
- Survey Reports
- Research Institute
- Latest Research Reports
- Opinion Leaders
Secondary Research
- Annual Reports
- White Paper
- Latest Press Release
- Industry Association
- Paid Database
- Investor Presentations

Step 4 - Data Triangulation
Involves using different sources of information in order to increase the validity of a study
These sources are likely to be stakeholders in a program - participants, other researchers, program staff, other community members, and so on.
Then we put all data in single framework & apply various statistical tools to find out the dynamic on the market.
During the analysis stage, feedback from the stakeholder groups would be compared to determine areas of agreement as well as areas of divergence
