

Key Insights
The global image sensor market, valued at $28.32 billion in 2025, is projected to experience robust growth, driven by a compound annual growth rate (CAGR) of 8.24% from 2025 to 2033. This expansion is fueled by several key factors. The increasing adoption of image sensors across diverse sectors, including consumer electronics (smartphones, cameras), automotive (advanced driver-assistance systems, autonomous vehicles), healthcare (medical imaging), and security and surveillance (CCTV, facial recognition), is a primary driver. Technological advancements, such as the development of higher-resolution sensors with improved low-light performance and smaller form factors, are further accelerating market growth. The rising demand for high-quality images and videos in various applications, coupled with the decreasing cost of image sensors, also contributes significantly to market expansion. Competition among leading manufacturers like Canon, OmniVision, Teledyne DALSA, Samsung, and Sony is fostering innovation and driving down prices, making image sensors increasingly accessible for a wider range of applications.
Significant regional variations exist within the market. North America and Asia Pacific are currently leading the market, driven by high technological adoption and strong manufacturing bases. However, emerging economies in regions like South America and the Middle East and Africa are expected to show significant growth potential in the coming years due to increasing investment in infrastructure and technological advancements. The market segmentation by type (CMOS and CCD) reflects the dominance of CMOS sensors due to their lower cost and higher performance capabilities. While CCD sensors maintain a niche in specific applications requiring high-quality image capture, CMOS technology is predicted to continue its market share expansion throughout the forecast period. The ongoing miniaturization trend will further fuel demand, particularly in the rapidly expanding mobile and wearable technology sectors. Potential restraints include supply chain challenges and the cyclical nature of the consumer electronics market; however, the overall growth trajectory remains strongly positive, driven by the pervasive integration of image sensors in a widening array of modern technologies.
This insightful report provides a detailed analysis of the global Image Sensors Market, offering a comprehensive overview of market dynamics, growth trends, and future opportunities from 2019 to 2033. The study covers key market segments, leading players, and emerging technologies, providing stakeholders with actionable intelligence to navigate this rapidly evolving landscape. With a focus on CMOS and CCD image sensors across diverse end-user industries, this report is an essential resource for investors, industry professionals, and strategic decision-makers.
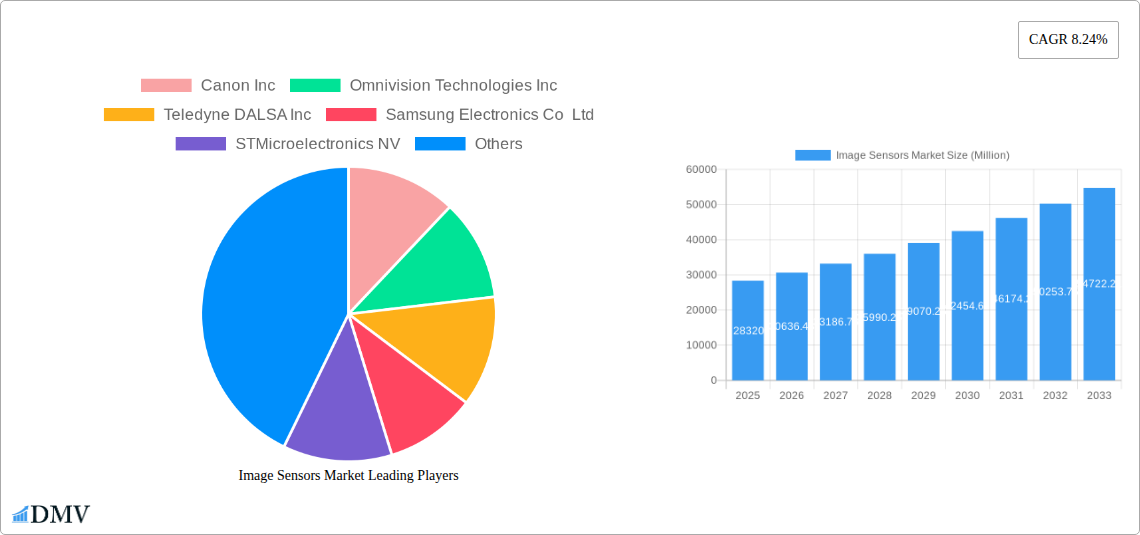
Image Sensors Market Composition & Trends
This section delves into the intricate composition of the image sensors market, analyzing market concentration, innovation drivers, regulatory frameworks, substitute technologies, end-user profiles, and merger & acquisition (M&A) activities. The report utilizes data from the historical period (2019-2024), the base year (2025), and the forecast period (2025-2033) to provide a comprehensive understanding of market evolution.
Market Concentration: The report examines the market share distribution amongst key players like Canon Inc, Omnivision Technologies Inc, Teledyne DALSA Inc, Samsung Electronics Co Ltd, STMicroelectronics NV, SK Hynix Inc, Hamamatsu Photonics K.K., GalaxyCore Inc, ams AG, Panasonic Corporation, and Sony Corporation, identifying potential areas of consolidation and competition. The market concentration ratio (xx%) will be analyzed to determine the level of market dominance.
Innovation Catalysts: Key technological advancements driving market growth, including advancements in pixel technology, higher resolution sensors, and improved low-light performance, are detailed. The report also explores the impact of government funding and research initiatives on innovation.
Regulatory Landscape: An analysis of international and regional regulations impacting the manufacturing, distribution, and application of image sensors, including safety and environmental standards.
Substitute Products: The report identifies potential substitute products or technologies and assesses their impact on market share and growth.
End-User Profiles: A detailed analysis of the end-user segments, including Consumer Electronics, Healthcare, Industrial, Security and Surveillance, Automotive and Transportation, Aerospace and Defense, and Other End-user Industries, will be provided, highlighting their specific needs and preferences.
M&A Activities: The report will analyze recent M&A activities in the image sensors market, including deal values (estimated at xx Million) and their implications for market consolidation and technological advancements. Key strategic acquisitions and partnerships will be examined.
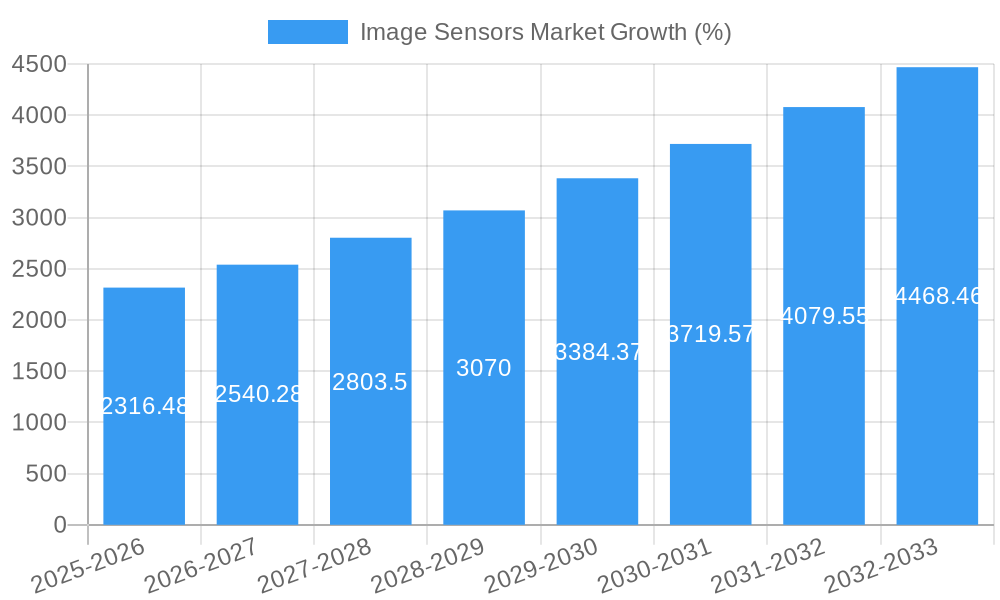
Image Sensors Market Industry Evolution
This section provides a comprehensive analysis of the image sensors market's growth trajectory, technological advancements, and evolving consumer demands, utilizing data from the historical period (2019-2024), the base year (2025), and the forecast period (2025-2033). The report will explore factors like the increasing demand for high-resolution images, advancements in artificial intelligence (AI) and machine learning (ML) applications, and the rising adoption of image sensors in various industries. Detailed analysis of growth rates (projected at xx% CAGR during the forecast period) and adoption metrics for different sensor types (CMOS and CCD) will be included. The impact of emerging trends, such as the Internet of Things (IoT) and the increasing demand for automation, on market growth will be thoroughly discussed.
Leading Regions, Countries, or Segments in Image Sensors Market
This section identifies the dominant regions, countries, and segments within the image sensors market, providing a deep dive into the factors driving their success. The analysis covers both by Type (CMOS and CCD) and By End-user Industry (Consumer Electronics, Healthcare, Industrial, Security and Surveillance, Automotive and Transportation, Aerospace and Defense, Other End-user Industries).
Key Drivers:
Consumer Electronics: High demand for smartphones, digital cameras, and other consumer electronics devices fuels market growth in this segment. Investment in research and development for improved image quality is a key driver.
Automotive and Transportation: The increasing adoption of Advanced Driver-Assistance Systems (ADAS) and autonomous driving technologies significantly boosts demand for high-performance image sensors in this sector.
Healthcare: Growth is driven by the increasing adoption of medical imaging technologies and minimally invasive surgical procedures.
Security and Surveillance: The growing need for enhanced security and surveillance systems in various sectors fuels significant growth in this segment.
Dominance Factors: The report will analyze specific factors contributing to the dominance of particular regions, including government policies, technological infrastructure, manufacturing capabilities, and consumer preferences. For example, the dominance of [insert dominant region/country] in the CMOS sensor market will be explained through an analysis of their manufacturing capabilities and their strong presence in the consumer electronics sector.
Image Sensors Market Product Innovations
Recent innovations in image sensor technology have focused on enhancing image quality, reducing power consumption, and increasing functionality. This includes advancements in back-illuminated sensors, improved pixel designs, and the integration of signal processing capabilities directly onto the sensor chip. These innovations have enabled the development of smaller, more energy-efficient, and higher-performing image sensors for a wide range of applications, including high-resolution cameras for smartphones, advanced driver-assistance systems, and medical imaging equipment. Unique selling propositions often revolve around improved low-light performance, higher dynamic range, and faster frame rates.
Propelling Factors for Image Sensors Market Growth
The image sensors market is driven by several key factors, including the rising demand for high-resolution imaging in various applications, technological advancements in sensor technology, and supportive government policies. The increasing penetration of smartphones and other consumer electronics globally is a significant driver, along with the growing adoption of image sensors in automotive and industrial automation. Furthermore, government initiatives promoting the development of advanced technologies contribute to market expansion. The increasing demand for improved image quality and functionality across diverse sectors creates a compelling growth outlook.
Obstacles in the Image Sensors Market Market
Despite significant growth potential, several factors hinder the image sensors market's expansion. These include the high cost of advanced image sensors, potential supply chain disruptions affecting component availability, and intense competition among major players. Strict regulatory compliance requirements, particularly in specific industries like automotive and healthcare, add to the challenges. The impact of these obstacles on market growth is quantified using detailed analysis and projected growth figures.
Future Opportunities in Image Sensors Market
The future of the image sensors market is bright, with several key opportunities emerging. The expanding adoption of 3D sensing technologies, the increasing demand for high-resolution image sensors in autonomous vehicles, and the growth of artificial intelligence (AI) and machine learning (ML) applications create significant potential. New markets, such as augmented reality (AR) and virtual reality (VR), are also driving innovation and expansion in the image sensors industry. Further research and development in areas like spectral imaging and hyperspectral imaging open up new avenues for market growth.
Major Players in the Image Sensors Market Ecosystem
- Canon Inc
- Omnivision Technologies Inc
- Teledyne DALSA Inc
- Samsung Electronics Co Ltd
- STMicroelectronics NV
- SK Hynix Inc
- Hamamatsu Photonics K.K.
- GalaxyCore Inc
- ams AG
- Panasonic Corporation
- Sony Corporation
Key Developments in Image Sensors Market Industry
- January 2023: [Company Name] launched a new high-resolution image sensor with improved low-light performance. This launch significantly impacted market dynamics by enhancing competition in the high-end segment.
- March 2022: [Company Name] announced a strategic partnership with [Company Name] to develop advanced image sensor technologies for the automotive industry. This collaboration fostered innovation and strengthened market positioning.
- June 2021: [Company Name] acquired [Company Name], expanding its product portfolio and market share. This acquisition led to significant changes in the competitive landscape. (Further developments with specific dates and impacts will be included in the full report)
Strategic Image Sensors Market Market Forecast
The image sensors market is poised for robust growth, driven by technological advancements, rising demand across various end-user sectors, and increased investment in R&D. The forecast period (2025-2033) promises significant expansion, particularly in segments such as automotive, healthcare, and security and surveillance. Continuous innovation in image sensor technology, such as the development of higher-resolution sensors and improved low-light capabilities, will further drive market growth. The market's overall potential remains substantial, presenting lucrative opportunities for both established players and emerging entrants.
Image Sensors Market Segmentation
-
1. Type
- 1.1. CMOS
- 1.2. CCD
-
2. End-user Industry
- 2.1. Consumer Electronics
- 2.2. Healthcare
- 2.3. Industrial
- 2.4. Security and Surveillance
- 2.5. Automotive and Transportation
- 2.6. Aerospace and Defense
- 2.7. Other End-user Industries
Image Sensors Market Segmentation By Geography
-
1. North America
- 1.1. United States
- 1.2. Canada
-
2. Europe
- 2.1. United Kingdom
- 2.2. Germany
- 2.3. France
- 2.4. Rest of Europe
-
3. Asia Pacific
- 3.1. China
- 3.2. India
- 3.3. Japan
- 3.4. Rest of Asia Pacific
- 4. Rest of the World
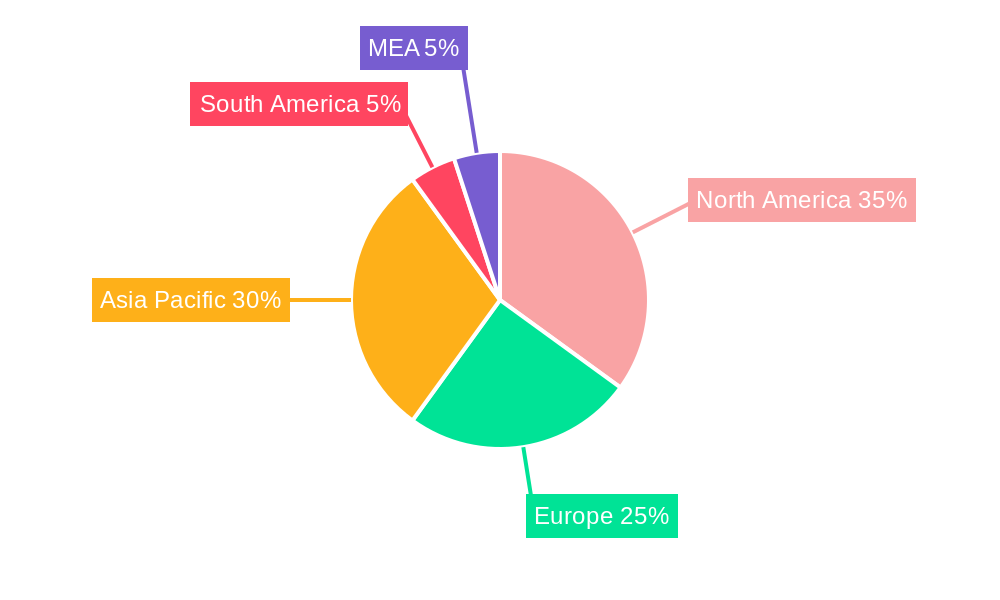
Image Sensors Market REPORT HIGHLIGHTS
| Aspects | Details |
|---|---|
| Study Period | 2019-2033 |
| Base Year | 2024 |
| Estimated Year | 2025 |
| Forecast Period | 2025-2033 |
| Historical Period | 2019-2024 |
| Growth Rate | CAGR of 8.24% from 2019-2033 |
| Segmentation |
|
Table of Contents
- 1. Introduction
- 1.1. Research Scope
- 1.2. Market Segmentation
- 1.3. Research Methodology
- 1.4. Definitions and Assumptions
- 2. Executive Summary
- 2.1. Introduction
- 3. Market Dynamics
- 3.1. Introduction
- 3.2. Market Drivers
- 3.2.1. Increasing Demand in Automotive Sector; Demand for Gesture Recognition/Control in Vertical Applications
- 3.3. Market Restrains
- 3.3.1. ; Easy availability of light detection and ranging (LiDAR) solutions.
- 3.4. Market Trends
- 3.4.1. CMOS Image Sensor to Witnesses a Significant Growth
- 4. Market Factor Analysis
- 4.1. Porters Five Forces
- 4.2. Supply/Value Chain
- 4.3. PESTEL analysis
- 4.4. Market Entropy
- 4.5. Patent/Trademark Analysis
- 5. Global Image Sensors Market Analysis, Insights and Forecast, 2019-2031
- 5.1. Market Analysis, Insights and Forecast - by Type
- 5.1.1. CMOS
- 5.1.2. CCD
- 5.2. Market Analysis, Insights and Forecast - by End-user Industry
- 5.2.1. Consumer Electronics
- 5.2.2. Healthcare
- 5.2.3. Industrial
- 5.2.4. Security and Surveillance
- 5.2.5. Automotive and Transportation
- 5.2.6. Aerospace and Defense
- 5.2.7. Other End-user Industries
- 5.3. Market Analysis, Insights and Forecast - by Region
- 5.3.1. North America
- 5.3.2. Europe
- 5.3.3. Asia Pacific
- 5.3.4. Rest of the World
- 5.1. Market Analysis, Insights and Forecast - by Type
- 6. North America Image Sensors Market Analysis, Insights and Forecast, 2019-2031
- 6.1. Market Analysis, Insights and Forecast - by Type
- 6.1.1. CMOS
- 6.1.2. CCD
- 6.2. Market Analysis, Insights and Forecast - by End-user Industry
- 6.2.1. Consumer Electronics
- 6.2.2. Healthcare
- 6.2.3. Industrial
- 6.2.4. Security and Surveillance
- 6.2.5. Automotive and Transportation
- 6.2.6. Aerospace and Defense
- 6.2.7. Other End-user Industries
- 6.1. Market Analysis, Insights and Forecast - by Type
- 7. Europe Image Sensors Market Analysis, Insights and Forecast, 2019-2031
- 7.1. Market Analysis, Insights and Forecast - by Type
- 7.1.1. CMOS
- 7.1.2. CCD
- 7.2. Market Analysis, Insights and Forecast - by End-user Industry
- 7.2.1. Consumer Electronics
- 7.2.2. Healthcare
- 7.2.3. Industrial
- 7.2.4. Security and Surveillance
- 7.2.5. Automotive and Transportation
- 7.2.6. Aerospace and Defense
- 7.2.7. Other End-user Industries
- 7.1. Market Analysis, Insights and Forecast - by Type
- 8. Asia Pacific Image Sensors Market Analysis, Insights and Forecast, 2019-2031
- 8.1. Market Analysis, Insights and Forecast - by Type
- 8.1.1. CMOS
- 8.1.2. CCD
- 8.2. Market Analysis, Insights and Forecast - by End-user Industry
- 8.2.1. Consumer Electronics
- 8.2.2. Healthcare
- 8.2.3. Industrial
- 8.2.4. Security and Surveillance
- 8.2.5. Automotive and Transportation
- 8.2.6. Aerospace and Defense
- 8.2.7. Other End-user Industries
- 8.1. Market Analysis, Insights and Forecast - by Type
- 9. Rest of the World Image Sensors Market Analysis, Insights and Forecast, 2019-2031
- 9.1. Market Analysis, Insights and Forecast - by Type
- 9.1.1. CMOS
- 9.1.2. CCD
- 9.2. Market Analysis, Insights and Forecast - by End-user Industry
- 9.2.1. Consumer Electronics
- 9.2.2. Healthcare
- 9.2.3. Industrial
- 9.2.4. Security and Surveillance
- 9.2.5. Automotive and Transportation
- 9.2.6. Aerospace and Defense
- 9.2.7. Other End-user Industries
- 9.1. Market Analysis, Insights and Forecast - by Type
- 10. North America Image Sensors Market Analysis, Insights and Forecast, 2019-2031
- 10.1. Market Analysis, Insights and Forecast - By Country/Sub-region
- 10.1.1 United States
- 10.1.2 Canada
- 10.1.3 Mexico
- 11. Europe Image Sensors Market Analysis, Insights and Forecast, 2019-2031
- 11.1. Market Analysis, Insights and Forecast - By Country/Sub-region
- 11.1.1 Germany
- 11.1.2 United Kingdom
- 11.1.3 France
- 11.1.4 Spain
- 11.1.5 Italy
- 11.1.6 Spain
- 11.1.7 Belgium
- 11.1.8 Netherland
- 11.1.9 Nordics
- 11.1.10 Rest of Europe
- 12. Asia Pacific Image Sensors Market Analysis, Insights and Forecast, 2019-2031
- 12.1. Market Analysis, Insights and Forecast - By Country/Sub-region
- 12.1.1 China
- 12.1.2 Japan
- 12.1.3 India
- 12.1.4 South Korea
- 12.1.5 Southeast Asia
- 12.1.6 Australia
- 12.1.7 Indonesia
- 12.1.8 Phillipes
- 12.1.9 Singapore
- 12.1.10 Thailandc
- 12.1.11 Rest of Asia Pacific
- 13. South America Image Sensors Market Analysis, Insights and Forecast, 2019-2031
- 13.1. Market Analysis, Insights and Forecast - By Country/Sub-region
- 13.1.1 Brazil
- 13.1.2 Argentina
- 13.1.3 Peru
- 13.1.4 Chile
- 13.1.5 Colombia
- 13.1.6 Ecuador
- 13.1.7 Venezuela
- 13.1.8 Rest of South America
- 14. North America Image Sensors Market Analysis, Insights and Forecast, 2019-2031
- 14.1. Market Analysis, Insights and Forecast - By Country/Sub-region
- 14.1.1 United States
- 14.1.2 Canada
- 14.1.3 Mexico
- 15. MEA Image Sensors Market Analysis, Insights and Forecast, 2019-2031
- 15.1. Market Analysis, Insights and Forecast - By Country/Sub-region
- 15.1.1 United Arab Emirates
- 15.1.2 Saudi Arabia
- 15.1.3 South Africa
- 15.1.4 Rest of Middle East and Africa
- 16. Competitive Analysis
- 16.1. Global Market Share Analysis 2024
- 16.2. Company Profiles
- 16.2.1 Canon Inc
- 16.2.1.1. Overview
- 16.2.1.2. Products
- 16.2.1.3. SWOT Analysis
- 16.2.1.4. Recent Developments
- 16.2.1.5. Financials (Based on Availability)
- 16.2.2 Omnivision Technologies Inc
- 16.2.2.1. Overview
- 16.2.2.2. Products
- 16.2.2.3. SWOT Analysis
- 16.2.2.4. Recent Developments
- 16.2.2.5. Financials (Based on Availability)
- 16.2.3 Teledyne DALSA Inc
- 16.2.3.1. Overview
- 16.2.3.2. Products
- 16.2.3.3. SWOT Analysis
- 16.2.3.4. Recent Developments
- 16.2.3.5. Financials (Based on Availability)
- 16.2.4 Samsung Electronics Co Ltd
- 16.2.4.1. Overview
- 16.2.4.2. Products
- 16.2.4.3. SWOT Analysis
- 16.2.4.4. Recent Developments
- 16.2.4.5. Financials (Based on Availability)
- 16.2.5 STMicroelectronics NV
- 16.2.5.1. Overview
- 16.2.5.2. Products
- 16.2.5.3. SWOT Analysis
- 16.2.5.4. Recent Developments
- 16.2.5.5. Financials (Based on Availability)
- 16.2.6 SK Hynix Inc
- 16.2.6.1. Overview
- 16.2.6.2. Products
- 16.2.6.3. SWOT Analysis
- 16.2.6.4. Recent Developments
- 16.2.6.5. Financials (Based on Availability)
- 16.2.7 Hamamatsu Photonics K K
- 16.2.7.1. Overview
- 16.2.7.2. Products
- 16.2.7.3. SWOT Analysis
- 16.2.7.4. Recent Developments
- 16.2.7.5. Financials (Based on Availability)
- 16.2.8 GalaxyCore Inc
- 16.2.8.1. Overview
- 16.2.8.2. Products
- 16.2.8.3. SWOT Analysis
- 16.2.8.4. Recent Developments
- 16.2.8.5. Financials (Based on Availability)
- 16.2.9 Ams AG
- 16.2.9.1. Overview
- 16.2.9.2. Products
- 16.2.9.3. SWOT Analysis
- 16.2.9.4. Recent Developments
- 16.2.9.5. Financials (Based on Availability)
- 16.2.10 Panasonic Corporation
- 16.2.10.1. Overview
- 16.2.10.2. Products
- 16.2.10.3. SWOT Analysis
- 16.2.10.4. Recent Developments
- 16.2.10.5. Financials (Based on Availability)
- 16.2.11 Sony Corporation
- 16.2.11.1. Overview
- 16.2.11.2. Products
- 16.2.11.3. SWOT Analysis
- 16.2.11.4. Recent Developments
- 16.2.11.5. Financials (Based on Availability)
- 16.2.1 Canon Inc
List of Figures
- Figure 1: Global Image Sensors Market Revenue Breakdown (Million, %) by Region 2024 & 2032
- Figure 2: Global Image Sensors Market Volume Breakdown (K Unit, %) by Region 2024 & 2032
- Figure 3: North America Image Sensors Market Revenue (Million), by Country 2024 & 2032
- Figure 4: North America Image Sensors Market Volume (K Unit), by Country 2024 & 2032
- Figure 5: North America Image Sensors Market Revenue Share (%), by Country 2024 & 2032
- Figure 6: North America Image Sensors Market Volume Share (%), by Country 2024 & 2032
- Figure 7: Europe Image Sensors Market Revenue (Million), by Country 2024 & 2032
- Figure 8: Europe Image Sensors Market Volume (K Unit), by Country 2024 & 2032
- Figure 9: Europe Image Sensors Market Revenue Share (%), by Country 2024 & 2032
- Figure 10: Europe Image Sensors Market Volume Share (%), by Country 2024 & 2032
- Figure 11: Asia Pacific Image Sensors Market Revenue (Million), by Country 2024 & 2032
- Figure 12: Asia Pacific Image Sensors Market Volume (K Unit), by Country 2024 & 2032
- Figure 13: Asia Pacific Image Sensors Market Revenue Share (%), by Country 2024 & 2032
- Figure 14: Asia Pacific Image Sensors Market Volume Share (%), by Country 2024 & 2032
- Figure 15: South America Image Sensors Market Revenue (Million), by Country 2024 & 2032
- Figure 16: South America Image Sensors Market Volume (K Unit), by Country 2024 & 2032
- Figure 17: South America Image Sensors Market Revenue Share (%), by Country 2024 & 2032
- Figure 18: South America Image Sensors Market Volume Share (%), by Country 2024 & 2032
- Figure 19: North America Image Sensors Market Revenue (Million), by Country 2024 & 2032
- Figure 20: North America Image Sensors Market Volume (K Unit), by Country 2024 & 2032
- Figure 21: North America Image Sensors Market Revenue Share (%), by Country 2024 & 2032
- Figure 22: North America Image Sensors Market Volume Share (%), by Country 2024 & 2032
- Figure 23: MEA Image Sensors Market Revenue (Million), by Country 2024 & 2032
- Figure 24: MEA Image Sensors Market Volume (K Unit), by Country 2024 & 2032
- Figure 25: MEA Image Sensors Market Revenue Share (%), by Country 2024 & 2032
- Figure 26: MEA Image Sensors Market Volume Share (%), by Country 2024 & 2032
- Figure 27: North America Image Sensors Market Revenue (Million), by Type 2024 & 2032
- Figure 28: North America Image Sensors Market Volume (K Unit), by Type 2024 & 2032
- Figure 29: North America Image Sensors Market Revenue Share (%), by Type 2024 & 2032
- Figure 30: North America Image Sensors Market Volume Share (%), by Type 2024 & 2032
- Figure 31: North America Image Sensors Market Revenue (Million), by End-user Industry 2024 & 2032
- Figure 32: North America Image Sensors Market Volume (K Unit), by End-user Industry 2024 & 2032
- Figure 33: North America Image Sensors Market Revenue Share (%), by End-user Industry 2024 & 2032
- Figure 34: North America Image Sensors Market Volume Share (%), by End-user Industry 2024 & 2032
- Figure 35: North America Image Sensors Market Revenue (Million), by Country 2024 & 2032
- Figure 36: North America Image Sensors Market Volume (K Unit), by Country 2024 & 2032
- Figure 37: North America Image Sensors Market Revenue Share (%), by Country 2024 & 2032
- Figure 38: North America Image Sensors Market Volume Share (%), by Country 2024 & 2032
- Figure 39: Europe Image Sensors Market Revenue (Million), by Type 2024 & 2032
- Figure 40: Europe Image Sensors Market Volume (K Unit), by Type 2024 & 2032
- Figure 41: Europe Image Sensors Market Revenue Share (%), by Type 2024 & 2032
- Figure 42: Europe Image Sensors Market Volume Share (%), by Type 2024 & 2032
- Figure 43: Europe Image Sensors Market Revenue (Million), by End-user Industry 2024 & 2032
- Figure 44: Europe Image Sensors Market Volume (K Unit), by End-user Industry 2024 & 2032
- Figure 45: Europe Image Sensors Market Revenue Share (%), by End-user Industry 2024 & 2032
- Figure 46: Europe Image Sensors Market Volume Share (%), by End-user Industry 2024 & 2032
- Figure 47: Europe Image Sensors Market Revenue (Million), by Country 2024 & 2032
- Figure 48: Europe Image Sensors Market Volume (K Unit), by Country 2024 & 2032
- Figure 49: Europe Image Sensors Market Revenue Share (%), by Country 2024 & 2032
- Figure 50: Europe Image Sensors Market Volume Share (%), by Country 2024 & 2032
- Figure 51: Asia Pacific Image Sensors Market Revenue (Million), by Type 2024 & 2032
- Figure 52: Asia Pacific Image Sensors Market Volume (K Unit), by Type 2024 & 2032
- Figure 53: Asia Pacific Image Sensors Market Revenue Share (%), by Type 2024 & 2032
- Figure 54: Asia Pacific Image Sensors Market Volume Share (%), by Type 2024 & 2032
- Figure 55: Asia Pacific Image Sensors Market Revenue (Million), by End-user Industry 2024 & 2032
- Figure 56: Asia Pacific Image Sensors Market Volume (K Unit), by End-user Industry 2024 & 2032
- Figure 57: Asia Pacific Image Sensors Market Revenue Share (%), by End-user Industry 2024 & 2032
- Figure 58: Asia Pacific Image Sensors Market Volume Share (%), by End-user Industry 2024 & 2032
- Figure 59: Asia Pacific Image Sensors Market Revenue (Million), by Country 2024 & 2032
- Figure 60: Asia Pacific Image Sensors Market Volume (K Unit), by Country 2024 & 2032
- Figure 61: Asia Pacific Image Sensors Market Revenue Share (%), by Country 2024 & 2032
- Figure 62: Asia Pacific Image Sensors Market Volume Share (%), by Country 2024 & 2032
- Figure 63: Rest of the World Image Sensors Market Revenue (Million), by Type 2024 & 2032
- Figure 64: Rest of the World Image Sensors Market Volume (K Unit), by Type 2024 & 2032
- Figure 65: Rest of the World Image Sensors Market Revenue Share (%), by Type 2024 & 2032
- Figure 66: Rest of the World Image Sensors Market Volume Share (%), by Type 2024 & 2032
- Figure 67: Rest of the World Image Sensors Market Revenue (Million), by End-user Industry 2024 & 2032
- Figure 68: Rest of the World Image Sensors Market Volume (K Unit), by End-user Industry 2024 & 2032
- Figure 69: Rest of the World Image Sensors Market Revenue Share (%), by End-user Industry 2024 & 2032
- Figure 70: Rest of the World Image Sensors Market Volume Share (%), by End-user Industry 2024 & 2032
- Figure 71: Rest of the World Image Sensors Market Revenue (Million), by Country 2024 & 2032
- Figure 72: Rest of the World Image Sensors Market Volume (K Unit), by Country 2024 & 2032
- Figure 73: Rest of the World Image Sensors Market Revenue Share (%), by Country 2024 & 2032
- Figure 74: Rest of the World Image Sensors Market Volume Share (%), by Country 2024 & 2032
List of Tables
- Table 1: Global Image Sensors Market Revenue Million Forecast, by Region 2019 & 2032
- Table 2: Global Image Sensors Market Volume K Unit Forecast, by Region 2019 & 2032
- Table 3: Global Image Sensors Market Revenue Million Forecast, by Type 2019 & 2032
- Table 4: Global Image Sensors Market Volume K Unit Forecast, by Type 2019 & 2032
- Table 5: Global Image Sensors Market Revenue Million Forecast, by End-user Industry 2019 & 2032
- Table 6: Global Image Sensors Market Volume K Unit Forecast, by End-user Industry 2019 & 2032
- Table 7: Global Image Sensors Market Revenue Million Forecast, by Region 2019 & 2032
- Table 8: Global Image Sensors Market Volume K Unit Forecast, by Region 2019 & 2032
- Table 9: Global Image Sensors Market Revenue Million Forecast, by Country 2019 & 2032
- Table 10: Global Image Sensors Market Volume K Unit Forecast, by Country 2019 & 2032
- Table 11: United States Image Sensors Market Revenue (Million) Forecast, by Application 2019 & 2032
- Table 12: United States Image Sensors Market Volume (K Unit) Forecast, by Application 2019 & 2032
- Table 13: Canada Image Sensors Market Revenue (Million) Forecast, by Application 2019 & 2032
- Table 14: Canada Image Sensors Market Volume (K Unit) Forecast, by Application 2019 & 2032
- Table 15: Mexico Image Sensors Market Revenue (Million) Forecast, by Application 2019 & 2032
- Table 16: Mexico Image Sensors Market Volume (K Unit) Forecast, by Application 2019 & 2032
- Table 17: Global Image Sensors Market Revenue Million Forecast, by Country 2019 & 2032
- Table 18: Global Image Sensors Market Volume K Unit Forecast, by Country 2019 & 2032
- Table 19: Germany Image Sensors Market Revenue (Million) Forecast, by Application 2019 & 2032
- Table 20: Germany Image Sensors Market Volume (K Unit) Forecast, by Application 2019 & 2032
- Table 21: United Kingdom Image Sensors Market Revenue (Million) Forecast, by Application 2019 & 2032
- Table 22: United Kingdom Image Sensors Market Volume (K Unit) Forecast, by Application 2019 & 2032
- Table 23: France Image Sensors Market Revenue (Million) Forecast, by Application 2019 & 2032
- Table 24: France Image Sensors Market Volume (K Unit) Forecast, by Application 2019 & 2032
- Table 25: Spain Image Sensors Market Revenue (Million) Forecast, by Application 2019 & 2032
- Table 26: Spain Image Sensors Market Volume (K Unit) Forecast, by Application 2019 & 2032
- Table 27: Italy Image Sensors Market Revenue (Million) Forecast, by Application 2019 & 2032
- Table 28: Italy Image Sensors Market Volume (K Unit) Forecast, by Application 2019 & 2032
- Table 29: Spain Image Sensors Market Revenue (Million) Forecast, by Application 2019 & 2032
- Table 30: Spain Image Sensors Market Volume (K Unit) Forecast, by Application 2019 & 2032
- Table 31: Belgium Image Sensors Market Revenue (Million) Forecast, by Application 2019 & 2032
- Table 32: Belgium Image Sensors Market Volume (K Unit) Forecast, by Application 2019 & 2032
- Table 33: Netherland Image Sensors Market Revenue (Million) Forecast, by Application 2019 & 2032
- Table 34: Netherland Image Sensors Market Volume (K Unit) Forecast, by Application 2019 & 2032
- Table 35: Nordics Image Sensors Market Revenue (Million) Forecast, by Application 2019 & 2032
- Table 36: Nordics Image Sensors Market Volume (K Unit) Forecast, by Application 2019 & 2032
- Table 37: Rest of Europe Image Sensors Market Revenue (Million) Forecast, by Application 2019 & 2032
- Table 38: Rest of Europe Image Sensors Market Volume (K Unit) Forecast, by Application 2019 & 2032
- Table 39: Global Image Sensors Market Revenue Million Forecast, by Country 2019 & 2032
- Table 40: Global Image Sensors Market Volume K Unit Forecast, by Country 2019 & 2032
- Table 41: China Image Sensors Market Revenue (Million) Forecast, by Application 2019 & 2032
- Table 42: China Image Sensors Market Volume (K Unit) Forecast, by Application 2019 & 2032
- Table 43: Japan Image Sensors Market Revenue (Million) Forecast, by Application 2019 & 2032
- Table 44: Japan Image Sensors Market Volume (K Unit) Forecast, by Application 2019 & 2032
- Table 45: India Image Sensors Market Revenue (Million) Forecast, by Application 2019 & 2032
- Table 46: India Image Sensors Market Volume (K Unit) Forecast, by Application 2019 & 2032
- Table 47: South Korea Image Sensors Market Revenue (Million) Forecast, by Application 2019 & 2032
- Table 48: South Korea Image Sensors Market Volume (K Unit) Forecast, by Application 2019 & 2032
- Table 49: Southeast Asia Image Sensors Market Revenue (Million) Forecast, by Application 2019 & 2032
- Table 50: Southeast Asia Image Sensors Market Volume (K Unit) Forecast, by Application 2019 & 2032
- Table 51: Australia Image Sensors Market Revenue (Million) Forecast, by Application 2019 & 2032
- Table 52: Australia Image Sensors Market Volume (K Unit) Forecast, by Application 2019 & 2032
- Table 53: Indonesia Image Sensors Market Revenue (Million) Forecast, by Application 2019 & 2032
- Table 54: Indonesia Image Sensors Market Volume (K Unit) Forecast, by Application 2019 & 2032
- Table 55: Phillipes Image Sensors Market Revenue (Million) Forecast, by Application 2019 & 2032
- Table 56: Phillipes Image Sensors Market Volume (K Unit) Forecast, by Application 2019 & 2032
- Table 57: Singapore Image Sensors Market Revenue (Million) Forecast, by Application 2019 & 2032
- Table 58: Singapore Image Sensors Market Volume (K Unit) Forecast, by Application 2019 & 2032
- Table 59: Thailandc Image Sensors Market Revenue (Million) Forecast, by Application 2019 & 2032
- Table 60: Thailandc Image Sensors Market Volume (K Unit) Forecast, by Application 2019 & 2032
- Table 61: Rest of Asia Pacific Image Sensors Market Revenue (Million) Forecast, by Application 2019 & 2032
- Table 62: Rest of Asia Pacific Image Sensors Market Volume (K Unit) Forecast, by Application 2019 & 2032
- Table 63: Global Image Sensors Market Revenue Million Forecast, by Country 2019 & 2032
- Table 64: Global Image Sensors Market Volume K Unit Forecast, by Country 2019 & 2032
- Table 65: Brazil Image Sensors Market Revenue (Million) Forecast, by Application 2019 & 2032
- Table 66: Brazil Image Sensors Market Volume (K Unit) Forecast, by Application 2019 & 2032
- Table 67: Argentina Image Sensors Market Revenue (Million) Forecast, by Application 2019 & 2032
- Table 68: Argentina Image Sensors Market Volume (K Unit) Forecast, by Application 2019 & 2032
- Table 69: Peru Image Sensors Market Revenue (Million) Forecast, by Application 2019 & 2032
- Table 70: Peru Image Sensors Market Volume (K Unit) Forecast, by Application 2019 & 2032
- Table 71: Chile Image Sensors Market Revenue (Million) Forecast, by Application 2019 & 2032
- Table 72: Chile Image Sensors Market Volume (K Unit) Forecast, by Application 2019 & 2032
- Table 73: Colombia Image Sensors Market Revenue (Million) Forecast, by Application 2019 & 2032
- Table 74: Colombia Image Sensors Market Volume (K Unit) Forecast, by Application 2019 & 2032
- Table 75: Ecuador Image Sensors Market Revenue (Million) Forecast, by Application 2019 & 2032
- Table 76: Ecuador Image Sensors Market Volume (K Unit) Forecast, by Application 2019 & 2032
- Table 77: Venezuela Image Sensors Market Revenue (Million) Forecast, by Application 2019 & 2032
- Table 78: Venezuela Image Sensors Market Volume (K Unit) Forecast, by Application 2019 & 2032
- Table 79: Rest of South America Image Sensors Market Revenue (Million) Forecast, by Application 2019 & 2032
- Table 80: Rest of South America Image Sensors Market Volume (K Unit) Forecast, by Application 2019 & 2032
- Table 81: Global Image Sensors Market Revenue Million Forecast, by Country 2019 & 2032
- Table 82: Global Image Sensors Market Volume K Unit Forecast, by Country 2019 & 2032
- Table 83: United States Image Sensors Market Revenue (Million) Forecast, by Application 2019 & 2032
- Table 84: United States Image Sensors Market Volume (K Unit) Forecast, by Application 2019 & 2032
- Table 85: Canada Image Sensors Market Revenue (Million) Forecast, by Application 2019 & 2032
- Table 86: Canada Image Sensors Market Volume (K Unit) Forecast, by Application 2019 & 2032
- Table 87: Mexico Image Sensors Market Revenue (Million) Forecast, by Application 2019 & 2032
- Table 88: Mexico Image Sensors Market Volume (K Unit) Forecast, by Application 2019 & 2032
- Table 89: Global Image Sensors Market Revenue Million Forecast, by Country 2019 & 2032
- Table 90: Global Image Sensors Market Volume K Unit Forecast, by Country 2019 & 2032
- Table 91: United Arab Emirates Image Sensors Market Revenue (Million) Forecast, by Application 2019 & 2032
- Table 92: United Arab Emirates Image Sensors Market Volume (K Unit) Forecast, by Application 2019 & 2032
- Table 93: Saudi Arabia Image Sensors Market Revenue (Million) Forecast, by Application 2019 & 2032
- Table 94: Saudi Arabia Image Sensors Market Volume (K Unit) Forecast, by Application 2019 & 2032
- Table 95: South Africa Image Sensors Market Revenue (Million) Forecast, by Application 2019 & 2032
- Table 96: South Africa Image Sensors Market Volume (K Unit) Forecast, by Application 2019 & 2032
- Table 97: Rest of Middle East and Africa Image Sensors Market Revenue (Million) Forecast, by Application 2019 & 2032
- Table 98: Rest of Middle East and Africa Image Sensors Market Volume (K Unit) Forecast, by Application 2019 & 2032
- Table 99: Global Image Sensors Market Revenue Million Forecast, by Type 2019 & 2032
- Table 100: Global Image Sensors Market Volume K Unit Forecast, by Type 2019 & 2032
- Table 101: Global Image Sensors Market Revenue Million Forecast, by End-user Industry 2019 & 2032
- Table 102: Global Image Sensors Market Volume K Unit Forecast, by End-user Industry 2019 & 2032
- Table 103: Global Image Sensors Market Revenue Million Forecast, by Country 2019 & 2032
- Table 104: Global Image Sensors Market Volume K Unit Forecast, by Country 2019 & 2032
- Table 105: United States Image Sensors Market Revenue (Million) Forecast, by Application 2019 & 2032
- Table 106: United States Image Sensors Market Volume (K Unit) Forecast, by Application 2019 & 2032
- Table 107: Canada Image Sensors Market Revenue (Million) Forecast, by Application 2019 & 2032
- Table 108: Canada Image Sensors Market Volume (K Unit) Forecast, by Application 2019 & 2032
- Table 109: Global Image Sensors Market Revenue Million Forecast, by Type 2019 & 2032
- Table 110: Global Image Sensors Market Volume K Unit Forecast, by Type 2019 & 2032
- Table 111: Global Image Sensors Market Revenue Million Forecast, by End-user Industry 2019 & 2032
- Table 112: Global Image Sensors Market Volume K Unit Forecast, by End-user Industry 2019 & 2032
- Table 113: Global Image Sensors Market Revenue Million Forecast, by Country 2019 & 2032
- Table 114: Global Image Sensors Market Volume K Unit Forecast, by Country 2019 & 2032
- Table 115: United Kingdom Image Sensors Market Revenue (Million) Forecast, by Application 2019 & 2032
- Table 116: United Kingdom Image Sensors Market Volume (K Unit) Forecast, by Application 2019 & 2032
- Table 117: Germany Image Sensors Market Revenue (Million) Forecast, by Application 2019 & 2032
- Table 118: Germany Image Sensors Market Volume (K Unit) Forecast, by Application 2019 & 2032
- Table 119: France Image Sensors Market Revenue (Million) Forecast, by Application 2019 & 2032
- Table 120: France Image Sensors Market Volume (K Unit) Forecast, by Application 2019 & 2032
- Table 121: Rest of Europe Image Sensors Market Revenue (Million) Forecast, by Application 2019 & 2032
- Table 122: Rest of Europe Image Sensors Market Volume (K Unit) Forecast, by Application 2019 & 2032
- Table 123: Global Image Sensors Market Revenue Million Forecast, by Type 2019 & 2032
- Table 124: Global Image Sensors Market Volume K Unit Forecast, by Type 2019 & 2032
- Table 125: Global Image Sensors Market Revenue Million Forecast, by End-user Industry 2019 & 2032
- Table 126: Global Image Sensors Market Volume K Unit Forecast, by End-user Industry 2019 & 2032
- Table 127: Global Image Sensors Market Revenue Million Forecast, by Country 2019 & 2032
- Table 128: Global Image Sensors Market Volume K Unit Forecast, by Country 2019 & 2032
- Table 129: China Image Sensors Market Revenue (Million) Forecast, by Application 2019 & 2032
- Table 130: China Image Sensors Market Volume (K Unit) Forecast, by Application 2019 & 2032
- Table 131: India Image Sensors Market Revenue (Million) Forecast, by Application 2019 & 2032
- Table 132: India Image Sensors Market Volume (K Unit) Forecast, by Application 2019 & 2032
- Table 133: Japan Image Sensors Market Revenue (Million) Forecast, by Application 2019 & 2032
- Table 134: Japan Image Sensors Market Volume (K Unit) Forecast, by Application 2019 & 2032
- Table 135: Rest of Asia Pacific Image Sensors Market Revenue (Million) Forecast, by Application 2019 & 2032
- Table 136: Rest of Asia Pacific Image Sensors Market Volume (K Unit) Forecast, by Application 2019 & 2032
- Table 137: Global Image Sensors Market Revenue Million Forecast, by Type 2019 & 2032
- Table 138: Global Image Sensors Market Volume K Unit Forecast, by Type 2019 & 2032
- Table 139: Global Image Sensors Market Revenue Million Forecast, by End-user Industry 2019 & 2032
- Table 140: Global Image Sensors Market Volume K Unit Forecast, by End-user Industry 2019 & 2032
- Table 141: Global Image Sensors Market Revenue Million Forecast, by Country 2019 & 2032
- Table 142: Global Image Sensors Market Volume K Unit Forecast, by Country 2019 & 2032
Frequently Asked Questions
1. What is the projected Compound Annual Growth Rate (CAGR) of the Image Sensors Market?
The projected CAGR is approximately 8.24%.
2. Which companies are prominent players in the Image Sensors Market?
Key companies in the market include Canon Inc, Omnivision Technologies Inc, Teledyne DALSA Inc, Samsung Electronics Co Ltd, STMicroelectronics NV, SK Hynix Inc, Hamamatsu Photonics K K, GalaxyCore Inc, Ams AG, Panasonic Corporation, Sony Corporation.
3. What are the main segments of the Image Sensors Market?
The market segments include Type, End-user Industry.
4. Can you provide details about the market size?
The market size is estimated to be USD 28.32 Million as of 2022.
5. What are some drivers contributing to market growth?
Increasing Demand in Automotive Sector; Demand for Gesture Recognition/Control in Vertical Applications.
6. What are the notable trends driving market growth?
CMOS Image Sensor to Witnesses a Significant Growth.
7. Are there any restraints impacting market growth?
; Easy availability of light detection and ranging (LiDAR) solutions..
8. Can you provide examples of recent developments in the market?
N/A
9. What pricing options are available for accessing the report?
Pricing options include single-user, multi-user, and enterprise licenses priced at USD 4750, USD 5250, and USD 8750 respectively.
10. Is the market size provided in terms of value or volume?
The market size is provided in terms of value, measured in Million and volume, measured in K Unit.
11. Are there any specific market keywords associated with the report?
Yes, the market keyword associated with the report is "Image Sensors Market," which aids in identifying and referencing the specific market segment covered.
12. How do I determine which pricing option suits my needs best?
The pricing options vary based on user requirements and access needs. Individual users may opt for single-user licenses, while businesses requiring broader access may choose multi-user or enterprise licenses for cost-effective access to the report.
13. Are there any additional resources or data provided in the Image Sensors Market report?
While the report offers comprehensive insights, it's advisable to review the specific contents or supplementary materials provided to ascertain if additional resources or data are available.
14. How can I stay updated on further developments or reports in the Image Sensors Market?
To stay informed about further developments, trends, and reports in the Image Sensors Market, consider subscribing to industry newsletters, following relevant companies and organizations, or regularly checking reputable industry news sources and publications.
Methodology
Step 1 - Identification of Relevant Samples Size from Population Database


Step 2 - Approaches for Defining Global Market Size (Value, Volume* & Price*)

Note*: In applicable scenarios
Step 3 - Data Sources
Primary Research
- Web Analytics
- Survey Reports
- Research Institute
- Latest Research Reports
- Opinion Leaders
Secondary Research
- Annual Reports
- White Paper
- Latest Press Release
- Industry Association
- Paid Database
- Investor Presentations

Step 4 - Data Triangulation
Involves using different sources of information in order to increase the validity of a study
These sources are likely to be stakeholders in a program - participants, other researchers, program staff, other community members, and so on.
Then we put all data in single framework & apply various statistical tools to find out the dynamic on the market.
During the analysis stage, feedback from the stakeholder groups would be compared to determine areas of agreement as well as areas of divergence
