

Key Insights
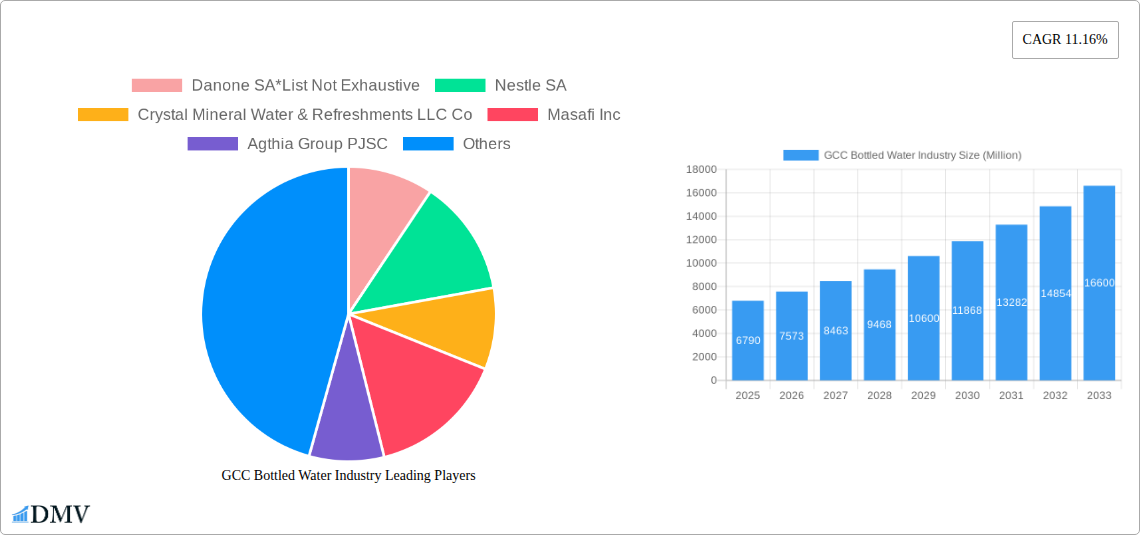
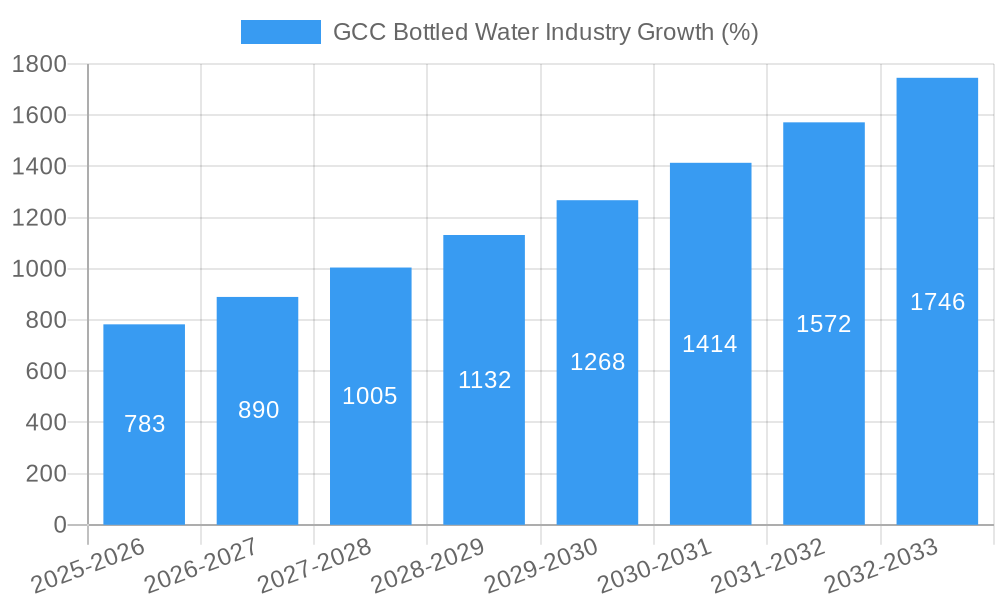
The GCC bottled water market, valued at $6.79 billion in 2025, is projected to experience robust growth, fueled by a Compound Annual Growth Rate (CAGR) of 11.16% from 2025 to 2033. This expansion is driven by several key factors. Rising disposable incomes and increasing health consciousness within the region are leading consumers to prioritize bottled water as a safer and more convenient hydration option compared to tap water. The burgeoning tourism sector and increasing urbanization further contribute to heightened demand. Furthermore, innovative product offerings, such as functional waters enriched with vitamins or minerals, are capturing significant market share, catering to health-conscious consumers seeking enhanced hydration benefits. Aggressive marketing strategies by major players, emphasizing the convenience and health benefits of bottled water, further propel market growth. Distribution channels are also evolving, with online home and office delivery services gaining traction, enhancing accessibility for consumers.
However, the market faces certain challenges. Fluctuations in raw material costs, particularly plastic, can impact profitability. Growing environmental concerns surrounding plastic waste and its impact on sustainability are pushing for eco-friendly alternatives, such as reusable bottles and sustainable packaging options, creating a potential constraint for traditional bottled water manufacturers. Regulatory changes related to water quality and packaging standards could also pose challenges. Despite these headwinds, the GCC bottled water market is poised for significant growth, driven by strong consumer demand and continuous innovations within the industry. Companies like Danone, Nestle, and regional players are strategically positioned to capitalize on this lucrative market, focusing on product diversification and sustainable practices to meet evolving consumer preferences and environmental regulations.
GCC Bottled Water Industry: A Comprehensive Market Report (2019-2033)
This insightful report provides a comprehensive analysis of the GCC bottled water industry, offering a detailed overview of market trends, competitive dynamics, and future growth prospects. The study covers the period from 2019 to 2033, with 2025 serving as the base and estimated year. This report is essential for stakeholders including manufacturers, investors, and regulatory bodies seeking to understand and navigate this dynamic market. The total market size in 2025 is estimated at xx Million.
GCC Bottled Water Industry Market Composition & Trends
This section delves into the competitive landscape of the GCC bottled water market, examining market concentration, innovation drivers, regulatory frameworks, substitute products, consumer profiles, and mergers and acquisitions (M&A) activity. We analyze the market share distribution amongst key players such as Danone SA, Nestle SA, Masafi Inc, and Agthia Group PJSC, revealing the level of market concentration. The report also quantifies M&A activity within the industry, estimating the total deal value at approximately xx Million during the historical period. Furthermore, we explore the influence of regulatory changes, the presence of substitute products (e.g., purified tap water), and evolving consumer preferences on market dynamics. The analysis includes:
- Market Share Distribution: A detailed breakdown of market share held by major players in 2025.
- M&A Activity: Analysis of significant M&A deals and their impact on market consolidation from 2019 to 2024. Deal values are estimated at xx Million.
- Regulatory Landscape: Examination of key regulations influencing the industry and their impact on market growth.
- Innovation Catalysts: Identification of key factors driving innovation, including technological advancements and consumer demands.
- Substitute Products: Analysis of the competitive threat posed by substitute products and their impact on market share.
- End-User Profiles: Segmentation of consumers based on demographics, preferences, and purchasing behavior.
GCC Bottled Water Industry Industry Evolution
This section provides a detailed analysis of the evolution of the GCC bottled water industry from 2019 to 2033, focusing on market growth trajectories, technological advancements, and shifts in consumer preferences. We project a Compound Annual Growth Rate (CAGR) of xx% for the forecast period (2025-2033), driven by factors such as rising disposable incomes, increasing health consciousness, and expanding distribution networks. The report examines the adoption of new technologies in production, packaging, and distribution, as well as the influence of evolving consumer trends, such as the growing demand for functional waters and sustainable packaging. Specific data points are included, detailing growth rates across different segments and adoption rates of key technologies.
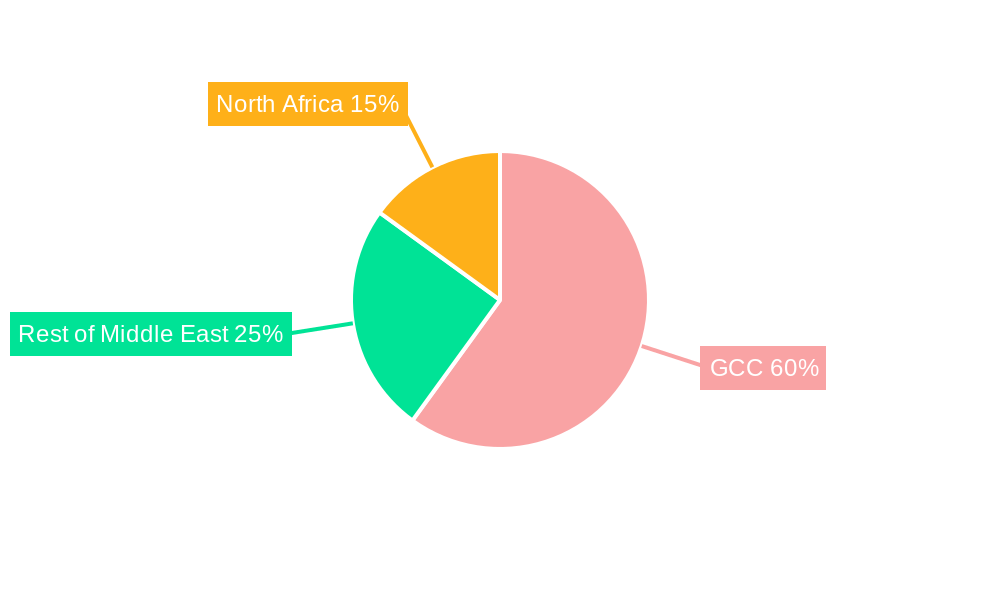
Leading Regions, Countries, or Segments in GCC Bottled Water Industry
This section identifies the leading regions, countries, and segments within the GCC bottled water market. Our analysis reveals that [Specific Region/Country] is the dominant market, driven by factors such as [specific factor, e.g., high population density, strong economic growth]. Within the product segments, still water constitutes the largest share, while the functional water segment exhibits the highest growth potential. In terms of distribution channels, supermarkets/hypermarkets currently dominate, but online and home delivery are expected to witness significant growth in the coming years.
- Key Drivers for Dominant Segments:
- Still Water: High consumer preference, established distribution networks.
- Supermarkets/Hypermarkets: Wide reach, established customer base.
- [Dominant Region/Country]: [Specific factors driving dominance – e.g., high population density, strong consumer spending].
The analysis includes in-depth explanations of the factors contributing to the dominance of specific regions, countries and segments.
GCC Bottled Water Industry Product Innovations
Recent innovations in the GCC bottled water industry include the introduction of functional waters enriched with vitamins and minerals, the use of sustainable and eco-friendly packaging materials (e.g., recycled PET bottles), and smart packaging technologies that enhance product traceability and consumer engagement. These innovations aim to meet the growing consumer demand for healthier and more sustainable products, enhancing brand loyalty and supporting higher pricing strategies. The report details specific examples of these innovative products and analyzes their impact on the market.
Propelling Factors for GCC Bottled Water Industry Growth
Several key factors are driving the growth of the GCC bottled water industry. These include rising disposable incomes leading to increased consumer spending on packaged goods, growing health consciousness resulting in greater demand for healthier beverages, and supportive government regulations promoting the development of the food and beverage sector. Technological advancements in production and distribution have also contributed significantly to market expansion. For example, the adoption of automated filling lines has enhanced efficiency and reduced production costs.
Obstacles in the GCC Bottled Water Industry Market
Despite the positive growth outlook, the GCC bottled water industry faces several challenges. These include increasing raw material costs, stringent regulatory requirements related to water quality and packaging, intense competition amongst established players and new entrants, and potential supply chain disruptions impacting production and distribution. The report quantifies the impact of these obstacles on market growth, estimating the total cost incurred by the industry due to these challenges at xx Million annually.
Future Opportunities in GCC Bottled Water Industry
The GCC bottled water market presents several exciting future opportunities. The increasing demand for premium and functional waters creates substantial potential for product diversification. Moreover, the growing adoption of e-commerce and online delivery channels provides opportunities for enhanced distribution reach and consumer engagement. Expanding into untapped markets within the GCC region and exploring innovative packaging solutions can also drive further growth.
Major Players in the GCC Bottled Water Industry Ecosystem
- Danone SA
- Nestle SA
- Crystal Mineral Water & Refreshments LLC Co
- Masafi Inc
- Agthia Group PJSC
- PepsiCo Inc
- Al-Qassim Water
- New Technology Bottling Company (NTBC) KSCC
- ALGhadeer Drinking Water LLC
- Al-Rawdatain Water Bottling Co
- Al Furat Drinking Water LLC
Key Developments in GCC Bottled Water Industry Industry
- 2022-Q4: [Specific Development – e.g., Launch of a new functional water product by a major player]. Impact: Increased market competition and consumer choice.
- 2023-Q1: [Specific Development – e.g., Merger of two regional bottled water companies]. Impact: Increased market consolidation.
- 2023-Q3: [Specific Development – e.g., Introduction of new regulations on plastic packaging]. Impact: Shift towards sustainable packaging solutions.
- [Add more key developments with dates and impacts as needed]
Strategic GCC Bottled Water Industry Market Forecast
The GCC bottled water industry is poised for continued growth, driven by robust consumer demand, technological advancements, and supportive government policies. The forecast period (2025-2033) promises substantial market expansion, fueled by the growing adoption of innovative products and sustainable packaging solutions. The projected market size in 2033 is estimated at xx Million, reflecting a strong CAGR. The continued focus on product innovation, strategic partnerships, and efficient distribution networks will be crucial for success in this dynamic market.
GCC Bottled Water Industry Segmentation
-
1. Type
- 1.1. Still Water
- 1.2. Sparkling Water
- 1.3. Functional Water
-
2. Distribution Channel
- 2.1. Supermarkets/Hypermarkets
- 2.2. Convenience/Grocery Stores
- 2.3. On-trade Channels
- 2.4. Home and Office Delivery
- 2.5. Other Distribution Channels
-
3. Geography
- 3.1. Saudi Arabia
- 3.2. United Arab Emirates
- 3.3. Kuwait
- 3.4. Qatar
- 3.5. Bahrain
- 3.6. Oman
GCC Bottled Water Industry Segmentation By Geography
- 1. Saudi Arabia
- 2. United Arab Emirates
- 3. Kuwait
- 4. Qatar
- 5. Bahrain
- 6. Oman
GCC Bottled Water Industry REPORT HIGHLIGHTS
| Aspects | Details |
|---|---|
| Study Period | 2019-2033 |
| Base Year | 2024 |
| Estimated Year | 2025 |
| Forecast Period | 2025-2033 |
| Historical Period | 2019-2024 |
| Growth Rate | CAGR of 11.16% from 2019-2033 |
| Segmentation |
|
Table of Contents
- 1. Introduction
- 1.1. Research Scope
- 1.2. Market Segmentation
- 1.3. Research Methodology
- 1.4. Definitions and Assumptions
- 2. Executive Summary
- 2.1. Introduction
- 3. Market Dynamics
- 3.1. Introduction
- 3.2. Market Drivers
- 3.2.1. Growth In Foodservice Expenditure and Tourism Sector; Premiumization with the Growth of Fortified and Flavored Water
- 3.3. Market Restrains
- 3.3.1. Concerns Regarding Plastic Waste and the Rising Inclination Toward Tap Water
- 3.4. Market Trends
- 3.4.1. Scarce Water Resources Leading to Increasing Dependency on Packaged Drinking Water
- 4. Market Factor Analysis
- 4.1. Porters Five Forces
- 4.2. Supply/Value Chain
- 4.3. PESTEL analysis
- 4.4. Market Entropy
- 4.5. Patent/Trademark Analysis
- 5. Global GCC Bottled Water Industry Analysis, Insights and Forecast, 2019-2031
- 5.1. Market Analysis, Insights and Forecast - by Type
- 5.1.1. Still Water
- 5.1.2. Sparkling Water
- 5.1.3. Functional Water
- 5.2. Market Analysis, Insights and Forecast - by Distribution Channel
- 5.2.1. Supermarkets/Hypermarkets
- 5.2.2. Convenience/Grocery Stores
- 5.2.3. On-trade Channels
- 5.2.4. Home and Office Delivery
- 5.2.5. Other Distribution Channels
- 5.3. Market Analysis, Insights and Forecast - by Geography
- 5.3.1. Saudi Arabia
- 5.3.2. United Arab Emirates
- 5.3.3. Kuwait
- 5.3.4. Qatar
- 5.3.5. Bahrain
- 5.3.6. Oman
- 5.4. Market Analysis, Insights and Forecast - by Region
- 5.4.1. Saudi Arabia
- 5.4.2. United Arab Emirates
- 5.4.3. Kuwait
- 5.4.4. Qatar
- 5.4.5. Bahrain
- 5.4.6. Oman
- 5.1. Market Analysis, Insights and Forecast - by Type
- 6. Saudi Arabia GCC Bottled Water Industry Analysis, Insights and Forecast, 2019-2031
- 6.1. Market Analysis, Insights and Forecast - by Type
- 6.1.1. Still Water
- 6.1.2. Sparkling Water
- 6.1.3. Functional Water
- 6.2. Market Analysis, Insights and Forecast - by Distribution Channel
- 6.2.1. Supermarkets/Hypermarkets
- 6.2.2. Convenience/Grocery Stores
- 6.2.3. On-trade Channels
- 6.2.4. Home and Office Delivery
- 6.2.5. Other Distribution Channels
- 6.3. Market Analysis, Insights and Forecast - by Geography
- 6.3.1. Saudi Arabia
- 6.3.2. United Arab Emirates
- 6.3.3. Kuwait
- 6.3.4. Qatar
- 6.3.5. Bahrain
- 6.3.6. Oman
- 6.1. Market Analysis, Insights and Forecast - by Type
- 7. United Arab Emirates GCC Bottled Water Industry Analysis, Insights and Forecast, 2019-2031
- 7.1. Market Analysis, Insights and Forecast - by Type
- 7.1.1. Still Water
- 7.1.2. Sparkling Water
- 7.1.3. Functional Water
- 7.2. Market Analysis, Insights and Forecast - by Distribution Channel
- 7.2.1. Supermarkets/Hypermarkets
- 7.2.2. Convenience/Grocery Stores
- 7.2.3. On-trade Channels
- 7.2.4. Home and Office Delivery
- 7.2.5. Other Distribution Channels
- 7.3. Market Analysis, Insights and Forecast - by Geography
- 7.3.1. Saudi Arabia
- 7.3.2. United Arab Emirates
- 7.3.3. Kuwait
- 7.3.4. Qatar
- 7.3.5. Bahrain
- 7.3.6. Oman
- 7.1. Market Analysis, Insights and Forecast - by Type
- 8. Kuwait GCC Bottled Water Industry Analysis, Insights and Forecast, 2019-2031
- 8.1. Market Analysis, Insights and Forecast - by Type
- 8.1.1. Still Water
- 8.1.2. Sparkling Water
- 8.1.3. Functional Water
- 8.2. Market Analysis, Insights and Forecast - by Distribution Channel
- 8.2.1. Supermarkets/Hypermarkets
- 8.2.2. Convenience/Grocery Stores
- 8.2.3. On-trade Channels
- 8.2.4. Home and Office Delivery
- 8.2.5. Other Distribution Channels
- 8.3. Market Analysis, Insights and Forecast - by Geography
- 8.3.1. Saudi Arabia
- 8.3.2. United Arab Emirates
- 8.3.3. Kuwait
- 8.3.4. Qatar
- 8.3.5. Bahrain
- 8.3.6. Oman
- 8.1. Market Analysis, Insights and Forecast - by Type
- 9. Qatar GCC Bottled Water Industry Analysis, Insights and Forecast, 2019-2031
- 9.1. Market Analysis, Insights and Forecast - by Type
- 9.1.1. Still Water
- 9.1.2. Sparkling Water
- 9.1.3. Functional Water
- 9.2. Market Analysis, Insights and Forecast - by Distribution Channel
- 9.2.1. Supermarkets/Hypermarkets
- 9.2.2. Convenience/Grocery Stores
- 9.2.3. On-trade Channels
- 9.2.4. Home and Office Delivery
- 9.2.5. Other Distribution Channels
- 9.3. Market Analysis, Insights and Forecast - by Geography
- 9.3.1. Saudi Arabia
- 9.3.2. United Arab Emirates
- 9.3.3. Kuwait
- 9.3.4. Qatar
- 9.3.5. Bahrain
- 9.3.6. Oman
- 9.1. Market Analysis, Insights and Forecast - by Type
- 10. Bahrain GCC Bottled Water Industry Analysis, Insights and Forecast, 2019-2031
- 10.1. Market Analysis, Insights and Forecast - by Type
- 10.1.1. Still Water
- 10.1.2. Sparkling Water
- 10.1.3. Functional Water
- 10.2. Market Analysis, Insights and Forecast - by Distribution Channel
- 10.2.1. Supermarkets/Hypermarkets
- 10.2.2. Convenience/Grocery Stores
- 10.2.3. On-trade Channels
- 10.2.4. Home and Office Delivery
- 10.2.5. Other Distribution Channels
- 10.3. Market Analysis, Insights and Forecast - by Geography
- 10.3.1. Saudi Arabia
- 10.3.2. United Arab Emirates
- 10.3.3. Kuwait
- 10.3.4. Qatar
- 10.3.5. Bahrain
- 10.3.6. Oman
- 10.1. Market Analysis, Insights and Forecast - by Type
- 11. Oman GCC Bottled Water Industry Analysis, Insights and Forecast, 2019-2031
- 11.1. Market Analysis, Insights and Forecast - by Type
- 11.1.1. Still Water
- 11.1.2. Sparkling Water
- 11.1.3. Functional Water
- 11.2. Market Analysis, Insights and Forecast - by Distribution Channel
- 11.2.1. Supermarkets/Hypermarkets
- 11.2.2. Convenience/Grocery Stores
- 11.2.3. On-trade Channels
- 11.2.4. Home and Office Delivery
- 11.2.5. Other Distribution Channels
- 11.3. Market Analysis, Insights and Forecast - by Geography
- 11.3.1. Saudi Arabia
- 11.3.2. United Arab Emirates
- 11.3.3. Kuwait
- 11.3.4. Qatar
- 11.3.5. Bahrain
- 11.3.6. Oman
- 11.1. Market Analysis, Insights and Forecast - by Type
- 12. North America GCC Bottled Water Industry Analysis, Insights and Forecast, 2019-2031
- 12.1. Market Analysis, Insights and Forecast - By Country/Sub-region
- 12.1.1 United States
- 12.1.2 Canada
- 12.1.3 Mexico
- 13. Europe GCC Bottled Water Industry Analysis, Insights and Forecast, 2019-2031
- 13.1. Market Analysis, Insights and Forecast - By Country/Sub-region
- 13.1.1 Germany
- 13.1.2 United Kingdom
- 13.1.3 France
- 13.1.4 Spain
- 13.1.5 Italy
- 13.1.6 Spain
- 13.1.7 Belgium
- 13.1.8 Netherland
- 13.1.9 Nordics
- 13.1.10 Rest of Europe
- 14. Asia Pacific GCC Bottled Water Industry Analysis, Insights and Forecast, 2019-2031
- 14.1. Market Analysis, Insights and Forecast - By Country/Sub-region
- 14.1.1 China
- 14.1.2 Japan
- 14.1.3 India
- 14.1.4 South Korea
- 14.1.5 Southeast Asia
- 14.1.6 Australia
- 14.1.7 Indonesia
- 14.1.8 Phillipes
- 14.1.9 Singapore
- 14.1.10 Thailandc
- 14.1.11 Rest of Asia Pacific
- 15. South America GCC Bottled Water Industry Analysis, Insights and Forecast, 2019-2031
- 15.1. Market Analysis, Insights and Forecast - By Country/Sub-region
- 15.1.1 Brazil
- 15.1.2 Argentina
- 15.1.3 Peru
- 15.1.4 Chile
- 15.1.5 Colombia
- 15.1.6 Ecuador
- 15.1.7 Venezuela
- 15.1.8 Rest of South America
- 16. North America GCC Bottled Water Industry Analysis, Insights and Forecast, 2019-2031
- 16.1. Market Analysis, Insights and Forecast - By Country/Sub-region
- 16.1.1 United States
- 16.1.2 Canada
- 16.1.3 Mexico
- 17. MEA GCC Bottled Water Industry Analysis, Insights and Forecast, 2019-2031
- 17.1. Market Analysis, Insights and Forecast - By Country/Sub-region
- 17.1.1 United Arab Emirates
- 17.1.2 Saudi Arabia
- 17.1.3 South Africa
- 17.1.4 Rest of Middle East and Africa
- 18. Competitive Analysis
- 18.1. Global Market Share Analysis 2024
- 18.2. Company Profiles
- 18.2.1 Danone SA*List Not Exhaustive
- 18.2.1.1. Overview
- 18.2.1.2. Products
- 18.2.1.3. SWOT Analysis
- 18.2.1.4. Recent Developments
- 18.2.1.5. Financials (Based on Availability)
- 18.2.2 Nestle SA
- 18.2.2.1. Overview
- 18.2.2.2. Products
- 18.2.2.3. SWOT Analysis
- 18.2.2.4. Recent Developments
- 18.2.2.5. Financials (Based on Availability)
- 18.2.3 Crystal Mineral Water & Refreshments LLC Co
- 18.2.3.1. Overview
- 18.2.3.2. Products
- 18.2.3.3. SWOT Analysis
- 18.2.3.4. Recent Developments
- 18.2.3.5. Financials (Based on Availability)
- 18.2.4 Masafi Inc
- 18.2.4.1. Overview
- 18.2.4.2. Products
- 18.2.4.3. SWOT Analysis
- 18.2.4.4. Recent Developments
- 18.2.4.5. Financials (Based on Availability)
- 18.2.5 Agthia Group PJSC
- 18.2.5.1. Overview
- 18.2.5.2. Products
- 18.2.5.3. SWOT Analysis
- 18.2.5.4. Recent Developments
- 18.2.5.5. Financials (Based on Availability)
- 18.2.6 PepsiCo Inc
- 18.2.6.1. Overview
- 18.2.6.2. Products
- 18.2.6.3. SWOT Analysis
- 18.2.6.4. Recent Developments
- 18.2.6.5. Financials (Based on Availability)
- 18.2.7 Al-Qassim Water
- 18.2.7.1. Overview
- 18.2.7.2. Products
- 18.2.7.3. SWOT Analysis
- 18.2.7.4. Recent Developments
- 18.2.7.5. Financials (Based on Availability)
- 18.2.8 New Technology Bottling Company (NTBC) KSCC
- 18.2.8.1. Overview
- 18.2.8.2. Products
- 18.2.8.3. SWOT Analysis
- 18.2.8.4. Recent Developments
- 18.2.8.5. Financials (Based on Availability)
- 18.2.9 ALGhadeer Drinking Water LLC
- 18.2.9.1. Overview
- 18.2.9.2. Products
- 18.2.9.3. SWOT Analysis
- 18.2.9.4. Recent Developments
- 18.2.9.5. Financials (Based on Availability)
- 18.2.10 Al-Rawdatain Water Bottling Co
- 18.2.10.1. Overview
- 18.2.10.2. Products
- 18.2.10.3. SWOT Analysis
- 18.2.10.4. Recent Developments
- 18.2.10.5. Financials (Based on Availability)
- 18.2.11 Al Furat Drinking Water LLC
- 18.2.11.1. Overview
- 18.2.11.2. Products
- 18.2.11.3. SWOT Analysis
- 18.2.11.4. Recent Developments
- 18.2.11.5. Financials (Based on Availability)
- 18.2.1 Danone SA*List Not Exhaustive
List of Figures
- Figure 1: Global GCC Bottled Water Industry Revenue Breakdown (Million, %) by Region 2024 & 2032
- Figure 2: North America GCC Bottled Water Industry Revenue (Million), by Country 2024 & 2032
- Figure 3: North America GCC Bottled Water Industry Revenue Share (%), by Country 2024 & 2032
- Figure 4: Europe GCC Bottled Water Industry Revenue (Million), by Country 2024 & 2032
- Figure 5: Europe GCC Bottled Water Industry Revenue Share (%), by Country 2024 & 2032
- Figure 6: Asia Pacific GCC Bottled Water Industry Revenue (Million), by Country 2024 & 2032
- Figure 7: Asia Pacific GCC Bottled Water Industry Revenue Share (%), by Country 2024 & 2032
- Figure 8: South America GCC Bottled Water Industry Revenue (Million), by Country 2024 & 2032
- Figure 9: South America GCC Bottled Water Industry Revenue Share (%), by Country 2024 & 2032
- Figure 10: North America GCC Bottled Water Industry Revenue (Million), by Country 2024 & 2032
- Figure 11: North America GCC Bottled Water Industry Revenue Share (%), by Country 2024 & 2032
- Figure 12: MEA GCC Bottled Water Industry Revenue (Million), by Country 2024 & 2032
- Figure 13: MEA GCC Bottled Water Industry Revenue Share (%), by Country 2024 & 2032
- Figure 14: Saudi Arabia GCC Bottled Water Industry Revenue (Million), by Type 2024 & 2032
- Figure 15: Saudi Arabia GCC Bottled Water Industry Revenue Share (%), by Type 2024 & 2032
- Figure 16: Saudi Arabia GCC Bottled Water Industry Revenue (Million), by Distribution Channel 2024 & 2032
- Figure 17: Saudi Arabia GCC Bottled Water Industry Revenue Share (%), by Distribution Channel 2024 & 2032
- Figure 18: Saudi Arabia GCC Bottled Water Industry Revenue (Million), by Geography 2024 & 2032
- Figure 19: Saudi Arabia GCC Bottled Water Industry Revenue Share (%), by Geography 2024 & 2032
- Figure 20: Saudi Arabia GCC Bottled Water Industry Revenue (Million), by Country 2024 & 2032
- Figure 21: Saudi Arabia GCC Bottled Water Industry Revenue Share (%), by Country 2024 & 2032
- Figure 22: United Arab Emirates GCC Bottled Water Industry Revenue (Million), by Type 2024 & 2032
- Figure 23: United Arab Emirates GCC Bottled Water Industry Revenue Share (%), by Type 2024 & 2032
- Figure 24: United Arab Emirates GCC Bottled Water Industry Revenue (Million), by Distribution Channel 2024 & 2032
- Figure 25: United Arab Emirates GCC Bottled Water Industry Revenue Share (%), by Distribution Channel 2024 & 2032
- Figure 26: United Arab Emirates GCC Bottled Water Industry Revenue (Million), by Geography 2024 & 2032
- Figure 27: United Arab Emirates GCC Bottled Water Industry Revenue Share (%), by Geography 2024 & 2032
- Figure 28: United Arab Emirates GCC Bottled Water Industry Revenue (Million), by Country 2024 & 2032
- Figure 29: United Arab Emirates GCC Bottled Water Industry Revenue Share (%), by Country 2024 & 2032
- Figure 30: Kuwait GCC Bottled Water Industry Revenue (Million), by Type 2024 & 2032
- Figure 31: Kuwait GCC Bottled Water Industry Revenue Share (%), by Type 2024 & 2032
- Figure 32: Kuwait GCC Bottled Water Industry Revenue (Million), by Distribution Channel 2024 & 2032
- Figure 33: Kuwait GCC Bottled Water Industry Revenue Share (%), by Distribution Channel 2024 & 2032
- Figure 34: Kuwait GCC Bottled Water Industry Revenue (Million), by Geography 2024 & 2032
- Figure 35: Kuwait GCC Bottled Water Industry Revenue Share (%), by Geography 2024 & 2032
- Figure 36: Kuwait GCC Bottled Water Industry Revenue (Million), by Country 2024 & 2032
- Figure 37: Kuwait GCC Bottled Water Industry Revenue Share (%), by Country 2024 & 2032
- Figure 38: Qatar GCC Bottled Water Industry Revenue (Million), by Type 2024 & 2032
- Figure 39: Qatar GCC Bottled Water Industry Revenue Share (%), by Type 2024 & 2032
- Figure 40: Qatar GCC Bottled Water Industry Revenue (Million), by Distribution Channel 2024 & 2032
- Figure 41: Qatar GCC Bottled Water Industry Revenue Share (%), by Distribution Channel 2024 & 2032
- Figure 42: Qatar GCC Bottled Water Industry Revenue (Million), by Geography 2024 & 2032
- Figure 43: Qatar GCC Bottled Water Industry Revenue Share (%), by Geography 2024 & 2032
- Figure 44: Qatar GCC Bottled Water Industry Revenue (Million), by Country 2024 & 2032
- Figure 45: Qatar GCC Bottled Water Industry Revenue Share (%), by Country 2024 & 2032
- Figure 46: Bahrain GCC Bottled Water Industry Revenue (Million), by Type 2024 & 2032
- Figure 47: Bahrain GCC Bottled Water Industry Revenue Share (%), by Type 2024 & 2032
- Figure 48: Bahrain GCC Bottled Water Industry Revenue (Million), by Distribution Channel 2024 & 2032
- Figure 49: Bahrain GCC Bottled Water Industry Revenue Share (%), by Distribution Channel 2024 & 2032
- Figure 50: Bahrain GCC Bottled Water Industry Revenue (Million), by Geography 2024 & 2032
- Figure 51: Bahrain GCC Bottled Water Industry Revenue Share (%), by Geography 2024 & 2032
- Figure 52: Bahrain GCC Bottled Water Industry Revenue (Million), by Country 2024 & 2032
- Figure 53: Bahrain GCC Bottled Water Industry Revenue Share (%), by Country 2024 & 2032
- Figure 54: Oman GCC Bottled Water Industry Revenue (Million), by Type 2024 & 2032
- Figure 55: Oman GCC Bottled Water Industry Revenue Share (%), by Type 2024 & 2032
- Figure 56: Oman GCC Bottled Water Industry Revenue (Million), by Distribution Channel 2024 & 2032
- Figure 57: Oman GCC Bottled Water Industry Revenue Share (%), by Distribution Channel 2024 & 2032
- Figure 58: Oman GCC Bottled Water Industry Revenue (Million), by Geography 2024 & 2032
- Figure 59: Oman GCC Bottled Water Industry Revenue Share (%), by Geography 2024 & 2032
- Figure 60: Oman GCC Bottled Water Industry Revenue (Million), by Country 2024 & 2032
- Figure 61: Oman GCC Bottled Water Industry Revenue Share (%), by Country 2024 & 2032
List of Tables
- Table 1: Global GCC Bottled Water Industry Revenue Million Forecast, by Region 2019 & 2032
- Table 2: Global GCC Bottled Water Industry Revenue Million Forecast, by Type 2019 & 2032
- Table 3: Global GCC Bottled Water Industry Revenue Million Forecast, by Distribution Channel 2019 & 2032
- Table 4: Global GCC Bottled Water Industry Revenue Million Forecast, by Geography 2019 & 2032
- Table 5: Global GCC Bottled Water Industry Revenue Million Forecast, by Region 2019 & 2032
- Table 6: Global GCC Bottled Water Industry Revenue Million Forecast, by Country 2019 & 2032
- Table 7: United States GCC Bottled Water Industry Revenue (Million) Forecast, by Application 2019 & 2032
- Table 8: Canada GCC Bottled Water Industry Revenue (Million) Forecast, by Application 2019 & 2032
- Table 9: Mexico GCC Bottled Water Industry Revenue (Million) Forecast, by Application 2019 & 2032
- Table 10: Global GCC Bottled Water Industry Revenue Million Forecast, by Country 2019 & 2032
- Table 11: Germany GCC Bottled Water Industry Revenue (Million) Forecast, by Application 2019 & 2032
- Table 12: United Kingdom GCC Bottled Water Industry Revenue (Million) Forecast, by Application 2019 & 2032
- Table 13: France GCC Bottled Water Industry Revenue (Million) Forecast, by Application 2019 & 2032
- Table 14: Spain GCC Bottled Water Industry Revenue (Million) Forecast, by Application 2019 & 2032
- Table 15: Italy GCC Bottled Water Industry Revenue (Million) Forecast, by Application 2019 & 2032
- Table 16: Spain GCC Bottled Water Industry Revenue (Million) Forecast, by Application 2019 & 2032
- Table 17: Belgium GCC Bottled Water Industry Revenue (Million) Forecast, by Application 2019 & 2032
- Table 18: Netherland GCC Bottled Water Industry Revenue (Million) Forecast, by Application 2019 & 2032
- Table 19: Nordics GCC Bottled Water Industry Revenue (Million) Forecast, by Application 2019 & 2032
- Table 20: Rest of Europe GCC Bottled Water Industry Revenue (Million) Forecast, by Application 2019 & 2032
- Table 21: Global GCC Bottled Water Industry Revenue Million Forecast, by Country 2019 & 2032
- Table 22: China GCC Bottled Water Industry Revenue (Million) Forecast, by Application 2019 & 2032
- Table 23: Japan GCC Bottled Water Industry Revenue (Million) Forecast, by Application 2019 & 2032
- Table 24: India GCC Bottled Water Industry Revenue (Million) Forecast, by Application 2019 & 2032
- Table 25: South Korea GCC Bottled Water Industry Revenue (Million) Forecast, by Application 2019 & 2032
- Table 26: Southeast Asia GCC Bottled Water Industry Revenue (Million) Forecast, by Application 2019 & 2032
- Table 27: Australia GCC Bottled Water Industry Revenue (Million) Forecast, by Application 2019 & 2032
- Table 28: Indonesia GCC Bottled Water Industry Revenue (Million) Forecast, by Application 2019 & 2032
- Table 29: Phillipes GCC Bottled Water Industry Revenue (Million) Forecast, by Application 2019 & 2032
- Table 30: Singapore GCC Bottled Water Industry Revenue (Million) Forecast, by Application 2019 & 2032
- Table 31: Thailandc GCC Bottled Water Industry Revenue (Million) Forecast, by Application 2019 & 2032
- Table 32: Rest of Asia Pacific GCC Bottled Water Industry Revenue (Million) Forecast, by Application 2019 & 2032
- Table 33: Global GCC Bottled Water Industry Revenue Million Forecast, by Country 2019 & 2032
- Table 34: Brazil GCC Bottled Water Industry Revenue (Million) Forecast, by Application 2019 & 2032
- Table 35: Argentina GCC Bottled Water Industry Revenue (Million) Forecast, by Application 2019 & 2032
- Table 36: Peru GCC Bottled Water Industry Revenue (Million) Forecast, by Application 2019 & 2032
- Table 37: Chile GCC Bottled Water Industry Revenue (Million) Forecast, by Application 2019 & 2032
- Table 38: Colombia GCC Bottled Water Industry Revenue (Million) Forecast, by Application 2019 & 2032
- Table 39: Ecuador GCC Bottled Water Industry Revenue (Million) Forecast, by Application 2019 & 2032
- Table 40: Venezuela GCC Bottled Water Industry Revenue (Million) Forecast, by Application 2019 & 2032
- Table 41: Rest of South America GCC Bottled Water Industry Revenue (Million) Forecast, by Application 2019 & 2032
- Table 42: Global GCC Bottled Water Industry Revenue Million Forecast, by Country 2019 & 2032
- Table 43: United States GCC Bottled Water Industry Revenue (Million) Forecast, by Application 2019 & 2032
- Table 44: Canada GCC Bottled Water Industry Revenue (Million) Forecast, by Application 2019 & 2032
- Table 45: Mexico GCC Bottled Water Industry Revenue (Million) Forecast, by Application 2019 & 2032
- Table 46: Global GCC Bottled Water Industry Revenue Million Forecast, by Country 2019 & 2032
- Table 47: United Arab Emirates GCC Bottled Water Industry Revenue (Million) Forecast, by Application 2019 & 2032
- Table 48: Saudi Arabia GCC Bottled Water Industry Revenue (Million) Forecast, by Application 2019 & 2032
- Table 49: South Africa GCC Bottled Water Industry Revenue (Million) Forecast, by Application 2019 & 2032
- Table 50: Rest of Middle East and Africa GCC Bottled Water Industry Revenue (Million) Forecast, by Application 2019 & 2032
- Table 51: Global GCC Bottled Water Industry Revenue Million Forecast, by Type 2019 & 2032
- Table 52: Global GCC Bottled Water Industry Revenue Million Forecast, by Distribution Channel 2019 & 2032
- Table 53: Global GCC Bottled Water Industry Revenue Million Forecast, by Geography 2019 & 2032
- Table 54: Global GCC Bottled Water Industry Revenue Million Forecast, by Country 2019 & 2032
- Table 55: Global GCC Bottled Water Industry Revenue Million Forecast, by Type 2019 & 2032
- Table 56: Global GCC Bottled Water Industry Revenue Million Forecast, by Distribution Channel 2019 & 2032
- Table 57: Global GCC Bottled Water Industry Revenue Million Forecast, by Geography 2019 & 2032
- Table 58: Global GCC Bottled Water Industry Revenue Million Forecast, by Country 2019 & 2032
- Table 59: Global GCC Bottled Water Industry Revenue Million Forecast, by Type 2019 & 2032
- Table 60: Global GCC Bottled Water Industry Revenue Million Forecast, by Distribution Channel 2019 & 2032
- Table 61: Global GCC Bottled Water Industry Revenue Million Forecast, by Geography 2019 & 2032
- Table 62: Global GCC Bottled Water Industry Revenue Million Forecast, by Country 2019 & 2032
- Table 63: Global GCC Bottled Water Industry Revenue Million Forecast, by Type 2019 & 2032
- Table 64: Global GCC Bottled Water Industry Revenue Million Forecast, by Distribution Channel 2019 & 2032
- Table 65: Global GCC Bottled Water Industry Revenue Million Forecast, by Geography 2019 & 2032
- Table 66: Global GCC Bottled Water Industry Revenue Million Forecast, by Country 2019 & 2032
- Table 67: Global GCC Bottled Water Industry Revenue Million Forecast, by Type 2019 & 2032
- Table 68: Global GCC Bottled Water Industry Revenue Million Forecast, by Distribution Channel 2019 & 2032
- Table 69: Global GCC Bottled Water Industry Revenue Million Forecast, by Geography 2019 & 2032
- Table 70: Global GCC Bottled Water Industry Revenue Million Forecast, by Country 2019 & 2032
- Table 71: Global GCC Bottled Water Industry Revenue Million Forecast, by Type 2019 & 2032
- Table 72: Global GCC Bottled Water Industry Revenue Million Forecast, by Distribution Channel 2019 & 2032
- Table 73: Global GCC Bottled Water Industry Revenue Million Forecast, by Geography 2019 & 2032
- Table 74: Global GCC Bottled Water Industry Revenue Million Forecast, by Country 2019 & 2032
Frequently Asked Questions
1. What is the projected Compound Annual Growth Rate (CAGR) of the GCC Bottled Water Industry?
The projected CAGR is approximately 11.16%.
2. Which companies are prominent players in the GCC Bottled Water Industry?
Key companies in the market include Danone SA*List Not Exhaustive, Nestle SA, Crystal Mineral Water & Refreshments LLC Co, Masafi Inc, Agthia Group PJSC, PepsiCo Inc, Al-Qassim Water, New Technology Bottling Company (NTBC) KSCC, ALGhadeer Drinking Water LLC, Al-Rawdatain Water Bottling Co, Al Furat Drinking Water LLC.
3. What are the main segments of the GCC Bottled Water Industry?
The market segments include Type, Distribution Channel, Geography.
4. Can you provide details about the market size?
The market size is estimated to be USD 6.79 Million as of 2022.
5. What are some drivers contributing to market growth?
Growth In Foodservice Expenditure and Tourism Sector; Premiumization with the Growth of Fortified and Flavored Water.
6. What are the notable trends driving market growth?
Scarce Water Resources Leading to Increasing Dependency on Packaged Drinking Water.
7. Are there any restraints impacting market growth?
Concerns Regarding Plastic Waste and the Rising Inclination Toward Tap Water.
8. Can you provide examples of recent developments in the market?
N/A
9. What pricing options are available for accessing the report?
Pricing options include single-user, multi-user, and enterprise licenses priced at USD 4750, USD 5250, and USD 8750 respectively.
10. Is the market size provided in terms of value or volume?
The market size is provided in terms of value, measured in Million.
11. Are there any specific market keywords associated with the report?
Yes, the market keyword associated with the report is "GCC Bottled Water Industry," which aids in identifying and referencing the specific market segment covered.
12. How do I determine which pricing option suits my needs best?
The pricing options vary based on user requirements and access needs. Individual users may opt for single-user licenses, while businesses requiring broader access may choose multi-user or enterprise licenses for cost-effective access to the report.
13. Are there any additional resources or data provided in the GCC Bottled Water Industry report?
While the report offers comprehensive insights, it's advisable to review the specific contents or supplementary materials provided to ascertain if additional resources or data are available.
14. How can I stay updated on further developments or reports in the GCC Bottled Water Industry?
To stay informed about further developments, trends, and reports in the GCC Bottled Water Industry, consider subscribing to industry newsletters, following relevant companies and organizations, or regularly checking reputable industry news sources and publications.
Methodology
Step 1 - Identification of Relevant Samples Size from Population Database


Step 2 - Approaches for Defining Global Market Size (Value, Volume* & Price*)

Note*: In applicable scenarios
Step 3 - Data Sources
Primary Research
- Web Analytics
- Survey Reports
- Research Institute
- Latest Research Reports
- Opinion Leaders
Secondary Research
- Annual Reports
- White Paper
- Latest Press Release
- Industry Association
- Paid Database
- Investor Presentations

Step 4 - Data Triangulation
Involves using different sources of information in order to increase the validity of a study
These sources are likely to be stakeholders in a program - participants, other researchers, program staff, other community members, and so on.
Then we put all data in single framework & apply various statistical tools to find out the dynamic on the market.
During the analysis stage, feedback from the stakeholder groups would be compared to determine areas of agreement as well as areas of divergence
