

Key Insights
The Functional Near-Infrared Spectroscopy (fNIRS) brain imaging market is experiencing robust growth, driven by increasing applications in neurological and psychological research, as well as its expanding clinical utility. The market's Compound Annual Growth Rate (CAGR) of 5.65% from 2019 to 2024 suggests a significant upward trajectory, projected to continue throughout the forecast period (2025-2033). Key drivers include the non-invasive nature of fNIRS, its portability and affordability compared to other neuroimaging techniques like fMRI, and its growing acceptance in diverse clinical settings like hospitals and diagnostic centers. The rising prevalence of neurological disorders such as Parkinson's disease, epilepsy, dementia, and traumatic brain injury is fueling demand for accurate and accessible brain imaging solutions. Furthermore, technological advancements leading to improved spatial and temporal resolution of fNIRS systems contribute significantly to market expansion. The segment focusing on Parkinson's disease applications likely holds a substantial market share due to the high prevalence of this condition and the need for effective diagnostic and monitoring tools. While the market faces potential restraints from the limitations of fNIRS in penetrating deep brain regions and the need for skilled professionals for accurate data interpretation, the overall positive outlook is reinforced by ongoing research and development efforts focused on improving the technology and expanding its applications. The geographic distribution suggests a strong presence in North America and Europe initially, with the Asia-Pacific region anticipated to show significant growth in the coming years driven by increased healthcare spending and technological adoption.
The competitive landscape includes a mix of established players and emerging companies, indicating a dynamic market environment. Major companies are investing in research and development to improve the technology and expand into new applications, creating opportunities for strategic partnerships and collaborations. The market's continued growth hinges on successfully addressing the limitations of fNIRS and continued innovation to broaden its clinical utility beyond its current applications. This includes improving data processing and analysis techniques, as well as expanding its role in real-time brain monitoring for various clinical applications. The integration of fNIRS with other neuroimaging modalities could further enhance its diagnostic capabilities and market appeal, leading to a future where fNIRS plays an increasingly important role in neurology and related fields.
Functional Near-infrared Optical Brain Imaging Market Report: 2019-2033
This comprehensive report provides an in-depth analysis of the Functional Near-infrared Optical Brain Imaging (fNIRS) market, offering valuable insights for stakeholders seeking to understand market trends, growth opportunities, and competitive dynamics. Covering the period from 2019 to 2033, with a base year of 2025 and a forecast period of 2025-2033, this report meticulously examines market size, segmentation, key players, and future prospects. The market is expected to reach xx Million by 2033.
Functional Near-infrared Optical Brain Imaging Market Composition & Trends
This section delves into the intricate landscape of the fNIRS market, examining market concentration, innovation drivers, regulatory frameworks, substitute technologies, end-user profiles, and mergers and acquisitions (M&A) activities. The market exhibits a moderately concentrated structure, with key players holding significant market share. However, the emergence of innovative startups and technological advancements are gradually shifting the competitive landscape.
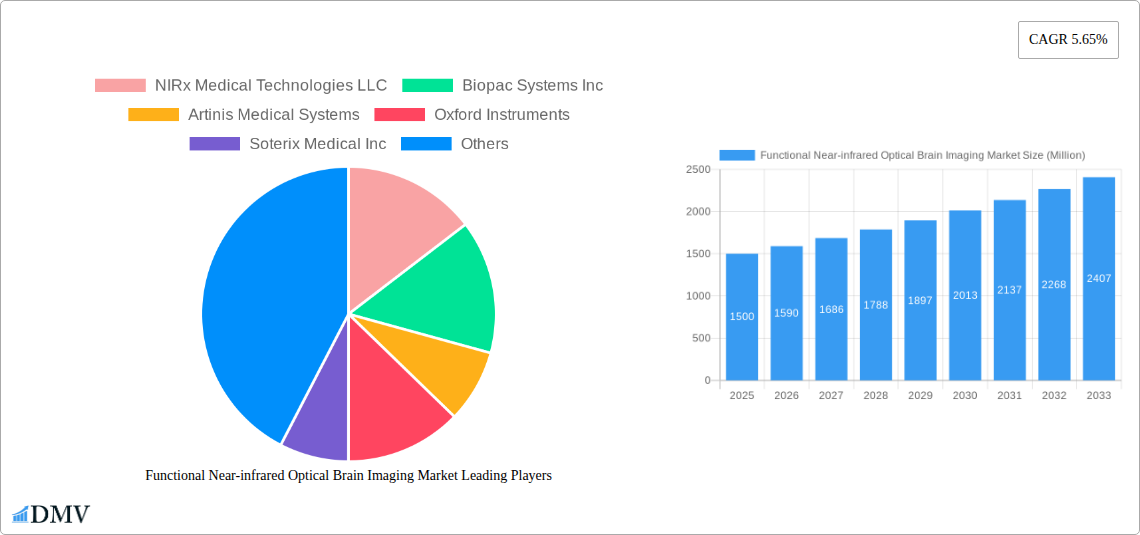
Market Share Distribution (2024): NIRx Medical Technologies LLC holds an estimated xx% market share, followed by Biopac Systems Inc. at xx%, Artinis Medical Systems at xx%, and other players accounting for the remaining xx%. M&A activity in the sector has been relatively moderate, with reported deal values totaling approximately xx Million in the past five years. Specific details of larger deals will be outlined in the full report.
Innovation Catalysts: Ongoing research into improving fNIRS technology, particularly in enhancing spatial resolution and depth penetration, is a major driver. Miniaturization efforts, including the development of wearable fNIRS systems, are further expanding the market’s reach.
Regulatory Landscape: The regulatory environment varies across different regions. Compliance with relevant medical device regulations, such as those set by the FDA and similar international bodies, heavily influences market access and product approvals.
Substitute Products: Other neuroimaging techniques, such as EEG and fMRI, compete with fNIRS. However, fNIRS' portability, cost-effectiveness, and non-invasive nature offer distinct advantages.
End-User Profiles: The primary end-users are hospitals and diagnostic centers, with growing adoption in research institutions and specialized clinics.
Functional Near-infrared Optical Brain Imaging Market Industry Evolution
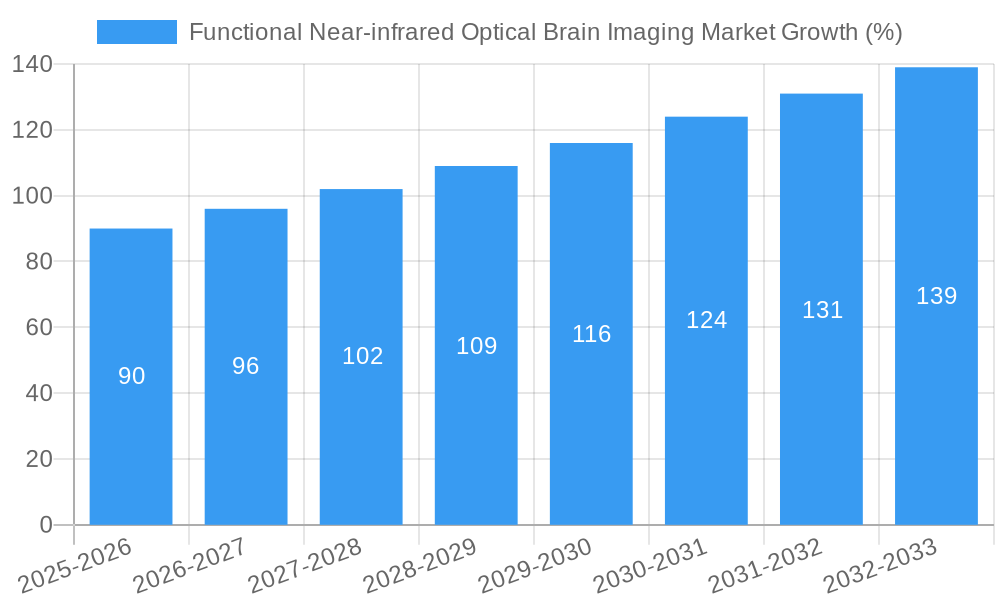
This section analyzes the historical and projected growth trajectories of the fNIRS market, technological advancements, and evolving consumer needs. The market experienced a Compound Annual Growth Rate (CAGR) of xx% during the historical period (2019-2024). This growth is attributed to the increasing prevalence of neurological disorders, rising demand for non-invasive brain imaging techniques, and continuous technological improvements. The forecast period (2025-2033) anticipates a CAGR of xx%, driven by factors such as the development of advanced fNIRS systems, expanding applications, and increased research funding. Adoption rates are projected to increase significantly in the coming years, especially in emerging markets. Detailed data on regional growth trends and adoption metrics by application and end-user will be presented within the complete report.
Leading Regions, Countries, or Segments in Functional Near-infrared Optical Brain Imaging Market
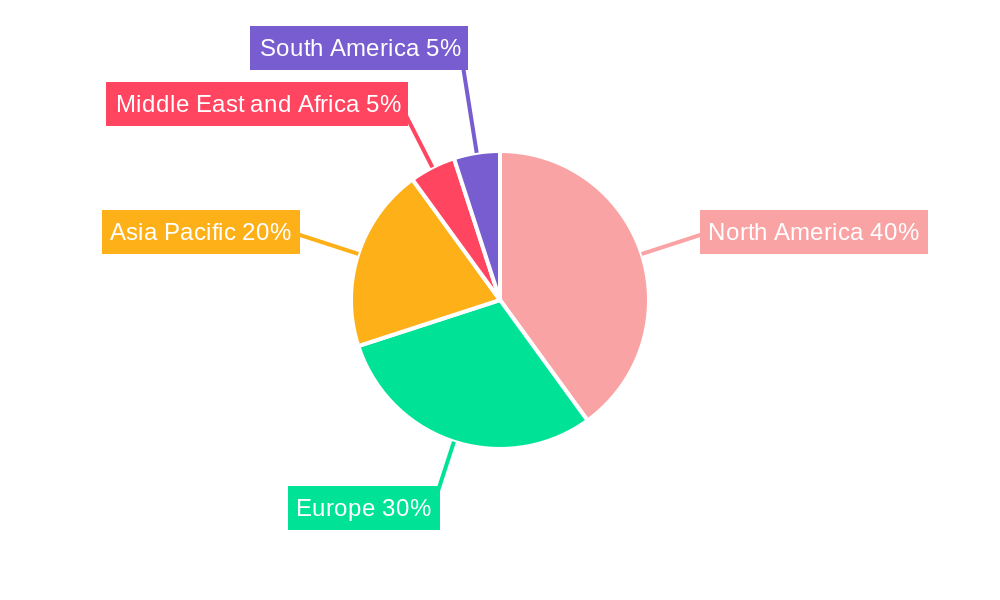
North America currently dominates the fNIRS market, driven by high healthcare expenditure, advanced research infrastructure, and early adoption of innovative technologies. However, Asia-Pacific is projected to experience significant growth in the coming years, fueled by rising healthcare awareness, increasing prevalence of neurological disorders, and growing government investments in healthcare infrastructure.
Key Drivers for North America Dominance:
- High per capita healthcare expenditure.
- Strong regulatory support for medical device innovation.
- Presence of major fNIRS technology developers and manufacturers.
- Extensive research funding for neuroscience applications.
Key Drivers for Asia-Pacific Growth:
- Increasing prevalence of neurological disorders like stroke and dementia.
- Rising healthcare awareness and expenditure.
- Growing government investments in healthcare infrastructure.
- Increased research activities in the neuroscience field.
Leading Application Segments: Parkinson's Disease, Epilepsy, and Traumatic Brain Injury represent the largest application segments, driven by the need for accurate and real-time monitoring of brain activity in these conditions. The Other Application Types segment encompasses a wide range of applications, including brain-computer interfaces and cognitive neuroscience research. Hospitals are the largest end-user segment, representing a considerable share of total market revenue.
Functional Near-infrared Optical Brain Imaging Market Product Innovations
Recent innovations in fNIRS technology focus on improving spatial resolution, depth penetration, and portability. The development of wearable and wireless fNIRS systems significantly enhances usability and expands applications beyond clinical settings. Advanced signal processing algorithms and improved data analysis techniques enhance the accuracy and reliability of fNIRS measurements. Key innovations include improvements in light source technology, detector sensitivity, and sophisticated data analysis software. These advancements are leading to more accurate and reliable brain activity maps, opening up new possibilities for diagnosis, monitoring, and treatment of various neurological conditions.
Propelling Factors for Functional Near-infrared Optical Brain Imaging Market Growth
Several factors drive the growth of the fNIRS market. Technological advancements, including miniaturization and improved data analysis, are making fNIRS more accessible and user-friendly. The increasing prevalence of neurological disorders creates a high demand for effective diagnostic and monitoring tools. Favorable regulatory environments in several key markets and substantial research funding aimed at understanding brain function and disease further propel the market's expansion. The cost-effectiveness and non-invasive nature of fNIRS, compared to other neuroimaging techniques, also contributes to its market appeal.
Obstacles in the Functional Near-infrared Optical Brain Imaging Market
Despite its potential, the fNIRS market faces some challenges. The relatively low spatial resolution compared to other techniques like fMRI remains a limitation. High initial investment costs can hinder adoption in resource-constrained settings. Furthermore, the market faces competitive pressures from established neuroimaging modalities and the need for skilled personnel to operate and interpret the data. Supply chain disruptions related to specific components of fNIRS systems have also impacted growth. The market is also subject to the complexities of obtaining regulatory approvals in different regions.
Future Opportunities in Functional Near-infrared Optical Brain Imaging Market
The future of the fNIRS market looks promising. Expansion into new applications, including sports medicine and early childhood development, presents considerable growth opportunities. Integration with other neuroimaging modalities, such as EEG, to create multimodal imaging systems will enhance diagnostic capabilities. Continued advancements in signal processing algorithms and artificial intelligence (AI)-driven data analysis will improve the accuracy and efficiency of fNIRS. The development of more portable and user-friendly systems is expected to drive wider adoption in various sectors.
Major Players in the Functional Near-infrared Optical Brain Imaging Market Ecosystem
- NIRx Medical Technologies LLC
- Biopac Systems Inc
- Artinis Medical Systems
- Oxford Instruments
- Soterix Medical Inc
- Gowerlabs Ltd
- Fujifilm Holdings Corporation (Hitachi Ltd)
- PerkinElmer Inc
- Shimadzu Corporation
Key Developments in Functional Near-infrared Optical Brain Imaging Market Industry
March 2022: Kernel launched Kernel Flow, a wearable TD-fNIRS headset, enabling high-resolution brain measurement. This development significantly advanced the accessibility and practicality of fNIRS technology.
March 2022: MYndspan launched a brain imaging service using brain connectivity measures at Aston University. This service broadened the application of fNIRS in brain health assessment. These developments highlight the increasing sophistication and applications of fNIRS technology and underscore its potential for growth within the neurotechnology sector.
Strategic Functional Near-infrared Optical Brain Imaging Market Forecast
The fNIRS market is poised for substantial growth, driven by technological advancements, expanding applications, and increased healthcare spending. The focus on miniaturization, improved data analysis techniques, and the integration of fNIRS with other modalities will create new opportunities in diverse sectors. The market's potential extends to various healthcare settings and research applications, making it an attractive area for investment and innovation. The increasing prevalence of neurological and mental health conditions is further contributing to the market's expansive future.
Functional Near-infrared Optical Brain Imaging Market Segmentation
-
1. Application Type
- 1.1. Parkinson's Disease
- 1.2. Epilepsy
- 1.3. Dementia
- 1.4. Traumatic Brain Injury
- 1.5. Sleep Disorders
- 1.6. Other Application Types
-
2. End-User
- 2.1. Hospitals
- 2.2. Diagnostic Centers
Functional Near-infrared Optical Brain Imaging Market Segmentation By Geography
-
1. North America
- 1.1. United States
- 1.2. Canada
- 1.3. Mexico
-
2. Europe
- 2.1. Germany
- 2.2. United Kingdom
- 2.3. France
- 2.4. Italy
- 2.5. Spain
- 2.6. Rest of Europe
-
3. Asia Pacific
- 3.1. China
- 3.2. Japan
- 3.3. India
- 3.4. Australia
- 3.5. South Korea
- 3.6. Rest of Asia Pacific
-
4. Middle East and Africa
- 4.1. GCC
- 4.2. South Africa
- 4.3. Rest of Middle East and Africa
-
5. South America
- 5.1. Brazil
- 5.2. Argentina
- 5.3. Rest of South America
Functional Near-infrared Optical Brain Imaging Market REPORT HIGHLIGHTS
| Aspects | Details |
|---|---|
| Study Period | 2019-2033 |
| Base Year | 2024 |
| Estimated Year | 2025 |
| Forecast Period | 2025-2033 |
| Historical Period | 2019-2024 |
| Growth Rate | CAGR of 5.65% from 2019-2033 |
| Segmentation |
|
Table of Contents
- 1. Introduction
- 1.1. Research Scope
- 1.2. Market Segmentation
- 1.3. Research Methodology
- 1.4. Definitions and Assumptions
- 2. Executive Summary
- 2.1. Introduction
- 3. Market Dynamics
- 3.1. Introduction
- 3.2. Market Drivers
- 3.2.1. Rising Prevalence of Neurological Disorders; Emerging Trends in Products
- 3.3. Market Restrains
- 3.3.1. Lack of Skilled Professionals
- 3.4. Market Trends
- 3.4.1. Traumatic Brain Injury Segment Expects to Register a Strong Growth in the Forecast Period
- 4. Market Factor Analysis
- 4.1. Porters Five Forces
- 4.2. Supply/Value Chain
- 4.3. PESTEL analysis
- 4.4. Market Entropy
- 4.5. Patent/Trademark Analysis
- 5. Global Functional Near-infrared Optical Brain Imaging Market Analysis, Insights and Forecast, 2019-2031
- 5.1. Market Analysis, Insights and Forecast - by Application Type
- 5.1.1. Parkinson's Disease
- 5.1.2. Epilepsy
- 5.1.3. Dementia
- 5.1.4. Traumatic Brain Injury
- 5.1.5. Sleep Disorders
- 5.1.6. Other Application Types
- 5.2. Market Analysis, Insights and Forecast - by End-User
- 5.2.1. Hospitals
- 5.2.2. Diagnostic Centers
- 5.3. Market Analysis, Insights and Forecast - by Region
- 5.3.1. North America
- 5.3.2. Europe
- 5.3.3. Asia Pacific
- 5.3.4. Middle East and Africa
- 5.3.5. South America
- 5.1. Market Analysis, Insights and Forecast - by Application Type
- 6. North America Functional Near-infrared Optical Brain Imaging Market Analysis, Insights and Forecast, 2019-2031
- 6.1. Market Analysis, Insights and Forecast - by Application Type
- 6.1.1. Parkinson's Disease
- 6.1.2. Epilepsy
- 6.1.3. Dementia
- 6.1.4. Traumatic Brain Injury
- 6.1.5. Sleep Disorders
- 6.1.6. Other Application Types
- 6.2. Market Analysis, Insights and Forecast - by End-User
- 6.2.1. Hospitals
- 6.2.2. Diagnostic Centers
- 6.1. Market Analysis, Insights and Forecast - by Application Type
- 7. Europe Functional Near-infrared Optical Brain Imaging Market Analysis, Insights and Forecast, 2019-2031
- 7.1. Market Analysis, Insights and Forecast - by Application Type
- 7.1.1. Parkinson's Disease
- 7.1.2. Epilepsy
- 7.1.3. Dementia
- 7.1.4. Traumatic Brain Injury
- 7.1.5. Sleep Disorders
- 7.1.6. Other Application Types
- 7.2. Market Analysis, Insights and Forecast - by End-User
- 7.2.1. Hospitals
- 7.2.2. Diagnostic Centers
- 7.1. Market Analysis, Insights and Forecast - by Application Type
- 8. Asia Pacific Functional Near-infrared Optical Brain Imaging Market Analysis, Insights and Forecast, 2019-2031
- 8.1. Market Analysis, Insights and Forecast - by Application Type
- 8.1.1. Parkinson's Disease
- 8.1.2. Epilepsy
- 8.1.3. Dementia
- 8.1.4. Traumatic Brain Injury
- 8.1.5. Sleep Disorders
- 8.1.6. Other Application Types
- 8.2. Market Analysis, Insights and Forecast - by End-User
- 8.2.1. Hospitals
- 8.2.2. Diagnostic Centers
- 8.1. Market Analysis, Insights and Forecast - by Application Type
- 9. Middle East and Africa Functional Near-infrared Optical Brain Imaging Market Analysis, Insights and Forecast, 2019-2031
- 9.1. Market Analysis, Insights and Forecast - by Application Type
- 9.1.1. Parkinson's Disease
- 9.1.2. Epilepsy
- 9.1.3. Dementia
- 9.1.4. Traumatic Brain Injury
- 9.1.5. Sleep Disorders
- 9.1.6. Other Application Types
- 9.2. Market Analysis, Insights and Forecast - by End-User
- 9.2.1. Hospitals
- 9.2.2. Diagnostic Centers
- 9.1. Market Analysis, Insights and Forecast - by Application Type
- 10. South America Functional Near-infrared Optical Brain Imaging Market Analysis, Insights and Forecast, 2019-2031
- 10.1. Market Analysis, Insights and Forecast - by Application Type
- 10.1.1. Parkinson's Disease
- 10.1.2. Epilepsy
- 10.1.3. Dementia
- 10.1.4. Traumatic Brain Injury
- 10.1.5. Sleep Disorders
- 10.1.6. Other Application Types
- 10.2. Market Analysis, Insights and Forecast - by End-User
- 10.2.1. Hospitals
- 10.2.2. Diagnostic Centers
- 10.1. Market Analysis, Insights and Forecast - by Application Type
- 11. North America Functional Near-infrared Optical Brain Imaging Market Analysis, Insights and Forecast, 2019-2031
- 11.1. Market Analysis, Insights and Forecast - By Country/Sub-region
- 11.1.1. undefined
- 12. Europe Functional Near-infrared Optical Brain Imaging Market Analysis, Insights and Forecast, 2019-2031
- 12.1. Market Analysis, Insights and Forecast - By Country/Sub-region
- 12.1.1. undefined
- 13. Asia Pacific Functional Near-infrared Optical Brain Imaging Market Analysis, Insights and Forecast, 2019-2031
- 13.1. Market Analysis, Insights and Forecast - By Country/Sub-region
- 13.1.1. undefined
- 14. Middle East and Africa Functional Near-infrared Optical Brain Imaging Market Analysis, Insights and Forecast, 2019-2031
- 14.1. Market Analysis, Insights and Forecast - By Country/Sub-region
- 14.1.1. undefined
- 15. South America Functional Near-infrared Optical Brain Imaging Market Analysis, Insights and Forecast, 2019-2031
- 15.1. Market Analysis, Insights and Forecast - By Country/Sub-region
- 15.1.1. undefined
- 16. Competitive Analysis
- 16.1. Global Market Share Analysis 2024
- 16.2. Company Profiles
- 16.2.1 NIRx Medical Technologies LLC
- 16.2.1.1. Overview
- 16.2.1.2. Products
- 16.2.1.3. SWOT Analysis
- 16.2.1.4. Recent Developments
- 16.2.1.5. Financials (Based on Availability)
- 16.2.2 Biopac Systems Inc
- 16.2.2.1. Overview
- 16.2.2.2. Products
- 16.2.2.3. SWOT Analysis
- 16.2.2.4. Recent Developments
- 16.2.2.5. Financials (Based on Availability)
- 16.2.3 Artinis Medical Systems
- 16.2.3.1. Overview
- 16.2.3.2. Products
- 16.2.3.3. SWOT Analysis
- 16.2.3.4. Recent Developments
- 16.2.3.5. Financials (Based on Availability)
- 16.2.4 Oxford Instruments
- 16.2.4.1. Overview
- 16.2.4.2. Products
- 16.2.4.3. SWOT Analysis
- 16.2.4.4. Recent Developments
- 16.2.4.5. Financials (Based on Availability)
- 16.2.5 Soterix Medical Inc
- 16.2.5.1. Overview
- 16.2.5.2. Products
- 16.2.5.3. SWOT Analysis
- 16.2.5.4. Recent Developments
- 16.2.5.5. Financials (Based on Availability)
- 16.2.6 Gowerlabs Ltd
- 16.2.6.1. Overview
- 16.2.6.2. Products
- 16.2.6.3. SWOT Analysis
- 16.2.6.4. Recent Developments
- 16.2.6.5. Financials (Based on Availability)
- 16.2.7 Fujifilm Holdings Corporation (Hitachi Ltd )
- 16.2.7.1. Overview
- 16.2.7.2. Products
- 16.2.7.3. SWOT Analysis
- 16.2.7.4. Recent Developments
- 16.2.7.5. Financials (Based on Availability)
- 16.2.8 PerkinElmer Inc
- 16.2.8.1. Overview
- 16.2.8.2. Products
- 16.2.8.3. SWOT Analysis
- 16.2.8.4. Recent Developments
- 16.2.8.5. Financials (Based on Availability)
- 16.2.9 Shimadzu Corporation
- 16.2.9.1. Overview
- 16.2.9.2. Products
- 16.2.9.3. SWOT Analysis
- 16.2.9.4. Recent Developments
- 16.2.9.5. Financials (Based on Availability)
- 16.2.1 NIRx Medical Technologies LLC
List of Figures
- Figure 1: Global Functional Near-infrared Optical Brain Imaging Market Revenue Breakdown (Million, %) by Region 2024 & 2032
- Figure 2: Global Functional Near-infrared Optical Brain Imaging Market Volume Breakdown (K Unit, %) by Region 2024 & 2032
- Figure 3: North America Functional Near-infrared Optical Brain Imaging Market Revenue (Million), by Country 2024 & 2032
- Figure 4: North America Functional Near-infrared Optical Brain Imaging Market Volume (K Unit), by Country 2024 & 2032
- Figure 5: North America Functional Near-infrared Optical Brain Imaging Market Revenue Share (%), by Country 2024 & 2032
- Figure 6: North America Functional Near-infrared Optical Brain Imaging Market Volume Share (%), by Country 2024 & 2032
- Figure 7: Europe Functional Near-infrared Optical Brain Imaging Market Revenue (Million), by Country 2024 & 2032
- Figure 8: Europe Functional Near-infrared Optical Brain Imaging Market Volume (K Unit), by Country 2024 & 2032
- Figure 9: Europe Functional Near-infrared Optical Brain Imaging Market Revenue Share (%), by Country 2024 & 2032
- Figure 10: Europe Functional Near-infrared Optical Brain Imaging Market Volume Share (%), by Country 2024 & 2032
- Figure 11: Asia Pacific Functional Near-infrared Optical Brain Imaging Market Revenue (Million), by Country 2024 & 2032
- Figure 12: Asia Pacific Functional Near-infrared Optical Brain Imaging Market Volume (K Unit), by Country 2024 & 2032
- Figure 13: Asia Pacific Functional Near-infrared Optical Brain Imaging Market Revenue Share (%), by Country 2024 & 2032
- Figure 14: Asia Pacific Functional Near-infrared Optical Brain Imaging Market Volume Share (%), by Country 2024 & 2032
- Figure 15: Middle East and Africa Functional Near-infrared Optical Brain Imaging Market Revenue (Million), by Country 2024 & 2032
- Figure 16: Middle East and Africa Functional Near-infrared Optical Brain Imaging Market Volume (K Unit), by Country 2024 & 2032
- Figure 17: Middle East and Africa Functional Near-infrared Optical Brain Imaging Market Revenue Share (%), by Country 2024 & 2032
- Figure 18: Middle East and Africa Functional Near-infrared Optical Brain Imaging Market Volume Share (%), by Country 2024 & 2032
- Figure 19: South America Functional Near-infrared Optical Brain Imaging Market Revenue (Million), by Country 2024 & 2032
- Figure 20: South America Functional Near-infrared Optical Brain Imaging Market Volume (K Unit), by Country 2024 & 2032
- Figure 21: South America Functional Near-infrared Optical Brain Imaging Market Revenue Share (%), by Country 2024 & 2032
- Figure 22: South America Functional Near-infrared Optical Brain Imaging Market Volume Share (%), by Country 2024 & 2032
- Figure 23: North America Functional Near-infrared Optical Brain Imaging Market Revenue (Million), by Application Type 2024 & 2032
- Figure 24: North America Functional Near-infrared Optical Brain Imaging Market Volume (K Unit), by Application Type 2024 & 2032
- Figure 25: North America Functional Near-infrared Optical Brain Imaging Market Revenue Share (%), by Application Type 2024 & 2032
- Figure 26: North America Functional Near-infrared Optical Brain Imaging Market Volume Share (%), by Application Type 2024 & 2032
- Figure 27: North America Functional Near-infrared Optical Brain Imaging Market Revenue (Million), by End-User 2024 & 2032
- Figure 28: North America Functional Near-infrared Optical Brain Imaging Market Volume (K Unit), by End-User 2024 & 2032
- Figure 29: North America Functional Near-infrared Optical Brain Imaging Market Revenue Share (%), by End-User 2024 & 2032
- Figure 30: North America Functional Near-infrared Optical Brain Imaging Market Volume Share (%), by End-User 2024 & 2032
- Figure 31: North America Functional Near-infrared Optical Brain Imaging Market Revenue (Million), by Country 2024 & 2032
- Figure 32: North America Functional Near-infrared Optical Brain Imaging Market Volume (K Unit), by Country 2024 & 2032
- Figure 33: North America Functional Near-infrared Optical Brain Imaging Market Revenue Share (%), by Country 2024 & 2032
- Figure 34: North America Functional Near-infrared Optical Brain Imaging Market Volume Share (%), by Country 2024 & 2032
- Figure 35: Europe Functional Near-infrared Optical Brain Imaging Market Revenue (Million), by Application Type 2024 & 2032
- Figure 36: Europe Functional Near-infrared Optical Brain Imaging Market Volume (K Unit), by Application Type 2024 & 2032
- Figure 37: Europe Functional Near-infrared Optical Brain Imaging Market Revenue Share (%), by Application Type 2024 & 2032
- Figure 38: Europe Functional Near-infrared Optical Brain Imaging Market Volume Share (%), by Application Type 2024 & 2032
- Figure 39: Europe Functional Near-infrared Optical Brain Imaging Market Revenue (Million), by End-User 2024 & 2032
- Figure 40: Europe Functional Near-infrared Optical Brain Imaging Market Volume (K Unit), by End-User 2024 & 2032
- Figure 41: Europe Functional Near-infrared Optical Brain Imaging Market Revenue Share (%), by End-User 2024 & 2032
- Figure 42: Europe Functional Near-infrared Optical Brain Imaging Market Volume Share (%), by End-User 2024 & 2032
- Figure 43: Europe Functional Near-infrared Optical Brain Imaging Market Revenue (Million), by Country 2024 & 2032
- Figure 44: Europe Functional Near-infrared Optical Brain Imaging Market Volume (K Unit), by Country 2024 & 2032
- Figure 45: Europe Functional Near-infrared Optical Brain Imaging Market Revenue Share (%), by Country 2024 & 2032
- Figure 46: Europe Functional Near-infrared Optical Brain Imaging Market Volume Share (%), by Country 2024 & 2032
- Figure 47: Asia Pacific Functional Near-infrared Optical Brain Imaging Market Revenue (Million), by Application Type 2024 & 2032
- Figure 48: Asia Pacific Functional Near-infrared Optical Brain Imaging Market Volume (K Unit), by Application Type 2024 & 2032
- Figure 49: Asia Pacific Functional Near-infrared Optical Brain Imaging Market Revenue Share (%), by Application Type 2024 & 2032
- Figure 50: Asia Pacific Functional Near-infrared Optical Brain Imaging Market Volume Share (%), by Application Type 2024 & 2032
- Figure 51: Asia Pacific Functional Near-infrared Optical Brain Imaging Market Revenue (Million), by End-User 2024 & 2032
- Figure 52: Asia Pacific Functional Near-infrared Optical Brain Imaging Market Volume (K Unit), by End-User 2024 & 2032
- Figure 53: Asia Pacific Functional Near-infrared Optical Brain Imaging Market Revenue Share (%), by End-User 2024 & 2032
- Figure 54: Asia Pacific Functional Near-infrared Optical Brain Imaging Market Volume Share (%), by End-User 2024 & 2032
- Figure 55: Asia Pacific Functional Near-infrared Optical Brain Imaging Market Revenue (Million), by Country 2024 & 2032
- Figure 56: Asia Pacific Functional Near-infrared Optical Brain Imaging Market Volume (K Unit), by Country 2024 & 2032
- Figure 57: Asia Pacific Functional Near-infrared Optical Brain Imaging Market Revenue Share (%), by Country 2024 & 2032
- Figure 58: Asia Pacific Functional Near-infrared Optical Brain Imaging Market Volume Share (%), by Country 2024 & 2032
- Figure 59: Middle East and Africa Functional Near-infrared Optical Brain Imaging Market Revenue (Million), by Application Type 2024 & 2032
- Figure 60: Middle East and Africa Functional Near-infrared Optical Brain Imaging Market Volume (K Unit), by Application Type 2024 & 2032
- Figure 61: Middle East and Africa Functional Near-infrared Optical Brain Imaging Market Revenue Share (%), by Application Type 2024 & 2032
- Figure 62: Middle East and Africa Functional Near-infrared Optical Brain Imaging Market Volume Share (%), by Application Type 2024 & 2032
- Figure 63: Middle East and Africa Functional Near-infrared Optical Brain Imaging Market Revenue (Million), by End-User 2024 & 2032
- Figure 64: Middle East and Africa Functional Near-infrared Optical Brain Imaging Market Volume (K Unit), by End-User 2024 & 2032
- Figure 65: Middle East and Africa Functional Near-infrared Optical Brain Imaging Market Revenue Share (%), by End-User 2024 & 2032
- Figure 66: Middle East and Africa Functional Near-infrared Optical Brain Imaging Market Volume Share (%), by End-User 2024 & 2032
- Figure 67: Middle East and Africa Functional Near-infrared Optical Brain Imaging Market Revenue (Million), by Country 2024 & 2032
- Figure 68: Middle East and Africa Functional Near-infrared Optical Brain Imaging Market Volume (K Unit), by Country 2024 & 2032
- Figure 69: Middle East and Africa Functional Near-infrared Optical Brain Imaging Market Revenue Share (%), by Country 2024 & 2032
- Figure 70: Middle East and Africa Functional Near-infrared Optical Brain Imaging Market Volume Share (%), by Country 2024 & 2032
- Figure 71: South America Functional Near-infrared Optical Brain Imaging Market Revenue (Million), by Application Type 2024 & 2032
- Figure 72: South America Functional Near-infrared Optical Brain Imaging Market Volume (K Unit), by Application Type 2024 & 2032
- Figure 73: South America Functional Near-infrared Optical Brain Imaging Market Revenue Share (%), by Application Type 2024 & 2032
- Figure 74: South America Functional Near-infrared Optical Brain Imaging Market Volume Share (%), by Application Type 2024 & 2032
- Figure 75: South America Functional Near-infrared Optical Brain Imaging Market Revenue (Million), by End-User 2024 & 2032
- Figure 76: South America Functional Near-infrared Optical Brain Imaging Market Volume (K Unit), by End-User 2024 & 2032
- Figure 77: South America Functional Near-infrared Optical Brain Imaging Market Revenue Share (%), by End-User 2024 & 2032
- Figure 78: South America Functional Near-infrared Optical Brain Imaging Market Volume Share (%), by End-User 2024 & 2032
- Figure 79: South America Functional Near-infrared Optical Brain Imaging Market Revenue (Million), by Country 2024 & 2032
- Figure 80: South America Functional Near-infrared Optical Brain Imaging Market Volume (K Unit), by Country 2024 & 2032
- Figure 81: South America Functional Near-infrared Optical Brain Imaging Market Revenue Share (%), by Country 2024 & 2032
- Figure 82: South America Functional Near-infrared Optical Brain Imaging Market Volume Share (%), by Country 2024 & 2032
List of Tables
- Table 1: Global Functional Near-infrared Optical Brain Imaging Market Revenue Million Forecast, by Region 2019 & 2032
- Table 2: Global Functional Near-infrared Optical Brain Imaging Market Volume K Unit Forecast, by Region 2019 & 2032
- Table 3: Global Functional Near-infrared Optical Brain Imaging Market Revenue Million Forecast, by Application Type 2019 & 2032
- Table 4: Global Functional Near-infrared Optical Brain Imaging Market Volume K Unit Forecast, by Application Type 2019 & 2032
- Table 5: Global Functional Near-infrared Optical Brain Imaging Market Revenue Million Forecast, by End-User 2019 & 2032
- Table 6: Global Functional Near-infrared Optical Brain Imaging Market Volume K Unit Forecast, by End-User 2019 & 2032
- Table 7: Global Functional Near-infrared Optical Brain Imaging Market Revenue Million Forecast, by Region 2019 & 2032
- Table 8: Global Functional Near-infrared Optical Brain Imaging Market Volume K Unit Forecast, by Region 2019 & 2032
- Table 9: Global Functional Near-infrared Optical Brain Imaging Market Revenue Million Forecast, by Country 2019 & 2032
- Table 10: Global Functional Near-infrared Optical Brain Imaging Market Volume K Unit Forecast, by Country 2019 & 2032
- Table 11: Global Functional Near-infrared Optical Brain Imaging Market Revenue Million Forecast, by Country 2019 & 2032
- Table 12: Global Functional Near-infrared Optical Brain Imaging Market Volume K Unit Forecast, by Country 2019 & 2032
- Table 13: Global Functional Near-infrared Optical Brain Imaging Market Revenue Million Forecast, by Country 2019 & 2032
- Table 14: Global Functional Near-infrared Optical Brain Imaging Market Volume K Unit Forecast, by Country 2019 & 2032
- Table 15: Global Functional Near-infrared Optical Brain Imaging Market Revenue Million Forecast, by Country 2019 & 2032
- Table 16: Global Functional Near-infrared Optical Brain Imaging Market Volume K Unit Forecast, by Country 2019 & 2032
- Table 17: Global Functional Near-infrared Optical Brain Imaging Market Revenue Million Forecast, by Country 2019 & 2032
- Table 18: Global Functional Near-infrared Optical Brain Imaging Market Volume K Unit Forecast, by Country 2019 & 2032
- Table 19: Global Functional Near-infrared Optical Brain Imaging Market Revenue Million Forecast, by Application Type 2019 & 2032
- Table 20: Global Functional Near-infrared Optical Brain Imaging Market Volume K Unit Forecast, by Application Type 2019 & 2032
- Table 21: Global Functional Near-infrared Optical Brain Imaging Market Revenue Million Forecast, by End-User 2019 & 2032
- Table 22: Global Functional Near-infrared Optical Brain Imaging Market Volume K Unit Forecast, by End-User 2019 & 2032
- Table 23: Global Functional Near-infrared Optical Brain Imaging Market Revenue Million Forecast, by Country 2019 & 2032
- Table 24: Global Functional Near-infrared Optical Brain Imaging Market Volume K Unit Forecast, by Country 2019 & 2032
- Table 25: United States Functional Near-infrared Optical Brain Imaging Market Revenue (Million) Forecast, by Application 2019 & 2032
- Table 26: United States Functional Near-infrared Optical Brain Imaging Market Volume (K Unit) Forecast, by Application 2019 & 2032
- Table 27: Canada Functional Near-infrared Optical Brain Imaging Market Revenue (Million) Forecast, by Application 2019 & 2032
- Table 28: Canada Functional Near-infrared Optical Brain Imaging Market Volume (K Unit) Forecast, by Application 2019 & 2032
- Table 29: Mexico Functional Near-infrared Optical Brain Imaging Market Revenue (Million) Forecast, by Application 2019 & 2032
- Table 30: Mexico Functional Near-infrared Optical Brain Imaging Market Volume (K Unit) Forecast, by Application 2019 & 2032
- Table 31: Global Functional Near-infrared Optical Brain Imaging Market Revenue Million Forecast, by Application Type 2019 & 2032
- Table 32: Global Functional Near-infrared Optical Brain Imaging Market Volume K Unit Forecast, by Application Type 2019 & 2032
- Table 33: Global Functional Near-infrared Optical Brain Imaging Market Revenue Million Forecast, by End-User 2019 & 2032
- Table 34: Global Functional Near-infrared Optical Brain Imaging Market Volume K Unit Forecast, by End-User 2019 & 2032
- Table 35: Global Functional Near-infrared Optical Brain Imaging Market Revenue Million Forecast, by Country 2019 & 2032
- Table 36: Global Functional Near-infrared Optical Brain Imaging Market Volume K Unit Forecast, by Country 2019 & 2032
- Table 37: Germany Functional Near-infrared Optical Brain Imaging Market Revenue (Million) Forecast, by Application 2019 & 2032
- Table 38: Germany Functional Near-infrared Optical Brain Imaging Market Volume (K Unit) Forecast, by Application 2019 & 2032
- Table 39: United Kingdom Functional Near-infrared Optical Brain Imaging Market Revenue (Million) Forecast, by Application 2019 & 2032
- Table 40: United Kingdom Functional Near-infrared Optical Brain Imaging Market Volume (K Unit) Forecast, by Application 2019 & 2032
- Table 41: France Functional Near-infrared Optical Brain Imaging Market Revenue (Million) Forecast, by Application 2019 & 2032
- Table 42: France Functional Near-infrared Optical Brain Imaging Market Volume (K Unit) Forecast, by Application 2019 & 2032
- Table 43: Italy Functional Near-infrared Optical Brain Imaging Market Revenue (Million) Forecast, by Application 2019 & 2032
- Table 44: Italy Functional Near-infrared Optical Brain Imaging Market Volume (K Unit) Forecast, by Application 2019 & 2032
- Table 45: Spain Functional Near-infrared Optical Brain Imaging Market Revenue (Million) Forecast, by Application 2019 & 2032
- Table 46: Spain Functional Near-infrared Optical Brain Imaging Market Volume (K Unit) Forecast, by Application 2019 & 2032
- Table 47: Rest of Europe Functional Near-infrared Optical Brain Imaging Market Revenue (Million) Forecast, by Application 2019 & 2032
- Table 48: Rest of Europe Functional Near-infrared Optical Brain Imaging Market Volume (K Unit) Forecast, by Application 2019 & 2032
- Table 49: Global Functional Near-infrared Optical Brain Imaging Market Revenue Million Forecast, by Application Type 2019 & 2032
- Table 50: Global Functional Near-infrared Optical Brain Imaging Market Volume K Unit Forecast, by Application Type 2019 & 2032
- Table 51: Global Functional Near-infrared Optical Brain Imaging Market Revenue Million Forecast, by End-User 2019 & 2032
- Table 52: Global Functional Near-infrared Optical Brain Imaging Market Volume K Unit Forecast, by End-User 2019 & 2032
- Table 53: Global Functional Near-infrared Optical Brain Imaging Market Revenue Million Forecast, by Country 2019 & 2032
- Table 54: Global Functional Near-infrared Optical Brain Imaging Market Volume K Unit Forecast, by Country 2019 & 2032
- Table 55: China Functional Near-infrared Optical Brain Imaging Market Revenue (Million) Forecast, by Application 2019 & 2032
- Table 56: China Functional Near-infrared Optical Brain Imaging Market Volume (K Unit) Forecast, by Application 2019 & 2032
- Table 57: Japan Functional Near-infrared Optical Brain Imaging Market Revenue (Million) Forecast, by Application 2019 & 2032
- Table 58: Japan Functional Near-infrared Optical Brain Imaging Market Volume (K Unit) Forecast, by Application 2019 & 2032
- Table 59: India Functional Near-infrared Optical Brain Imaging Market Revenue (Million) Forecast, by Application 2019 & 2032
- Table 60: India Functional Near-infrared Optical Brain Imaging Market Volume (K Unit) Forecast, by Application 2019 & 2032
- Table 61: Australia Functional Near-infrared Optical Brain Imaging Market Revenue (Million) Forecast, by Application 2019 & 2032
- Table 62: Australia Functional Near-infrared Optical Brain Imaging Market Volume (K Unit) Forecast, by Application 2019 & 2032
- Table 63: South Korea Functional Near-infrared Optical Brain Imaging Market Revenue (Million) Forecast, by Application 2019 & 2032
- Table 64: South Korea Functional Near-infrared Optical Brain Imaging Market Volume (K Unit) Forecast, by Application 2019 & 2032
- Table 65: Rest of Asia Pacific Functional Near-infrared Optical Brain Imaging Market Revenue (Million) Forecast, by Application 2019 & 2032
- Table 66: Rest of Asia Pacific Functional Near-infrared Optical Brain Imaging Market Volume (K Unit) Forecast, by Application 2019 & 2032
- Table 67: Global Functional Near-infrared Optical Brain Imaging Market Revenue Million Forecast, by Application Type 2019 & 2032
- Table 68: Global Functional Near-infrared Optical Brain Imaging Market Volume K Unit Forecast, by Application Type 2019 & 2032
- Table 69: Global Functional Near-infrared Optical Brain Imaging Market Revenue Million Forecast, by End-User 2019 & 2032
- Table 70: Global Functional Near-infrared Optical Brain Imaging Market Volume K Unit Forecast, by End-User 2019 & 2032
- Table 71: Global Functional Near-infrared Optical Brain Imaging Market Revenue Million Forecast, by Country 2019 & 2032
- Table 72: Global Functional Near-infrared Optical Brain Imaging Market Volume K Unit Forecast, by Country 2019 & 2032
- Table 73: GCC Functional Near-infrared Optical Brain Imaging Market Revenue (Million) Forecast, by Application 2019 & 2032
- Table 74: GCC Functional Near-infrared Optical Brain Imaging Market Volume (K Unit) Forecast, by Application 2019 & 2032
- Table 75: South Africa Functional Near-infrared Optical Brain Imaging Market Revenue (Million) Forecast, by Application 2019 & 2032
- Table 76: South Africa Functional Near-infrared Optical Brain Imaging Market Volume (K Unit) Forecast, by Application 2019 & 2032
- Table 77: Rest of Middle East and Africa Functional Near-infrared Optical Brain Imaging Market Revenue (Million) Forecast, by Application 2019 & 2032
- Table 78: Rest of Middle East and Africa Functional Near-infrared Optical Brain Imaging Market Volume (K Unit) Forecast, by Application 2019 & 2032
- Table 79: Global Functional Near-infrared Optical Brain Imaging Market Revenue Million Forecast, by Application Type 2019 & 2032
- Table 80: Global Functional Near-infrared Optical Brain Imaging Market Volume K Unit Forecast, by Application Type 2019 & 2032
- Table 81: Global Functional Near-infrared Optical Brain Imaging Market Revenue Million Forecast, by End-User 2019 & 2032
- Table 82: Global Functional Near-infrared Optical Brain Imaging Market Volume K Unit Forecast, by End-User 2019 & 2032
- Table 83: Global Functional Near-infrared Optical Brain Imaging Market Revenue Million Forecast, by Country 2019 & 2032
- Table 84: Global Functional Near-infrared Optical Brain Imaging Market Volume K Unit Forecast, by Country 2019 & 2032
- Table 85: Brazil Functional Near-infrared Optical Brain Imaging Market Revenue (Million) Forecast, by Application 2019 & 2032
- Table 86: Brazil Functional Near-infrared Optical Brain Imaging Market Volume (K Unit) Forecast, by Application 2019 & 2032
- Table 87: Argentina Functional Near-infrared Optical Brain Imaging Market Revenue (Million) Forecast, by Application 2019 & 2032
- Table 88: Argentina Functional Near-infrared Optical Brain Imaging Market Volume (K Unit) Forecast, by Application 2019 & 2032
- Table 89: Rest of South America Functional Near-infrared Optical Brain Imaging Market Revenue (Million) Forecast, by Application 2019 & 2032
- Table 90: Rest of South America Functional Near-infrared Optical Brain Imaging Market Volume (K Unit) Forecast, by Application 2019 & 2032
Frequently Asked Questions
1. What is the projected Compound Annual Growth Rate (CAGR) of the Functional Near-infrared Optical Brain Imaging Market?
The projected CAGR is approximately 5.65%.
2. Which companies are prominent players in the Functional Near-infrared Optical Brain Imaging Market?
Key companies in the market include NIRx Medical Technologies LLC, Biopac Systems Inc, Artinis Medical Systems, Oxford Instruments, Soterix Medical Inc, Gowerlabs Ltd, Fujifilm Holdings Corporation (Hitachi Ltd ), PerkinElmer Inc, Shimadzu Corporation.
3. What are the main segments of the Functional Near-infrared Optical Brain Imaging Market?
The market segments include Application Type, End-User.
4. Can you provide details about the market size?
The market size is estimated to be USD XX Million as of 2022.
5. What are some drivers contributing to market growth?
Rising Prevalence of Neurological Disorders; Emerging Trends in Products.
6. What are the notable trends driving market growth?
Traumatic Brain Injury Segment Expects to Register a Strong Growth in the Forecast Period.
7. Are there any restraints impacting market growth?
Lack of Skilled Professionals.
8. Can you provide examples of recent developments in the market?
March 2022: Kernel, a neurotechnology company, developed a wearable headset device, Kernel Flow, for brain measurement which was based on time-domain functional near-infrared spectroscopy (TD-fNIRS), which enables accurate, high-resolution measurement of the brain and its functions by emitting picosecond pulses of light into tissue and measuring the arrival times of single photons. The device weighs 2.05 kg and contains 52 modules arranged in four plates that fit on either side of the head.
9. What pricing options are available for accessing the report?
Pricing options include single-user, multi-user, and enterprise licenses priced at USD 4750, USD 5250, and USD 8750 respectively.
10. Is the market size provided in terms of value or volume?
The market size is provided in terms of value, measured in Million and volume, measured in K Unit.
11. Are there any specific market keywords associated with the report?
Yes, the market keyword associated with the report is "Functional Near-infrared Optical Brain Imaging Market," which aids in identifying and referencing the specific market segment covered.
12. How do I determine which pricing option suits my needs best?
The pricing options vary based on user requirements and access needs. Individual users may opt for single-user licenses, while businesses requiring broader access may choose multi-user or enterprise licenses for cost-effective access to the report.
13. Are there any additional resources or data provided in the Functional Near-infrared Optical Brain Imaging Market report?
While the report offers comprehensive insights, it's advisable to review the specific contents or supplementary materials provided to ascertain if additional resources or data are available.
14. How can I stay updated on further developments or reports in the Functional Near-infrared Optical Brain Imaging Market?
To stay informed about further developments, trends, and reports in the Functional Near-infrared Optical Brain Imaging Market, consider subscribing to industry newsletters, following relevant companies and organizations, or regularly checking reputable industry news sources and publications.
Methodology
Step 1 - Identification of Relevant Samples Size from Population Database


Step 2 - Approaches for Defining Global Market Size (Value, Volume* & Price*)

Note*: In applicable scenarios
Step 3 - Data Sources
Primary Research
- Web Analytics
- Survey Reports
- Research Institute
- Latest Research Reports
- Opinion Leaders
Secondary Research
- Annual Reports
- White Paper
- Latest Press Release
- Industry Association
- Paid Database
- Investor Presentations

Step 4 - Data Triangulation
Involves using different sources of information in order to increase the validity of a study
These sources are likely to be stakeholders in a program - participants, other researchers, program staff, other community members, and so on.
Then we put all data in single framework & apply various statistical tools to find out the dynamic on the market.
During the analysis stage, feedback from the stakeholder groups would be compared to determine areas of agreement as well as areas of divergence
