

Key Insights
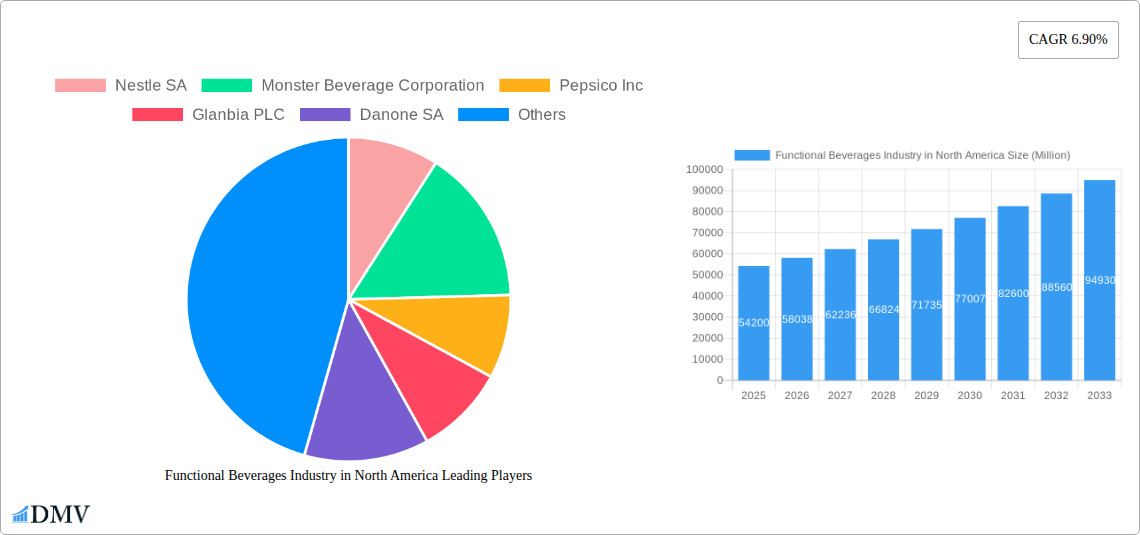
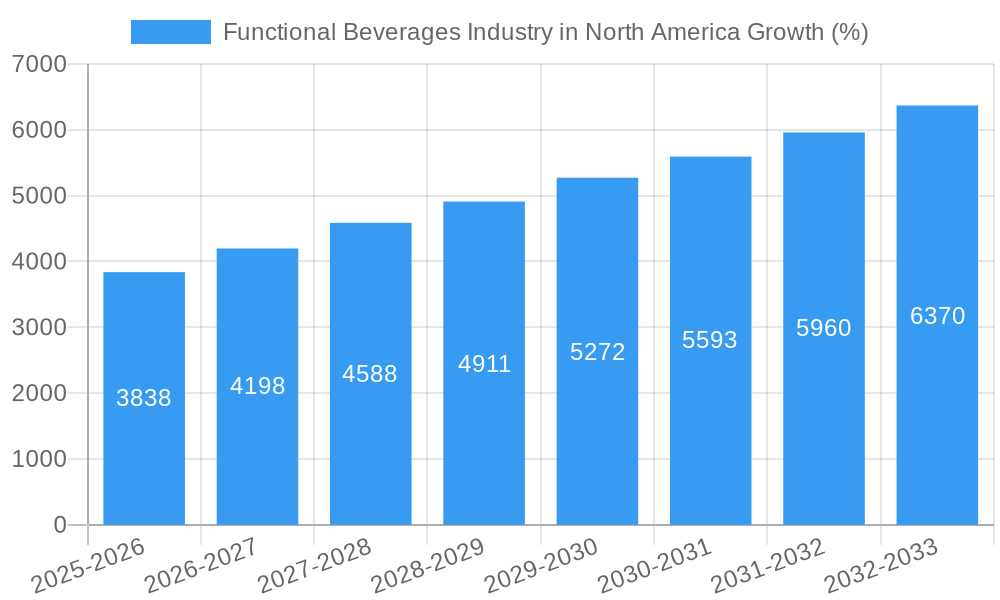
The North American functional beverage market, valued at $54.20 billion in 2025, is projected to experience robust growth, exhibiting a Compound Annual Growth Rate (CAGR) of 6.90% from 2025 to 2033. This expansion is fueled by several key drivers. The rising prevalence of health-conscious consumers seeking convenient ways to boost their nutrient intake is a primary factor. Increased awareness of the benefits of hydration and improved athletic performance is driving demand for sports drinks and energy drinks. Furthermore, the growing popularity of plant-based diets is boosting the segment of dairy and dairy alternative beverages within the functional beverage category. Innovation within the industry, focusing on natural ingredients, unique flavor profiles, and functional benefits beyond simple hydration (e.g., added vitamins, antioxidants, or probiotics), further contributes to market growth. Distribution channels are also evolving, with online retail stores experiencing significant growth alongside traditional avenues like supermarkets and convenience stores. Competitive pressures among major players like Nestle, PepsiCo, and Red Bull, among others, are driving innovation and accessibility, ultimately benefiting consumers.
However, certain restraints may temper growth. Concerns about high sugar content in some functional beverages, especially energy drinks, could lead to regulatory scrutiny and potentially affect consumer preference. Fluctuations in the cost of raw materials, particularly for natural ingredients, can impact production costs and pricing. Furthermore, the market faces competition from other beverage categories, such as bottled water and traditional juices, limiting market penetration. Nevertheless, the long-term outlook for the North American functional beverage market remains positive, given the ongoing trend towards healthier lifestyles and the continued innovation within the industry to cater to evolving consumer demands. The market segmentation, encompassing energy drinks, sports drinks, fortified juices, dairy and dairy alternatives, and other types, offers opportunities for diversified growth across various product categories. This diversification should allow the market to weather potential challenges in individual segments.
Functional Beverages Industry in North America: A Comprehensive Market Report (2019-2033)
This insightful report provides a detailed analysis of the North American functional beverages market, encompassing market size, growth trajectories, key players, and future opportunities. With a study period spanning 2019-2033, a base year of 2025, and a forecast period of 2025-2033, this report is an essential resource for stakeholders seeking to understand and capitalize on this dynamic market. The report covers key segments including energy drinks, sports drinks, fortified juices, dairy and dairy alternative beverages, and other functional beverage types, across various distribution channels. The market value in 2025 is estimated at xx Million.
Functional Beverages Industry in North America Market Composition & Trends
The North American functional beverage market is characterized by a dynamic interplay of established giants and emerging players. Market concentration is moderate, with key players like Nestle SA, Nestle SA, Monster Beverage Corporation, Monster Beverage Corporation, Pepsico Inc, Pepsico Inc, and Coca-Cola Company holding significant market share, but facing competition from smaller, innovative brands. The market share distribution in 2025 is estimated as follows: Nestle SA (xx%), Pepsico Inc (xx%), Monster Beverage Corp (xx%), Coca-Cola (xx%), others (xx%). Innovation is a key catalyst, driven by consumer demand for healthier, more functional beverages. The regulatory landscape, particularly concerning labeling and health claims, significantly impacts market dynamics. Substitute products, such as plain water and traditional juices, pose a competitive threat. End-user profiles are diverse, ranging from athletes and health-conscious consumers to those seeking convenient refreshment. Mergers and acquisitions (M&A) activity has been significant, with deal values totaling xx Million in the past five years, reflecting industry consolidation and expansion efforts.
- Market Concentration: Moderate, with top players holding significant but not dominant shares.
- Innovation Catalysts: Consumer demand for healthier options, technological advancements in formulation and packaging.
- Regulatory Landscape: Stringent regulations on labeling and health claims influence product development and marketing.
- Substitute Products: Water, traditional juices, and other beverages compete for consumer preference.
- End-User Profiles: Athletes, health-conscious individuals, and general consumers.
- M&A Activity: Significant consolidation and expansion efforts, with total deal values reaching xx Million in the historical period.
Functional Beverages Industry in North America Industry Evolution
The North American functional beverage market has experienced robust growth over the historical period (2019-2024), with a CAGR of xx%. This growth is primarily attributed to several factors: increasing health consciousness among consumers, the rising popularity of fitness and athletic activities, and the growing prevalence of health-related conditions. Technological advancements in beverage formulation, particularly in areas like natural sweeteners, enhanced nutritional profiles, and innovative packaging, have further propelled market expansion. Consumer demand is shifting towards beverages with added functional benefits, such as increased protein content, enhanced hydration, and improved energy levels. This is reflected in the rising popularity of products such as plant-based protein drinks and low-sugar energy drinks. The market is also witnessing a surge in demand for functional beverages with natural and organic ingredients, driven by growing consumer preference for clean-label products. This trend is expected to continue throughout the forecast period, although growth rates may moderate slightly to a CAGR of xx% between 2025 and 2033. The adoption of new technologies in production and distribution channels is also expected to enhance market efficiency.
Leading Regions, Countries, or Segments in Functional Beverages Industry in North America
- Dominant Region: The Western United States is the leading region due to higher health consciousness and disposable income.
- Dominant Segment (Type): Energy drinks hold the largest market share due to high demand and widespread popularity.
- Dominant Segment (Distribution): Hypermarkets/Supermarkets are the primary distribution channels due to convenience and high consumer reach.
Key Drivers:
- Investment Trends: Significant investments in R&D, marketing, and expansion by major players.
- Regulatory Support: Regulations promoting healthy options and labeling clarity support growth.
- Consumer Preferences: Increasing demand for convenient, healthier alternatives fuels segment dominance.
The dominance of energy drinks is linked to their wide appeal among young adults and athletes. Hypermarkets and supermarkets' dominance is due to their broad reach and established distribution infrastructure.
Functional Beverages Industry in North America Product Innovations
Recent product innovations focus on enhancing taste profiles while maintaining or improving functional benefits. Low-sugar, natural ingredient formulations are gaining traction, along with products featuring increased protein content, electrolytes, or other specialized nutrients to target specific health needs. Technological advancements include improved packaging for extended shelf life and enhanced functionality (e.g., on-the-go packaging). Unique selling propositions (USPs) highlight convenience, natural ingredients, and tailored benefits for specific consumer groups, such as athletes or health-conscious individuals.
Propelling Factors for Functional Beverages Industry in North America Growth
Technological advancements in formulations and packaging, coupled with rising health consciousness and disposable incomes, are key drivers. Government regulations promoting healthy dietary choices and clear labeling further boost market growth. The rising popularity of fitness and wellness trends also contributes significantly, driving demand for functional beverages. The growing number of health-conscious consumers seeking convenient and healthy options further fuel market growth.
Obstacles in the Functional Beverages Industry in North America Market
Regulatory hurdles, particularly concerning health claims and ingredient approvals, pose challenges. Supply chain disruptions, impacting raw material availability and production costs, pose a threat. Intense competition from established players and emerging brands creates pricing pressure. These factors can collectively impact profitability and growth.
Future Opportunities in Functional Beverages Industry in North America
Expansion into niche markets (e.g., organic, vegan, plant-based) presents significant growth opportunities. Technological innovations in formulation and delivery systems (e.g., personalized nutrition, enhanced bioavailability) create potential for new product development. Emerging consumer trends like functional wellness and personalized nutrition offer avenues for innovative products.
Major Players in the Functional Beverages Industry in North America Ecosystem
- Nestle SA
- Monster Beverage Corporation
- Pepsico Inc
- Glanbia PLC
- Danone SA
- Red Bull GmbH
- The Hain Celestial Group Inc
- The Coca-Cola Company
- Campbell Soup Company
- General Nutrition Centers Inc
Key Developments in Functional Beverages Industry in North America Industry
- January 2021: Danone North America launched Silk Ultra, a plant-based protein beverage for athletes, showcasing the growth in plant-based functional options.
- January 2022: Bubly launched limited-edition sparkling water flavors in Canada, highlighting the innovation in the sparkling water segment.
- February 2022: Tropicana Light introduced lower-calorie, no-added-sugar options, reflecting the market shift towards healthier choices.
Strategic Functional Beverages Industry in North America Market Forecast
The North American functional beverage market is poised for continued growth, driven by persistent consumer demand for healthier options and ongoing product innovation. Emerging trends in personalized nutrition and sustainable packaging will shape future opportunities. The market's robust growth potential is supported by the increasing health consciousness among consumers and the introduction of innovative product offerings catering to diverse consumer needs.
Functional Beverages Industry in North America Segmentation
-
1. Type
- 1.1. Energy Drinks
- 1.2. Sports Drinks
- 1.3. Fortified Juice
- 1.4. Dairy and Dairy Alternative Beverage
- 1.5. Other Types
-
2. Distribution Channel
- 2.1. Hypermarkets/Supermarkets
- 2.2. Drug stores and Pharmacies
- 2.3. Convenience Stores
- 2.4. Online Retail Stores
- 2.5. Other Distribution Channels
Functional Beverages Industry in North America Segmentation By Geography
-
1. North America
- 1.1. United States
- 1.2. Canada
- 1.3. Mexico
-
2. South America
- 2.1. Brazil
- 2.2. Argentina
- 2.3. Rest of South America
-
3. Europe
- 3.1. United Kingdom
- 3.2. Germany
- 3.3. France
- 3.4. Italy
- 3.5. Spain
- 3.6. Russia
- 3.7. Benelux
- 3.8. Nordics
- 3.9. Rest of Europe
-
4. Middle East & Africa
- 4.1. Turkey
- 4.2. Israel
- 4.3. GCC
- 4.4. North Africa
- 4.5. South Africa
- 4.6. Rest of Middle East & Africa
-
5. Asia Pacific
- 5.1. China
- 5.2. India
- 5.3. Japan
- 5.4. South Korea
- 5.5. ASEAN
- 5.6. Oceania
- 5.7. Rest of Asia Pacific
Functional Beverages Industry in North America REPORT HIGHLIGHTS
| Aspects | Details |
|---|---|
| Study Period | 2019-2033 |
| Base Year | 2024 |
| Estimated Year | 2025 |
| Forecast Period | 2025-2033 |
| Historical Period | 2019-2024 |
| Growth Rate | CAGR of 6.90% from 2019-2033 |
| Segmentation |
|
Table of Contents
- 1. Introduction
- 1.1. Research Scope
- 1.2. Market Segmentation
- 1.3. Research Methodology
- 1.4. Definitions and Assumptions
- 2. Executive Summary
- 2.1. Introduction
- 3. Market Dynamics
- 3.1. Introduction
- 3.2. Market Drivers
- 3.2.1. Demand for specialty and organic coffee pods and capsules; Innovations in packaging formats
- 3.3. Market Restrains
- 3.3.1. Availability of counterfeit products
- 3.4. Market Trends
- 3.4.1. Flavor Innovations Leading to the Growth of the Market
- 4. Market Factor Analysis
- 4.1. Porters Five Forces
- 4.2. Supply/Value Chain
- 4.3. PESTEL analysis
- 4.4. Market Entropy
- 4.5. Patent/Trademark Analysis
- 5. Global Functional Beverages Industry in North America Analysis, Insights and Forecast, 2019-2031
- 5.1. Market Analysis, Insights and Forecast - by Type
- 5.1.1. Energy Drinks
- 5.1.2. Sports Drinks
- 5.1.3. Fortified Juice
- 5.1.4. Dairy and Dairy Alternative Beverage
- 5.1.5. Other Types
- 5.2. Market Analysis, Insights and Forecast - by Distribution Channel
- 5.2.1. Hypermarkets/Supermarkets
- 5.2.2. Drug stores and Pharmacies
- 5.2.3. Convenience Stores
- 5.2.4. Online Retail Stores
- 5.2.5. Other Distribution Channels
- 5.3. Market Analysis, Insights and Forecast - by Region
- 5.3.1. North America
- 5.3.2. South America
- 5.3.3. Europe
- 5.3.4. Middle East & Africa
- 5.3.5. Asia Pacific
- 5.1. Market Analysis, Insights and Forecast - by Type
- 6. North America Functional Beverages Industry in North America Analysis, Insights and Forecast, 2019-2031
- 6.1. Market Analysis, Insights and Forecast - by Type
- 6.1.1. Energy Drinks
- 6.1.2. Sports Drinks
- 6.1.3. Fortified Juice
- 6.1.4. Dairy and Dairy Alternative Beverage
- 6.1.5. Other Types
- 6.2. Market Analysis, Insights and Forecast - by Distribution Channel
- 6.2.1. Hypermarkets/Supermarkets
- 6.2.2. Drug stores and Pharmacies
- 6.2.3. Convenience Stores
- 6.2.4. Online Retail Stores
- 6.2.5. Other Distribution Channels
- 6.1. Market Analysis, Insights and Forecast - by Type
- 7. South America Functional Beverages Industry in North America Analysis, Insights and Forecast, 2019-2031
- 7.1. Market Analysis, Insights and Forecast - by Type
- 7.1.1. Energy Drinks
- 7.1.2. Sports Drinks
- 7.1.3. Fortified Juice
- 7.1.4. Dairy and Dairy Alternative Beverage
- 7.1.5. Other Types
- 7.2. Market Analysis, Insights and Forecast - by Distribution Channel
- 7.2.1. Hypermarkets/Supermarkets
- 7.2.2. Drug stores and Pharmacies
- 7.2.3. Convenience Stores
- 7.2.4. Online Retail Stores
- 7.2.5. Other Distribution Channels
- 7.1. Market Analysis, Insights and Forecast - by Type
- 8. Europe Functional Beverages Industry in North America Analysis, Insights and Forecast, 2019-2031
- 8.1. Market Analysis, Insights and Forecast - by Type
- 8.1.1. Energy Drinks
- 8.1.2. Sports Drinks
- 8.1.3. Fortified Juice
- 8.1.4. Dairy and Dairy Alternative Beverage
- 8.1.5. Other Types
- 8.2. Market Analysis, Insights and Forecast - by Distribution Channel
- 8.2.1. Hypermarkets/Supermarkets
- 8.2.2. Drug stores and Pharmacies
- 8.2.3. Convenience Stores
- 8.2.4. Online Retail Stores
- 8.2.5. Other Distribution Channels
- 8.1. Market Analysis, Insights and Forecast - by Type
- 9. Middle East & Africa Functional Beverages Industry in North America Analysis, Insights and Forecast, 2019-2031
- 9.1. Market Analysis, Insights and Forecast - by Type
- 9.1.1. Energy Drinks
- 9.1.2. Sports Drinks
- 9.1.3. Fortified Juice
- 9.1.4. Dairy and Dairy Alternative Beverage
- 9.1.5. Other Types
- 9.2. Market Analysis, Insights and Forecast - by Distribution Channel
- 9.2.1. Hypermarkets/Supermarkets
- 9.2.2. Drug stores and Pharmacies
- 9.2.3. Convenience Stores
- 9.2.4. Online Retail Stores
- 9.2.5. Other Distribution Channels
- 9.1. Market Analysis, Insights and Forecast - by Type
- 10. Asia Pacific Functional Beverages Industry in North America Analysis, Insights and Forecast, 2019-2031
- 10.1. Market Analysis, Insights and Forecast - by Type
- 10.1.1. Energy Drinks
- 10.1.2. Sports Drinks
- 10.1.3. Fortified Juice
- 10.1.4. Dairy and Dairy Alternative Beverage
- 10.1.5. Other Types
- 10.2. Market Analysis, Insights and Forecast - by Distribution Channel
- 10.2.1. Hypermarkets/Supermarkets
- 10.2.2. Drug stores and Pharmacies
- 10.2.3. Convenience Stores
- 10.2.4. Online Retail Stores
- 10.2.5. Other Distribution Channels
- 10.1. Market Analysis, Insights and Forecast - by Type
- 11. United States Functional Beverages Industry in North America Analysis, Insights and Forecast, 2019-2031
- 12. Canada Functional Beverages Industry in North America Analysis, Insights and Forecast, 2019-2031
- 13. Mexico Functional Beverages Industry in North America Analysis, Insights and Forecast, 2019-2031
- 14. Rest of North America Functional Beverages Industry in North America Analysis, Insights and Forecast, 2019-2031
- 15. Competitive Analysis
- 15.1. Global Market Share Analysis 2024
- 15.2. Company Profiles
- 15.2.1 Nestle SA
- 15.2.1.1. Overview
- 15.2.1.2. Products
- 15.2.1.3. SWOT Analysis
- 15.2.1.4. Recent Developments
- 15.2.1.5. Financials (Based on Availability)
- 15.2.2 Monster Beverage Corporation
- 15.2.2.1. Overview
- 15.2.2.2. Products
- 15.2.2.3. SWOT Analysis
- 15.2.2.4. Recent Developments
- 15.2.2.5. Financials (Based on Availability)
- 15.2.3 Pepsico Inc
- 15.2.3.1. Overview
- 15.2.3.2. Products
- 15.2.3.3. SWOT Analysis
- 15.2.3.4. Recent Developments
- 15.2.3.5. Financials (Based on Availability)
- 15.2.4 Glanbia PLC
- 15.2.4.1. Overview
- 15.2.4.2. Products
- 15.2.4.3. SWOT Analysis
- 15.2.4.4. Recent Developments
- 15.2.4.5. Financials (Based on Availability)
- 15.2.5 Danone SA
- 15.2.5.1. Overview
- 15.2.5.2. Products
- 15.2.5.3. SWOT Analysis
- 15.2.5.4. Recent Developments
- 15.2.5.5. Financials (Based on Availability)
- 15.2.6 Red Bull GmbH
- 15.2.6.1. Overview
- 15.2.6.2. Products
- 15.2.6.3. SWOT Analysis
- 15.2.6.4. Recent Developments
- 15.2.6.5. Financials (Based on Availability)
- 15.2.7 The Hain Celestial Group Inc *List Not Exhaustive
- 15.2.7.1. Overview
- 15.2.7.2. Products
- 15.2.7.3. SWOT Analysis
- 15.2.7.4. Recent Developments
- 15.2.7.5. Financials (Based on Availability)
- 15.2.8 The Coca-Cola Company
- 15.2.8.1. Overview
- 15.2.8.2. Products
- 15.2.8.3. SWOT Analysis
- 15.2.8.4. Recent Developments
- 15.2.8.5. Financials (Based on Availability)
- 15.2.9 Campbell Soup Company
- 15.2.9.1. Overview
- 15.2.9.2. Products
- 15.2.9.3. SWOT Analysis
- 15.2.9.4. Recent Developments
- 15.2.9.5. Financials (Based on Availability)
- 15.2.10 General Nutrition Centers Inc
- 15.2.10.1. Overview
- 15.2.10.2. Products
- 15.2.10.3. SWOT Analysis
- 15.2.10.4. Recent Developments
- 15.2.10.5. Financials (Based on Availability)
- 15.2.1 Nestle SA
List of Figures
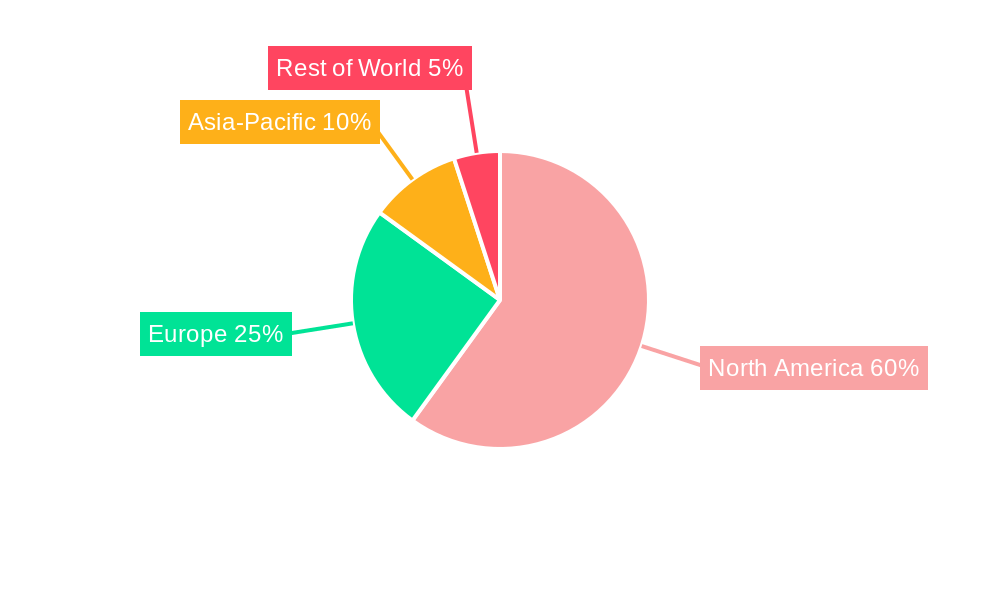
- Figure 1: Global Functional Beverages Industry in North America Revenue Breakdown (Million, %) by Region 2024 & 2032
- Figure 2: North America Functional Beverages Industry in North America Revenue (Million), by Country 2024 & 2032
- Figure 3: North America Functional Beverages Industry in North America Revenue Share (%), by Country 2024 & 2032
- Figure 4: North America Functional Beverages Industry in North America Revenue (Million), by Type 2024 & 2032
- Figure 5: North America Functional Beverages Industry in North America Revenue Share (%), by Type 2024 & 2032
- Figure 6: North America Functional Beverages Industry in North America Revenue (Million), by Distribution Channel 2024 & 2032
- Figure 7: North America Functional Beverages Industry in North America Revenue Share (%), by Distribution Channel 2024 & 2032
- Figure 8: North America Functional Beverages Industry in North America Revenue (Million), by Country 2024 & 2032
- Figure 9: North America Functional Beverages Industry in North America Revenue Share (%), by Country 2024 & 2032
- Figure 10: South America Functional Beverages Industry in North America Revenue (Million), by Type 2024 & 2032
- Figure 11: South America Functional Beverages Industry in North America Revenue Share (%), by Type 2024 & 2032
- Figure 12: South America Functional Beverages Industry in North America Revenue (Million), by Distribution Channel 2024 & 2032
- Figure 13: South America Functional Beverages Industry in North America Revenue Share (%), by Distribution Channel 2024 & 2032
- Figure 14: South America Functional Beverages Industry in North America Revenue (Million), by Country 2024 & 2032
- Figure 15: South America Functional Beverages Industry in North America Revenue Share (%), by Country 2024 & 2032
- Figure 16: Europe Functional Beverages Industry in North America Revenue (Million), by Type 2024 & 2032
- Figure 17: Europe Functional Beverages Industry in North America Revenue Share (%), by Type 2024 & 2032
- Figure 18: Europe Functional Beverages Industry in North America Revenue (Million), by Distribution Channel 2024 & 2032
- Figure 19: Europe Functional Beverages Industry in North America Revenue Share (%), by Distribution Channel 2024 & 2032
- Figure 20: Europe Functional Beverages Industry in North America Revenue (Million), by Country 2024 & 2032
- Figure 21: Europe Functional Beverages Industry in North America Revenue Share (%), by Country 2024 & 2032
- Figure 22: Middle East & Africa Functional Beverages Industry in North America Revenue (Million), by Type 2024 & 2032
- Figure 23: Middle East & Africa Functional Beverages Industry in North America Revenue Share (%), by Type 2024 & 2032
- Figure 24: Middle East & Africa Functional Beverages Industry in North America Revenue (Million), by Distribution Channel 2024 & 2032
- Figure 25: Middle East & Africa Functional Beverages Industry in North America Revenue Share (%), by Distribution Channel 2024 & 2032
- Figure 26: Middle East & Africa Functional Beverages Industry in North America Revenue (Million), by Country 2024 & 2032
- Figure 27: Middle East & Africa Functional Beverages Industry in North America Revenue Share (%), by Country 2024 & 2032
- Figure 28: Asia Pacific Functional Beverages Industry in North America Revenue (Million), by Type 2024 & 2032
- Figure 29: Asia Pacific Functional Beverages Industry in North America Revenue Share (%), by Type 2024 & 2032
- Figure 30: Asia Pacific Functional Beverages Industry in North America Revenue (Million), by Distribution Channel 2024 & 2032
- Figure 31: Asia Pacific Functional Beverages Industry in North America Revenue Share (%), by Distribution Channel 2024 & 2032
- Figure 32: Asia Pacific Functional Beverages Industry in North America Revenue (Million), by Country 2024 & 2032
- Figure 33: Asia Pacific Functional Beverages Industry in North America Revenue Share (%), by Country 2024 & 2032
List of Tables
- Table 1: Global Functional Beverages Industry in North America Revenue Million Forecast, by Region 2019 & 2032
- Table 2: Global Functional Beverages Industry in North America Revenue Million Forecast, by Type 2019 & 2032
- Table 3: Global Functional Beverages Industry in North America Revenue Million Forecast, by Distribution Channel 2019 & 2032
- Table 4: Global Functional Beverages Industry in North America Revenue Million Forecast, by Region 2019 & 2032
- Table 5: Global Functional Beverages Industry in North America Revenue Million Forecast, by Country 2019 & 2032
- Table 6: United States Functional Beverages Industry in North America Revenue (Million) Forecast, by Application 2019 & 2032
- Table 7: Canada Functional Beverages Industry in North America Revenue (Million) Forecast, by Application 2019 & 2032
- Table 8: Mexico Functional Beverages Industry in North America Revenue (Million) Forecast, by Application 2019 & 2032
- Table 9: Rest of North America Functional Beverages Industry in North America Revenue (Million) Forecast, by Application 2019 & 2032
- Table 10: Global Functional Beverages Industry in North America Revenue Million Forecast, by Type 2019 & 2032
- Table 11: Global Functional Beverages Industry in North America Revenue Million Forecast, by Distribution Channel 2019 & 2032
- Table 12: Global Functional Beverages Industry in North America Revenue Million Forecast, by Country 2019 & 2032
- Table 13: United States Functional Beverages Industry in North America Revenue (Million) Forecast, by Application 2019 & 2032
- Table 14: Canada Functional Beverages Industry in North America Revenue (Million) Forecast, by Application 2019 & 2032
- Table 15: Mexico Functional Beverages Industry in North America Revenue (Million) Forecast, by Application 2019 & 2032
- Table 16: Global Functional Beverages Industry in North America Revenue Million Forecast, by Type 2019 & 2032
- Table 17: Global Functional Beverages Industry in North America Revenue Million Forecast, by Distribution Channel 2019 & 2032
- Table 18: Global Functional Beverages Industry in North America Revenue Million Forecast, by Country 2019 & 2032
- Table 19: Brazil Functional Beverages Industry in North America Revenue (Million) Forecast, by Application 2019 & 2032
- Table 20: Argentina Functional Beverages Industry in North America Revenue (Million) Forecast, by Application 2019 & 2032
- Table 21: Rest of South America Functional Beverages Industry in North America Revenue (Million) Forecast, by Application 2019 & 2032
- Table 22: Global Functional Beverages Industry in North America Revenue Million Forecast, by Type 2019 & 2032
- Table 23: Global Functional Beverages Industry in North America Revenue Million Forecast, by Distribution Channel 2019 & 2032
- Table 24: Global Functional Beverages Industry in North America Revenue Million Forecast, by Country 2019 & 2032
- Table 25: United Kingdom Functional Beverages Industry in North America Revenue (Million) Forecast, by Application 2019 & 2032
- Table 26: Germany Functional Beverages Industry in North America Revenue (Million) Forecast, by Application 2019 & 2032
- Table 27: France Functional Beverages Industry in North America Revenue (Million) Forecast, by Application 2019 & 2032
- Table 28: Italy Functional Beverages Industry in North America Revenue (Million) Forecast, by Application 2019 & 2032
- Table 29: Spain Functional Beverages Industry in North America Revenue (Million) Forecast, by Application 2019 & 2032
- Table 30: Russia Functional Beverages Industry in North America Revenue (Million) Forecast, by Application 2019 & 2032
- Table 31: Benelux Functional Beverages Industry in North America Revenue (Million) Forecast, by Application 2019 & 2032
- Table 32: Nordics Functional Beverages Industry in North America Revenue (Million) Forecast, by Application 2019 & 2032
- Table 33: Rest of Europe Functional Beverages Industry in North America Revenue (Million) Forecast, by Application 2019 & 2032
- Table 34: Global Functional Beverages Industry in North America Revenue Million Forecast, by Type 2019 & 2032
- Table 35: Global Functional Beverages Industry in North America Revenue Million Forecast, by Distribution Channel 2019 & 2032
- Table 36: Global Functional Beverages Industry in North America Revenue Million Forecast, by Country 2019 & 2032
- Table 37: Turkey Functional Beverages Industry in North America Revenue (Million) Forecast, by Application 2019 & 2032
- Table 38: Israel Functional Beverages Industry in North America Revenue (Million) Forecast, by Application 2019 & 2032
- Table 39: GCC Functional Beverages Industry in North America Revenue (Million) Forecast, by Application 2019 & 2032
- Table 40: North Africa Functional Beverages Industry in North America Revenue (Million) Forecast, by Application 2019 & 2032
- Table 41: South Africa Functional Beverages Industry in North America Revenue (Million) Forecast, by Application 2019 & 2032
- Table 42: Rest of Middle East & Africa Functional Beverages Industry in North America Revenue (Million) Forecast, by Application 2019 & 2032
- Table 43: Global Functional Beverages Industry in North America Revenue Million Forecast, by Type 2019 & 2032
- Table 44: Global Functional Beverages Industry in North America Revenue Million Forecast, by Distribution Channel 2019 & 2032
- Table 45: Global Functional Beverages Industry in North America Revenue Million Forecast, by Country 2019 & 2032
- Table 46: China Functional Beverages Industry in North America Revenue (Million) Forecast, by Application 2019 & 2032
- Table 47: India Functional Beverages Industry in North America Revenue (Million) Forecast, by Application 2019 & 2032
- Table 48: Japan Functional Beverages Industry in North America Revenue (Million) Forecast, by Application 2019 & 2032
- Table 49: South Korea Functional Beverages Industry in North America Revenue (Million) Forecast, by Application 2019 & 2032
- Table 50: ASEAN Functional Beverages Industry in North America Revenue (Million) Forecast, by Application 2019 & 2032
- Table 51: Oceania Functional Beverages Industry in North America Revenue (Million) Forecast, by Application 2019 & 2032
- Table 52: Rest of Asia Pacific Functional Beverages Industry in North America Revenue (Million) Forecast, by Application 2019 & 2032
Frequently Asked Questions
1. What is the projected Compound Annual Growth Rate (CAGR) of the Functional Beverages Industry in North America?
The projected CAGR is approximately 6.90%.
2. Which companies are prominent players in the Functional Beverages Industry in North America?
Key companies in the market include Nestle SA, Monster Beverage Corporation, Pepsico Inc, Glanbia PLC, Danone SA, Red Bull GmbH, The Hain Celestial Group Inc *List Not Exhaustive, The Coca-Cola Company, Campbell Soup Company, General Nutrition Centers Inc.
3. What are the main segments of the Functional Beverages Industry in North America?
The market segments include Type, Distribution Channel.
4. Can you provide details about the market size?
The market size is estimated to be USD 54.20 Million as of 2022.
5. What are some drivers contributing to market growth?
Demand for specialty and organic coffee pods and capsules; Innovations in packaging formats.
6. What are the notable trends driving market growth?
Flavor Innovations Leading to the Growth of the Market.
7. Are there any restraints impacting market growth?
Availability of counterfeit products.
8. Can you provide examples of recent developments in the market?
February 2022: Tropicana Light products introduced two flavors -Berry Colada and Tropical Sunrise. The new drinks featured 70% fewer calories and no added sugar than current Tropicana Premium Drinks brands. They are claimed to be a strong source of vitamin C and contain 15% juice. Both are sold at the suggested retail price of USD 2.79 per 52 oz bottle in grocery stores across the United States.
9. What pricing options are available for accessing the report?
Pricing options include single-user, multi-user, and enterprise licenses priced at USD 4750, USD 5250, and USD 8750 respectively.
10. Is the market size provided in terms of value or volume?
The market size is provided in terms of value, measured in Million.
11. Are there any specific market keywords associated with the report?
Yes, the market keyword associated with the report is "Functional Beverages Industry in North America," which aids in identifying and referencing the specific market segment covered.
12. How do I determine which pricing option suits my needs best?
The pricing options vary based on user requirements and access needs. Individual users may opt for single-user licenses, while businesses requiring broader access may choose multi-user or enterprise licenses for cost-effective access to the report.
13. Are there any additional resources or data provided in the Functional Beverages Industry in North America report?
While the report offers comprehensive insights, it's advisable to review the specific contents or supplementary materials provided to ascertain if additional resources or data are available.
14. How can I stay updated on further developments or reports in the Functional Beverages Industry in North America?
To stay informed about further developments, trends, and reports in the Functional Beverages Industry in North America, consider subscribing to industry newsletters, following relevant companies and organizations, or regularly checking reputable industry news sources and publications.
Methodology
Step 1 - Identification of Relevant Samples Size from Population Database


Step 2 - Approaches for Defining Global Market Size (Value, Volume* & Price*)

Note*: In applicable scenarios
Step 3 - Data Sources
Primary Research
- Web Analytics
- Survey Reports
- Research Institute
- Latest Research Reports
- Opinion Leaders
Secondary Research
- Annual Reports
- White Paper
- Latest Press Release
- Industry Association
- Paid Database
- Investor Presentations

Step 4 - Data Triangulation
Involves using different sources of information in order to increase the validity of a study
These sources are likely to be stakeholders in a program - participants, other researchers, program staff, other community members, and so on.
Then we put all data in single framework & apply various statistical tools to find out the dynamic on the market.
During the analysis stage, feedback from the stakeholder groups would be compared to determine areas of agreement as well as areas of divergence
