

Key Insights
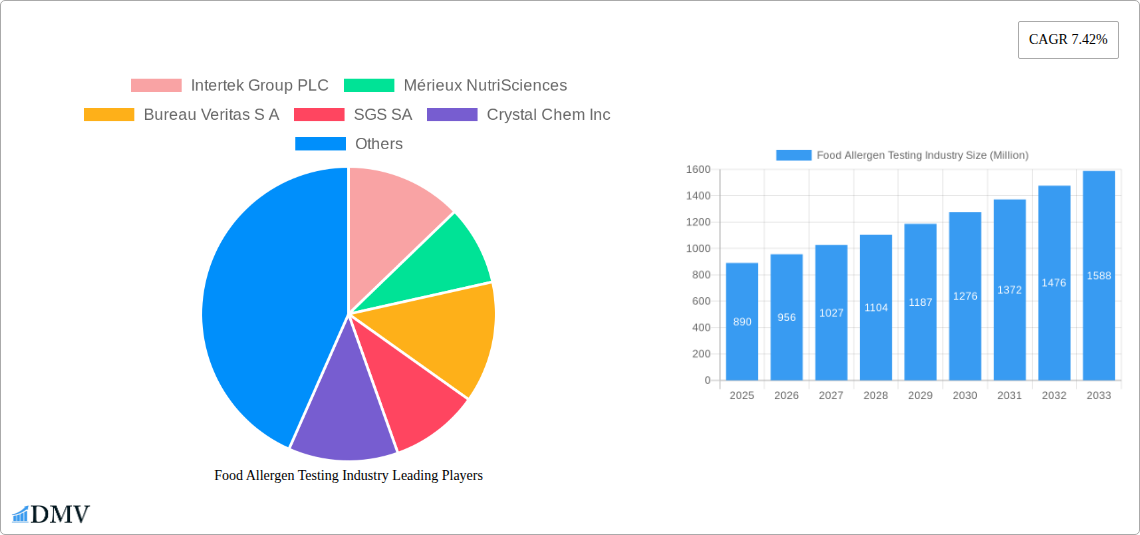
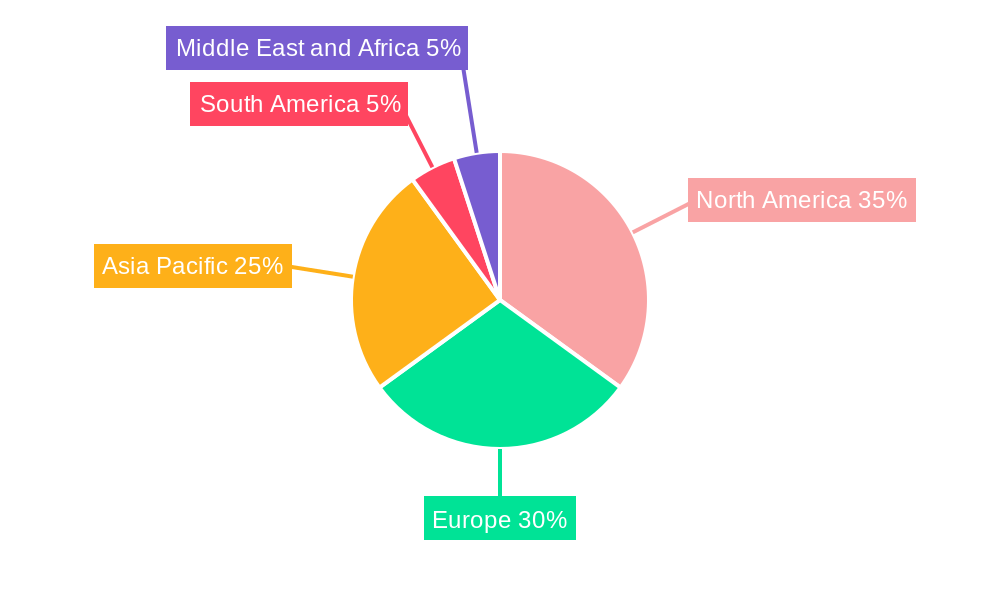
The global food allergen testing market, valued at $0.89 billion in 2025, is projected to experience robust growth, driven by increasing consumer awareness of food allergies and stricter regulations mandating allergen testing. The rising prevalence of food allergies across various demographics, coupled with heightened demand for safe and allergen-free food products, fuels market expansion. Technological advancements in allergen detection, particularly the adoption of rapid and sensitive methods like ELISA and PCR-based tests, contribute significantly to market growth. The market is segmented by application (seafood and meat, dairy, beverages, bakery, baby food, and others) and technology, with immunoassay-based methods currently holding a dominant share. Growth is further propelled by the increasing outsourcing of testing services to specialized laboratories, driven by factors such as cost-effectiveness and access to advanced technologies. However, factors like the high cost of advanced testing technologies and the potential for false-negative results can restrain market growth to some extent. The significant presence of established players like Intertek, Mérieux NutriSciences, and Eurofins Scientific in the market indicates a competitive landscape, with companies focusing on innovation and expansion to cater to growing market needs. Geographic segmentation reveals strong growth prospects in North America and Europe, driven by higher regulatory stringency and consumer awareness, while the Asia-Pacific region is expected to show significant growth potential due to rapid economic development and rising disposable incomes.
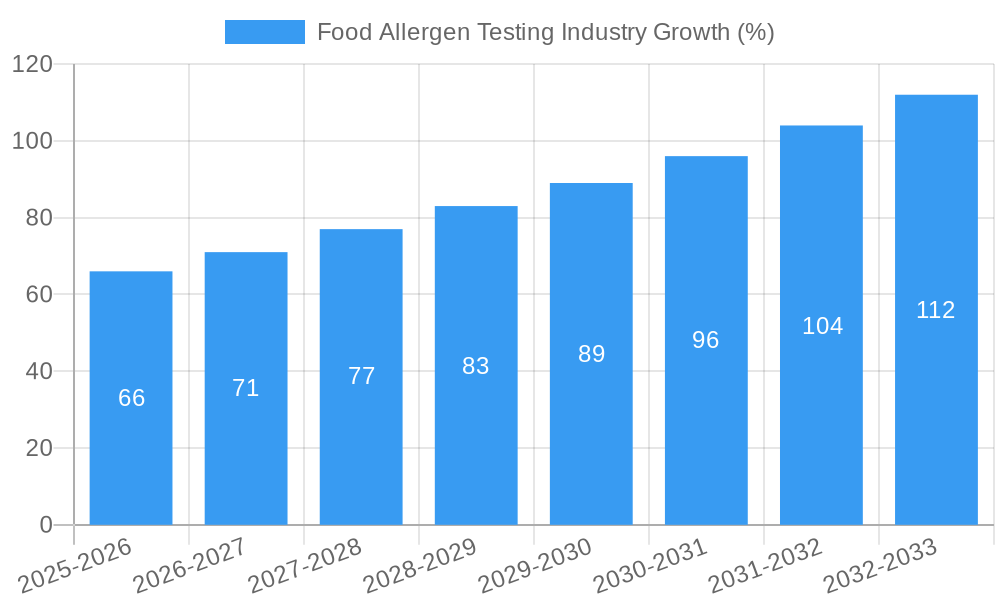
The forecast period (2025-2033) suggests a consistent growth trajectory for the food allergen testing market. The 7.42% CAGR indicates a substantial increase in market value by 2033. This growth will likely be driven by continued technological advancements leading to more accurate, faster, and cost-effective testing methods. Expanding regulations and consumer demand for transparency and safety in the food supply chain will further contribute to market expansion. Competition among established players and the emergence of new entrants will likely intensify, leading to innovative solutions and service offerings within the industry. Market segmentation by application is likely to remain relevant, with continued focus on high-volume food categories like dairy, bakery, and processed foods. Regional variations in growth will persist, influenced by differences in regulatory landscapes, economic conditions, and consumer awareness levels.
Food Allergen Testing Industry Market Report: 2019-2033
This comprehensive report provides a detailed analysis of the global Food Allergen Testing market, offering invaluable insights for stakeholders across the industry. The study period spans from 2019 to 2033, with 2025 serving as both the base and estimated year. The report projects a market valued at $XX Billion in 2025, experiencing robust growth during the forecast period (2025-2033). This in-depth analysis covers market segmentation, competitive landscape, technological advancements, and future growth prospects, providing a complete overview for strategic decision-making.
Food Allergen Testing Industry Market Composition & Trends
The global food allergen testing market, estimated at $XX Billion in 2025, demonstrates moderate concentration with key players holding significant market share. The market is characterized by continuous innovation driven by stringent regulatory landscapes and growing consumer awareness of food allergies. Substitute products are limited, mainly due to the accuracy and regulatory compliance required for allergen testing. End-users include food manufacturers, processors, retailers, and regulatory agencies. Mergers and acquisitions (M&A) activity is significant, with deal values exceeding $XX Billion in the historical period (2019-2024). This activity is driven by the need for expansion and diversification in the market.
- Market Share Distribution (2025): Intertek Group PLC (XX%), Mérieux NutriSciences (XX%), Bureau Veritas S A (XX%), SGS SA (XX%), Others (XX%).
- M&A Deal Values (2019-2024): $XX Billion.
- Key Market Drivers: Stringent food safety regulations, increasing prevalence of food allergies, rising consumer demand for transparency and traceability, and technological advancements in allergen detection.
- Key Challenges: High testing costs, complex regulatory landscape varying across regions, and the need for continuous technological upgrades to maintain accuracy and efficiency.
Food Allergen Testing Industry Industry Evolution
The food allergen testing industry has witnessed significant growth fueled by heightened consumer awareness, stricter food safety regulations, and technological advancements. From 2019 to 2024, the market experienced a Compound Annual Growth Rate (CAGR) of XX%, driven by increasing demand for accurate and reliable allergen detection methods. Technological advancements, particularly in immunoassay-based/ELISA and PCR-based testing, have significantly improved the speed, sensitivity, and accuracy of allergen detection. Simultaneously, evolving consumer preferences for transparency and traceability are further boosting demand for rigorous allergen testing across the food supply chain. The market is expected to continue its growth trajectory, with a projected CAGR of XX% during the forecast period (2025-2033), fueled by continued technological innovation and increased regulatory scrutiny.
Leading Regions, Countries, or Segments in Food Allergen Testing Industry
The North American region currently holds the largest market share, driven by stringent regulations and high consumer awareness of food allergies. Within applications, the Seafood and Meat Products segment leads, followed by Dairy Products and Baby Food and Infant Formula. Immunoassay-based/ELISA technology dominates the market due to its cost-effectiveness and relatively simpler operation.
- Key Drivers (North America): Stringent FDA regulations, high prevalence of food allergies, and strong consumer demand for allergen-free products.
- Key Drivers (Europe): Stringent EU regulations (e.g., Food Information to Consumers Regulation), growing consumer awareness, and a large food processing industry.
- Key Drivers (Immunoassay-based/ELISA): Established technology, relatively lower cost compared to PCR, and wide availability of commercial kits.
The dominance of North America is attributed to factors such as stringent regulatory frameworks, high consumer awareness of food allergies, and a well-established food processing industry. The strong focus on food safety and the prevalence of allergies within this region propel market growth significantly.
Food Allergen Testing Industry Product Innovations
Recent innovations include faster, more sensitive tests, portable devices for on-site testing, and multiplex assays capable of simultaneously detecting multiple allergens. These advancements significantly improve efficiency and reduce the time required for allergen detection, enabling quicker responses to potential contamination incidents and ensuring food safety. Companies are focusing on improving test sensitivity, reducing turnaround time, and offering user-friendly devices to meet growing industry needs. The development of multiplexed assays allows for simultaneous detection of numerous allergens, thereby increasing efficiency and cost-effectiveness.
Propelling Factors for Food Allergen Testing Industry Growth
The food allergen testing market is propelled by several key factors: increasing prevalence of food allergies globally, stricter government regulations mandating allergen testing, rising consumer demand for safe and labeled products, and continuous technological advancements leading to faster, more accurate, and cost-effective tests. The growing adoption of advanced technologies, such as PCR and ELISA-based methods, alongside the increasing availability of accurate and reliable tests, further drives market growth.
Obstacles in the Food Allergen Testing Industry Market
The market faces several challenges, including the high cost of advanced testing technologies, variability in regulatory standards across different regions, potential supply chain disruptions affecting the availability of testing kits and reagents, and intense competition among established players. These factors can impact the accessibility and affordability of allergen testing, hindering market expansion.
Future Opportunities in Food Allergen Testing Industry
Future opportunities lie in developing point-of-care testing devices, expanding into emerging markets with growing consumer awareness, integrating advanced technologies like AI and machine learning to improve test accuracy and efficiency, and exploring new applications such as environmental allergen monitoring. This will lead to greater accessibility, speed, and accuracy in allergen detection.
Major Players in the Food Allergen Testing Industry Ecosystem
- Intertek Group PLC
- Mérieux NutriSciences
- Bureau Veritas S A
- SGS SA
- Crystal Chem Inc
- Lifeasible
- ALS Limited
- Microbac Laboratories Inc
- Eurofins Scientific SE
- Neogen Corporation
Key Developments in Food Allergen Testing Industry Industry
- March 2024: Gold Standard Diagnostics launched the SENSIStrip Gluten PowerLine Lateral Flow Device, a sensitive gluten detection system.
- March 2024: ALS acquired York Analytical Laboratories and Wessling Holding GmbH & Co., expanding its Life Sciences presence.
- February 2024: Mérieux NutriSciences opened a new food analysis laboratory in Maringá, Brazil.
Strategic Food Allergen Testing Industry Market Forecast
The food allergen testing market is poised for continued growth, driven by technological advancements, regulatory pressures, and rising consumer awareness. Future opportunities include the expansion into emerging markets, the development of faster and more accurate testing methods, and the integration of new technologies to improve efficiency and reduce costs. The market is expected to witness significant expansion in the coming years, presenting lucrative opportunities for industry players.
Food Allergen Testing Industry Segmentation
-
1. Technology
- 1.1. Immunoassay-based /ELISA
- 1.2. PCR (Polymerase Chain Reaction)-based
- 1.3. Other Technologies
-
2. Application
- 2.1. Seafood and Meat Products
- 2.2. Dairy Products
- 2.3. Beverages
- 2.4. Bakery and Confectionery
- 2.5. Baby Food and Infant Formula
- 2.6. Other Applications
Food Allergen Testing Industry Segmentation By Geography
-
1. North America
- 1.1. United States
- 1.2. Canada
- 1.3. Mexico
- 1.4. Rest of North America
-
2. Europe
- 2.1. Germany
- 2.2. United Kingdom
- 2.3. France
- 2.4. Russia
- 2.5. Spain
- 2.6. Italy
- 2.7. Rest of Europe
-
3. Asia Pacific
- 3.1. India
- 3.2. China
- 3.3. Japan
- 3.4. Australia
- 3.5. Rest of Asia Pacific
-
4. South America
- 4.1. Brazil
- 4.2. Argentina
- 4.3. Rest of South America
-
5. Middle East and Africa
- 5.1. South Africa
- 5.2. Saudi Arabia
- 5.3. Rest of Middle East and Africa
Food Allergen Testing Industry REPORT HIGHLIGHTS
| Aspects | Details |
|---|---|
| Study Period | 2019-2033 |
| Base Year | 2024 |
| Estimated Year | 2025 |
| Forecast Period | 2025-2033 |
| Historical Period | 2019-2024 |
| Growth Rate | CAGR of 7.42% from 2019-2033 |
| Segmentation |
|
Table of Contents
- 1. Introduction
- 1.1. Research Scope
- 1.2. Market Segmentation
- 1.3. Research Methodology
- 1.4. Definitions and Assumptions
- 2. Executive Summary
- 2.1. Introduction
- 3. Market Dynamics
- 3.1. Introduction
- 3.2. Market Drivers
- 3.2.1. Increasing Incidences of Food Allergies; Favorable Government Initiatives and Regulations for Food Safety
- 3.3. Market Restrains
- 3.3.1. Inconsistencies Involved in Food Allergen Declarations
- 3.4. Market Trends
- 3.4.1. Increasing Prevalence of Food Allergies
- 4. Market Factor Analysis
- 4.1. Porters Five Forces
- 4.2. Supply/Value Chain
- 4.3. PESTEL analysis
- 4.4. Market Entropy
- 4.5. Patent/Trademark Analysis
- 5. Global Food Allergen Testing Industry Analysis, Insights and Forecast, 2019-2031
- 5.1. Market Analysis, Insights and Forecast - by Technology
- 5.1.1. Immunoassay-based /ELISA
- 5.1.2. PCR (Polymerase Chain Reaction)-based
- 5.1.3. Other Technologies
- 5.2. Market Analysis, Insights and Forecast - by Application
- 5.2.1. Seafood and Meat Products
- 5.2.2. Dairy Products
- 5.2.3. Beverages
- 5.2.4. Bakery and Confectionery
- 5.2.5. Baby Food and Infant Formula
- 5.2.6. Other Applications
- 5.3. Market Analysis, Insights and Forecast - by Region
- 5.3.1. North America
- 5.3.2. Europe
- 5.3.3. Asia Pacific
- 5.3.4. South America
- 5.3.5. Middle East and Africa
- 5.1. Market Analysis, Insights and Forecast - by Technology
- 6. North America Food Allergen Testing Industry Analysis, Insights and Forecast, 2019-2031
- 6.1. Market Analysis, Insights and Forecast - by Technology
- 6.1.1. Immunoassay-based /ELISA
- 6.1.2. PCR (Polymerase Chain Reaction)-based
- 6.1.3. Other Technologies
- 6.2. Market Analysis, Insights and Forecast - by Application
- 6.2.1. Seafood and Meat Products
- 6.2.2. Dairy Products
- 6.2.3. Beverages
- 6.2.4. Bakery and Confectionery
- 6.2.5. Baby Food and Infant Formula
- 6.2.6. Other Applications
- 6.1. Market Analysis, Insights and Forecast - by Technology
- 7. Europe Food Allergen Testing Industry Analysis, Insights and Forecast, 2019-2031
- 7.1. Market Analysis, Insights and Forecast - by Technology
- 7.1.1. Immunoassay-based /ELISA
- 7.1.2. PCR (Polymerase Chain Reaction)-based
- 7.1.3. Other Technologies
- 7.2. Market Analysis, Insights and Forecast - by Application
- 7.2.1. Seafood and Meat Products
- 7.2.2. Dairy Products
- 7.2.3. Beverages
- 7.2.4. Bakery and Confectionery
- 7.2.5. Baby Food and Infant Formula
- 7.2.6. Other Applications
- 7.1. Market Analysis, Insights and Forecast - by Technology
- 8. Asia Pacific Food Allergen Testing Industry Analysis, Insights and Forecast, 2019-2031
- 8.1. Market Analysis, Insights and Forecast - by Technology
- 8.1.1. Immunoassay-based /ELISA
- 8.1.2. PCR (Polymerase Chain Reaction)-based
- 8.1.3. Other Technologies
- 8.2. Market Analysis, Insights and Forecast - by Application
- 8.2.1. Seafood and Meat Products
- 8.2.2. Dairy Products
- 8.2.3. Beverages
- 8.2.4. Bakery and Confectionery
- 8.2.5. Baby Food and Infant Formula
- 8.2.6. Other Applications
- 8.1. Market Analysis, Insights and Forecast - by Technology
- 9. South America Food Allergen Testing Industry Analysis, Insights and Forecast, 2019-2031
- 9.1. Market Analysis, Insights and Forecast - by Technology
- 9.1.1. Immunoassay-based /ELISA
- 9.1.2. PCR (Polymerase Chain Reaction)-based
- 9.1.3. Other Technologies
- 9.2. Market Analysis, Insights and Forecast - by Application
- 9.2.1. Seafood and Meat Products
- 9.2.2. Dairy Products
- 9.2.3. Beverages
- 9.2.4. Bakery and Confectionery
- 9.2.5. Baby Food and Infant Formula
- 9.2.6. Other Applications
- 9.1. Market Analysis, Insights and Forecast - by Technology
- 10. Middle East and Africa Food Allergen Testing Industry Analysis, Insights and Forecast, 2019-2031
- 10.1. Market Analysis, Insights and Forecast - by Technology
- 10.1.1. Immunoassay-based /ELISA
- 10.1.2. PCR (Polymerase Chain Reaction)-based
- 10.1.3. Other Technologies
- 10.2. Market Analysis, Insights and Forecast - by Application
- 10.2.1. Seafood and Meat Products
- 10.2.2. Dairy Products
- 10.2.3. Beverages
- 10.2.4. Bakery and Confectionery
- 10.2.5. Baby Food and Infant Formula
- 10.2.6. Other Applications
- 10.1. Market Analysis, Insights and Forecast - by Technology
- 11. North America Food Allergen Testing Industry Analysis, Insights and Forecast, 2019-2031
- 11.1. Market Analysis, Insights and Forecast - By Country/Sub-region
- 11.1.1 United States
- 11.1.2 Canada
- 11.1.3 Mexico
- 11.1.4 Rest of North America
- 12. Europe Food Allergen Testing Industry Analysis, Insights and Forecast, 2019-2031
- 12.1. Market Analysis, Insights and Forecast - By Country/Sub-region
- 12.1.1 Germany
- 12.1.2 United Kingdom
- 12.1.3 France
- 12.1.4 Russia
- 12.1.5 Spain
- 12.1.6 Italy
- 12.1.7 Rest of Europe
- 13. Asia Pacific Food Allergen Testing Industry Analysis, Insights and Forecast, 2019-2031
- 13.1. Market Analysis, Insights and Forecast - By Country/Sub-region
- 13.1.1 India
- 13.1.2 China
- 13.1.3 Japan
- 13.1.4 Australia
- 13.1.5 Rest of Asia Pacific
- 14. South America Food Allergen Testing Industry Analysis, Insights and Forecast, 2019-2031
- 14.1. Market Analysis, Insights and Forecast - By Country/Sub-region
- 14.1.1 Brazil
- 14.1.2 Argentina
- 14.1.3 Rest of South America
- 15. Middle East and Africa Food Allergen Testing Industry Analysis, Insights and Forecast, 2019-2031
- 15.1. Market Analysis, Insights and Forecast - By Country/Sub-region
- 15.1.1 South Africa
- 15.1.2 Saudi Arabia
- 15.1.3 Rest of Middle East and Africa
- 16. Competitive Analysis
- 16.1. Global Market Share Analysis 2024
- 16.2. Company Profiles
- 16.2.1 Intertek Group PLC
- 16.2.1.1. Overview
- 16.2.1.2. Products
- 16.2.1.3. SWOT Analysis
- 16.2.1.4. Recent Developments
- 16.2.1.5. Financials (Based on Availability)
- 16.2.2 Mérieux NutriSciences
- 16.2.2.1. Overview
- 16.2.2.2. Products
- 16.2.2.3. SWOT Analysis
- 16.2.2.4. Recent Developments
- 16.2.2.5. Financials (Based on Availability)
- 16.2.3 Bureau Veritas S A
- 16.2.3.1. Overview
- 16.2.3.2. Products
- 16.2.3.3. SWOT Analysis
- 16.2.3.4. Recent Developments
- 16.2.3.5. Financials (Based on Availability)
- 16.2.4 SGS SA
- 16.2.4.1. Overview
- 16.2.4.2. Products
- 16.2.4.3. SWOT Analysis
- 16.2.4.4. Recent Developments
- 16.2.4.5. Financials (Based on Availability)
- 16.2.5 Crystal Chem Inc
- 16.2.5.1. Overview
- 16.2.5.2. Products
- 16.2.5.3. SWOT Analysis
- 16.2.5.4. Recent Developments
- 16.2.5.5. Financials (Based on Availability)
- 16.2.6 Lifeasible
- 16.2.6.1. Overview
- 16.2.6.2. Products
- 16.2.6.3. SWOT Analysis
- 16.2.6.4. Recent Developments
- 16.2.6.5. Financials (Based on Availability)
- 16.2.7 ALS Limited
- 16.2.7.1. Overview
- 16.2.7.2. Products
- 16.2.7.3. SWOT Analysis
- 16.2.7.4. Recent Developments
- 16.2.7.5. Financials (Based on Availability)
- 16.2.8 Microbac Laboratories Inc
- 16.2.8.1. Overview
- 16.2.8.2. Products
- 16.2.8.3. SWOT Analysis
- 16.2.8.4. Recent Developments
- 16.2.8.5. Financials (Based on Availability)
- 16.2.9 Eurofins Scientific SE
- 16.2.9.1. Overview
- 16.2.9.2. Products
- 16.2.9.3. SWOT Analysis
- 16.2.9.4. Recent Developments
- 16.2.9.5. Financials (Based on Availability)
- 16.2.10 Neogen Corporation
- 16.2.10.1. Overview
- 16.2.10.2. Products
- 16.2.10.3. SWOT Analysis
- 16.2.10.4. Recent Developments
- 16.2.10.5. Financials (Based on Availability)
- 16.2.1 Intertek Group PLC
List of Figures
- Figure 1: Global Food Allergen Testing Industry Revenue Breakdown (Million, %) by Region 2024 & 2032
- Figure 2: North America Food Allergen Testing Industry Revenue (Million), by Country 2024 & 2032
- Figure 3: North America Food Allergen Testing Industry Revenue Share (%), by Country 2024 & 2032
- Figure 4: Europe Food Allergen Testing Industry Revenue (Million), by Country 2024 & 2032
- Figure 5: Europe Food Allergen Testing Industry Revenue Share (%), by Country 2024 & 2032
- Figure 6: Asia Pacific Food Allergen Testing Industry Revenue (Million), by Country 2024 & 2032
- Figure 7: Asia Pacific Food Allergen Testing Industry Revenue Share (%), by Country 2024 & 2032
- Figure 8: South America Food Allergen Testing Industry Revenue (Million), by Country 2024 & 2032
- Figure 9: South America Food Allergen Testing Industry Revenue Share (%), by Country 2024 & 2032
- Figure 10: Middle East and Africa Food Allergen Testing Industry Revenue (Million), by Country 2024 & 2032
- Figure 11: Middle East and Africa Food Allergen Testing Industry Revenue Share (%), by Country 2024 & 2032
- Figure 12: North America Food Allergen Testing Industry Revenue (Million), by Technology 2024 & 2032
- Figure 13: North America Food Allergen Testing Industry Revenue Share (%), by Technology 2024 & 2032
- Figure 14: North America Food Allergen Testing Industry Revenue (Million), by Application 2024 & 2032
- Figure 15: North America Food Allergen Testing Industry Revenue Share (%), by Application 2024 & 2032
- Figure 16: North America Food Allergen Testing Industry Revenue (Million), by Country 2024 & 2032
- Figure 17: North America Food Allergen Testing Industry Revenue Share (%), by Country 2024 & 2032
- Figure 18: Europe Food Allergen Testing Industry Revenue (Million), by Technology 2024 & 2032
- Figure 19: Europe Food Allergen Testing Industry Revenue Share (%), by Technology 2024 & 2032
- Figure 20: Europe Food Allergen Testing Industry Revenue (Million), by Application 2024 & 2032
- Figure 21: Europe Food Allergen Testing Industry Revenue Share (%), by Application 2024 & 2032
- Figure 22: Europe Food Allergen Testing Industry Revenue (Million), by Country 2024 & 2032
- Figure 23: Europe Food Allergen Testing Industry Revenue Share (%), by Country 2024 & 2032
- Figure 24: Asia Pacific Food Allergen Testing Industry Revenue (Million), by Technology 2024 & 2032
- Figure 25: Asia Pacific Food Allergen Testing Industry Revenue Share (%), by Technology 2024 & 2032
- Figure 26: Asia Pacific Food Allergen Testing Industry Revenue (Million), by Application 2024 & 2032
- Figure 27: Asia Pacific Food Allergen Testing Industry Revenue Share (%), by Application 2024 & 2032
- Figure 28: Asia Pacific Food Allergen Testing Industry Revenue (Million), by Country 2024 & 2032
- Figure 29: Asia Pacific Food Allergen Testing Industry Revenue Share (%), by Country 2024 & 2032
- Figure 30: South America Food Allergen Testing Industry Revenue (Million), by Technology 2024 & 2032
- Figure 31: South America Food Allergen Testing Industry Revenue Share (%), by Technology 2024 & 2032
- Figure 32: South America Food Allergen Testing Industry Revenue (Million), by Application 2024 & 2032
- Figure 33: South America Food Allergen Testing Industry Revenue Share (%), by Application 2024 & 2032
- Figure 34: South America Food Allergen Testing Industry Revenue (Million), by Country 2024 & 2032
- Figure 35: South America Food Allergen Testing Industry Revenue Share (%), by Country 2024 & 2032
- Figure 36: Middle East and Africa Food Allergen Testing Industry Revenue (Million), by Technology 2024 & 2032
- Figure 37: Middle East and Africa Food Allergen Testing Industry Revenue Share (%), by Technology 2024 & 2032
- Figure 38: Middle East and Africa Food Allergen Testing Industry Revenue (Million), by Application 2024 & 2032
- Figure 39: Middle East and Africa Food Allergen Testing Industry Revenue Share (%), by Application 2024 & 2032
- Figure 40: Middle East and Africa Food Allergen Testing Industry Revenue (Million), by Country 2024 & 2032
- Figure 41: Middle East and Africa Food Allergen Testing Industry Revenue Share (%), by Country 2024 & 2032
List of Tables
- Table 1: Global Food Allergen Testing Industry Revenue Million Forecast, by Region 2019 & 2032
- Table 2: Global Food Allergen Testing Industry Revenue Million Forecast, by Technology 2019 & 2032
- Table 3: Global Food Allergen Testing Industry Revenue Million Forecast, by Application 2019 & 2032
- Table 4: Global Food Allergen Testing Industry Revenue Million Forecast, by Region 2019 & 2032
- Table 5: Global Food Allergen Testing Industry Revenue Million Forecast, by Country 2019 & 2032
- Table 6: United States Food Allergen Testing Industry Revenue (Million) Forecast, by Application 2019 & 2032
- Table 7: Canada Food Allergen Testing Industry Revenue (Million) Forecast, by Application 2019 & 2032
- Table 8: Mexico Food Allergen Testing Industry Revenue (Million) Forecast, by Application 2019 & 2032
- Table 9: Rest of North America Food Allergen Testing Industry Revenue (Million) Forecast, by Application 2019 & 2032
- Table 10: Global Food Allergen Testing Industry Revenue Million Forecast, by Country 2019 & 2032
- Table 11: Germany Food Allergen Testing Industry Revenue (Million) Forecast, by Application 2019 & 2032
- Table 12: United Kingdom Food Allergen Testing Industry Revenue (Million) Forecast, by Application 2019 & 2032
- Table 13: France Food Allergen Testing Industry Revenue (Million) Forecast, by Application 2019 & 2032
- Table 14: Russia Food Allergen Testing Industry Revenue (Million) Forecast, by Application 2019 & 2032
- Table 15: Spain Food Allergen Testing Industry Revenue (Million) Forecast, by Application 2019 & 2032
- Table 16: Italy Food Allergen Testing Industry Revenue (Million) Forecast, by Application 2019 & 2032
- Table 17: Rest of Europe Food Allergen Testing Industry Revenue (Million) Forecast, by Application 2019 & 2032
- Table 18: Global Food Allergen Testing Industry Revenue Million Forecast, by Country 2019 & 2032
- Table 19: India Food Allergen Testing Industry Revenue (Million) Forecast, by Application 2019 & 2032
- Table 20: China Food Allergen Testing Industry Revenue (Million) Forecast, by Application 2019 & 2032
- Table 21: Japan Food Allergen Testing Industry Revenue (Million) Forecast, by Application 2019 & 2032
- Table 22: Australia Food Allergen Testing Industry Revenue (Million) Forecast, by Application 2019 & 2032
- Table 23: Rest of Asia Pacific Food Allergen Testing Industry Revenue (Million) Forecast, by Application 2019 & 2032
- Table 24: Global Food Allergen Testing Industry Revenue Million Forecast, by Country 2019 & 2032
- Table 25: Brazil Food Allergen Testing Industry Revenue (Million) Forecast, by Application 2019 & 2032
- Table 26: Argentina Food Allergen Testing Industry Revenue (Million) Forecast, by Application 2019 & 2032
- Table 27: Rest of South America Food Allergen Testing Industry Revenue (Million) Forecast, by Application 2019 & 2032
- Table 28: Global Food Allergen Testing Industry Revenue Million Forecast, by Country 2019 & 2032
- Table 29: South Africa Food Allergen Testing Industry Revenue (Million) Forecast, by Application 2019 & 2032
- Table 30: Saudi Arabia Food Allergen Testing Industry Revenue (Million) Forecast, by Application 2019 & 2032
- Table 31: Rest of Middle East and Africa Food Allergen Testing Industry Revenue (Million) Forecast, by Application 2019 & 2032
- Table 32: Global Food Allergen Testing Industry Revenue Million Forecast, by Technology 2019 & 2032
- Table 33: Global Food Allergen Testing Industry Revenue Million Forecast, by Application 2019 & 2032
- Table 34: Global Food Allergen Testing Industry Revenue Million Forecast, by Country 2019 & 2032
- Table 35: United States Food Allergen Testing Industry Revenue (Million) Forecast, by Application 2019 & 2032
- Table 36: Canada Food Allergen Testing Industry Revenue (Million) Forecast, by Application 2019 & 2032
- Table 37: Mexico Food Allergen Testing Industry Revenue (Million) Forecast, by Application 2019 & 2032
- Table 38: Rest of North America Food Allergen Testing Industry Revenue (Million) Forecast, by Application 2019 & 2032
- Table 39: Global Food Allergen Testing Industry Revenue Million Forecast, by Technology 2019 & 2032
- Table 40: Global Food Allergen Testing Industry Revenue Million Forecast, by Application 2019 & 2032
- Table 41: Global Food Allergen Testing Industry Revenue Million Forecast, by Country 2019 & 2032
- Table 42: Germany Food Allergen Testing Industry Revenue (Million) Forecast, by Application 2019 & 2032
- Table 43: United Kingdom Food Allergen Testing Industry Revenue (Million) Forecast, by Application 2019 & 2032
- Table 44: France Food Allergen Testing Industry Revenue (Million) Forecast, by Application 2019 & 2032
- Table 45: Russia Food Allergen Testing Industry Revenue (Million) Forecast, by Application 2019 & 2032
- Table 46: Spain Food Allergen Testing Industry Revenue (Million) Forecast, by Application 2019 & 2032
- Table 47: Italy Food Allergen Testing Industry Revenue (Million) Forecast, by Application 2019 & 2032
- Table 48: Rest of Europe Food Allergen Testing Industry Revenue (Million) Forecast, by Application 2019 & 2032
- Table 49: Global Food Allergen Testing Industry Revenue Million Forecast, by Technology 2019 & 2032
- Table 50: Global Food Allergen Testing Industry Revenue Million Forecast, by Application 2019 & 2032
- Table 51: Global Food Allergen Testing Industry Revenue Million Forecast, by Country 2019 & 2032
- Table 52: India Food Allergen Testing Industry Revenue (Million) Forecast, by Application 2019 & 2032
- Table 53: China Food Allergen Testing Industry Revenue (Million) Forecast, by Application 2019 & 2032
- Table 54: Japan Food Allergen Testing Industry Revenue (Million) Forecast, by Application 2019 & 2032
- Table 55: Australia Food Allergen Testing Industry Revenue (Million) Forecast, by Application 2019 & 2032
- Table 56: Rest of Asia Pacific Food Allergen Testing Industry Revenue (Million) Forecast, by Application 2019 & 2032
- Table 57: Global Food Allergen Testing Industry Revenue Million Forecast, by Technology 2019 & 2032
- Table 58: Global Food Allergen Testing Industry Revenue Million Forecast, by Application 2019 & 2032
- Table 59: Global Food Allergen Testing Industry Revenue Million Forecast, by Country 2019 & 2032
- Table 60: Brazil Food Allergen Testing Industry Revenue (Million) Forecast, by Application 2019 & 2032
- Table 61: Argentina Food Allergen Testing Industry Revenue (Million) Forecast, by Application 2019 & 2032
- Table 62: Rest of South America Food Allergen Testing Industry Revenue (Million) Forecast, by Application 2019 & 2032
- Table 63: Global Food Allergen Testing Industry Revenue Million Forecast, by Technology 2019 & 2032
- Table 64: Global Food Allergen Testing Industry Revenue Million Forecast, by Application 2019 & 2032
- Table 65: Global Food Allergen Testing Industry Revenue Million Forecast, by Country 2019 & 2032
- Table 66: South Africa Food Allergen Testing Industry Revenue (Million) Forecast, by Application 2019 & 2032
- Table 67: Saudi Arabia Food Allergen Testing Industry Revenue (Million) Forecast, by Application 2019 & 2032
- Table 68: Rest of Middle East and Africa Food Allergen Testing Industry Revenue (Million) Forecast, by Application 2019 & 2032
Frequently Asked Questions
1. What is the projected Compound Annual Growth Rate (CAGR) of the Food Allergen Testing Industry?
The projected CAGR is approximately 7.42%.
2. Which companies are prominent players in the Food Allergen Testing Industry?
Key companies in the market include Intertek Group PLC, Mérieux NutriSciences, Bureau Veritas S A, SGS SA, Crystal Chem Inc , Lifeasible, ALS Limited, Microbac Laboratories Inc, Eurofins Scientific SE, Neogen Corporation.
3. What are the main segments of the Food Allergen Testing Industry?
The market segments include Technology, Application .
4. Can you provide details about the market size?
The market size is estimated to be USD 0.89 Million as of 2022.
5. What are some drivers contributing to market growth?
Increasing Incidences of Food Allergies; Favorable Government Initiatives and Regulations for Food Safety.
6. What are the notable trends driving market growth?
Increasing Prevalence of Food Allergies.
7. Are there any restraints impacting market growth?
Inconsistencies Involved in Food Allergen Declarations.
8. Can you provide examples of recent developments in the market?
March 2024: Gold Standard Diagnostics launched the first product of the new allergen PowerLine tests: the SENSIStrip Gluten PowerLine Lateral Flow Device. The product comprises a sensitive detection system based on a monoclonal antibody and can detect gluten residues in food matrices, rinse water, and swabs.
9. What pricing options are available for accessing the report?
Pricing options include single-user, multi-user, and enterprise licenses priced at USD 4750, USD 5250, and USD 8750 respectively.
10. Is the market size provided in terms of value or volume?
The market size is provided in terms of value, measured in Million.
11. Are there any specific market keywords associated with the report?
Yes, the market keyword associated with the report is "Food Allergen Testing Industry," which aids in identifying and referencing the specific market segment covered.
12. How do I determine which pricing option suits my needs best?
The pricing options vary based on user requirements and access needs. Individual users may opt for single-user licenses, while businesses requiring broader access may choose multi-user or enterprise licenses for cost-effective access to the report.
13. Are there any additional resources or data provided in the Food Allergen Testing Industry report?
While the report offers comprehensive insights, it's advisable to review the specific contents or supplementary materials provided to ascertain if additional resources or data are available.
14. How can I stay updated on further developments or reports in the Food Allergen Testing Industry?
To stay informed about further developments, trends, and reports in the Food Allergen Testing Industry, consider subscribing to industry newsletters, following relevant companies and organizations, or regularly checking reputable industry news sources and publications.
Methodology
Step 1 - Identification of Relevant Samples Size from Population Database


Step 2 - Approaches for Defining Global Market Size (Value, Volume* & Price*)

Note*: In applicable scenarios
Step 3 - Data Sources
Primary Research
- Web Analytics
- Survey Reports
- Research Institute
- Latest Research Reports
- Opinion Leaders
Secondary Research
- Annual Reports
- White Paper
- Latest Press Release
- Industry Association
- Paid Database
- Investor Presentations

Step 4 - Data Triangulation
Involves using different sources of information in order to increase the validity of a study
These sources are likely to be stakeholders in a program - participants, other researchers, program staff, other community members, and so on.
Then we put all data in single framework & apply various statistical tools to find out the dynamic on the market.
During the analysis stage, feedback from the stakeholder groups would be compared to determine areas of agreement as well as areas of divergence
