

Key Insights
The Asia-Pacific (APAC) fermented drinks market presents a dynamic landscape with significant growth potential. Driven by rising health consciousness, increasing disposable incomes, and a growing preference for functional beverages, the market is experiencing robust expansion. The region's diverse culinary traditions and a burgeoning young population further fuel demand for a wide range of fermented products, from traditional kombucha and kefir to innovative functional drinks incorporating probiotics and other beneficial ingredients. While the alcoholic segment, encompassing sake, beer, and various regional specialties, contributes substantially, the non-alcoholic segment is witnessing faster growth due to health-focused consumer trends. This is particularly evident in the increasing popularity of plant-based fermented drinks and those marketed with explicit health benefits such as improved gut health and immunity boosting properties. Key distribution channels include both on-trade (restaurants, bars) and off-trade (supermarkets, online retailers), with the latter experiencing rapid growth due to e-commerce penetration. Competition is fierce, with both established multinational corporations and smaller, niche players vying for market share. Challenges include maintaining consistent product quality, addressing consumer perceptions around taste and price, and navigating the complexities of regional regulations and preferences across the diverse APAC market.
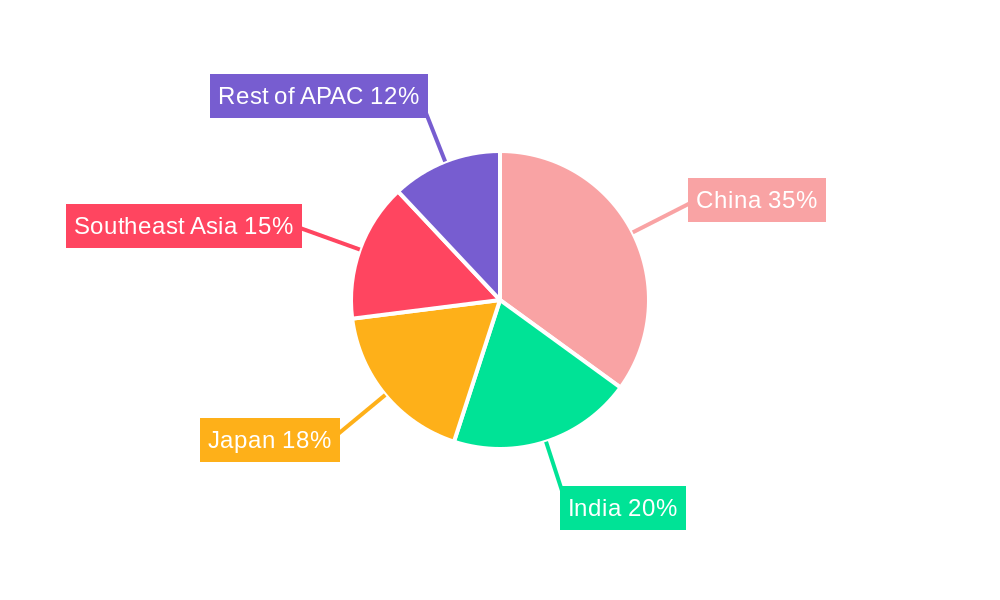
Growth within APAC is expected to outpace the global average, primarily driven by strong performance in countries like China, India, and Japan. China's expanding middle class and increasing urbanization are fueling demand for premium and convenience-oriented fermented drinks. India's traditional use of fermented foods and beverages provides a solid foundation for market growth, further boosted by increasing awareness of health benefits. Japan's established fermented beverage culture, combined with continuous innovation in product development, ensures its continued significance. Southeast Asia also shows promising growth potential due to a rising young population and increasing adoption of Westernized lifestyles and food trends. However, market penetration remains uneven across the region, with significant opportunities for expansion into less developed markets. Further growth will hinge on addressing consumer education about the health benefits of fermented drinks, introducing innovative product offerings tailored to local tastes, and optimizing distribution channels to reach broader consumer segments.
Fermented Drinks Industry in APAC: A Comprehensive Market Report (2019-2033)
This insightful report provides a comprehensive analysis of the Fermented Drinks market in the Asia-Pacific region, offering a detailed overview of market trends, growth drivers, challenges, and future opportunities. Covering the period from 2019 to 2033, with a base year of 2025 and a forecast period of 2025-2033, this report is essential for stakeholders seeking to understand and capitalize on the dynamic APAC fermented drinks landscape. The market size is projected to reach xx Million by 2033.
Fermented Drinks Industry in APAC Market Composition & Trends
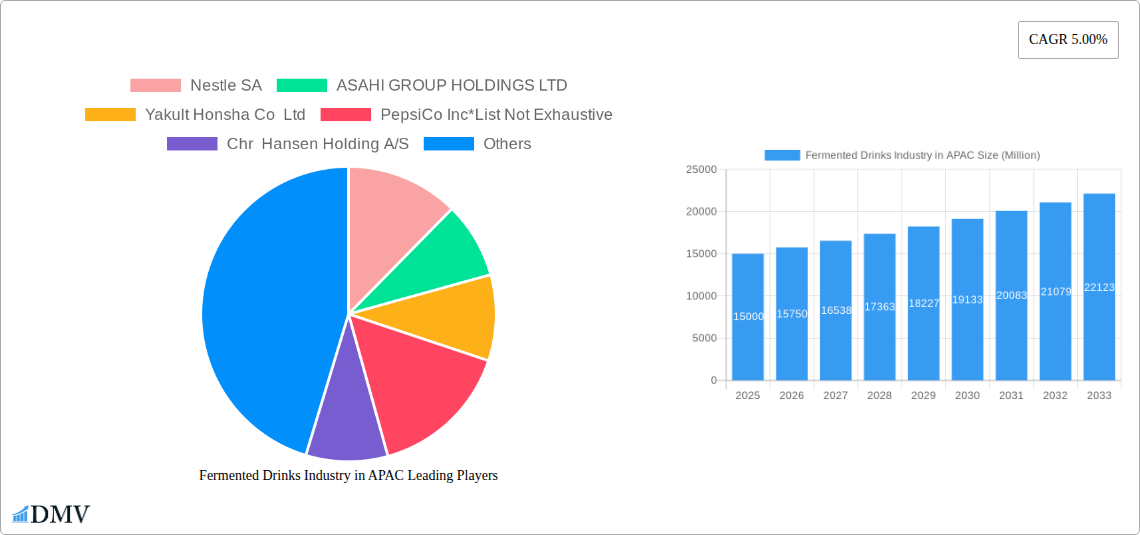
This section delves into the competitive dynamics of the APAC fermented drinks market, analyzing market concentration, innovation drivers, regulatory landscapes, substitute products, end-user profiles, and merger & acquisition (M&A) activities. We examine the market share distribution among key players such as Nestle SA, Asahi Group Holdings Ltd, Yakult Honsha Co Ltd, PepsiCo Inc, Chr. Hansen Holding A/S, Groupe Danone SA, Hakkaisan Brewery Co Ltd, Heineken NV, and GT's Living Foods (list not exhaustive). The report quantifies market concentration using metrics like the Herfindahl-Hirschman Index (HHI) and analyzes the impact of recent M&A deals, estimating their total value at xx Million. Innovation is explored through detailed analysis of new product launches, technological advancements, and their impact on market segmentation. Regulatory landscapes across different APAC countries are compared, highlighting variations in regulations governing alcoholic and non-alcoholic fermented drinks. Finally, the report profiles key end-user segments and their consumption patterns, shedding light on future market demand.
- Market Concentration: HHI of xx, indicating a [highly concentrated/moderately concentrated/fragmented] market.
- M&A Activity (2019-2024): Total deal value estimated at xx Million.
- Key Innovation Catalysts: Probiotic drinks, functional beverages, organic options, premiumization trends.
- Substitute Products: Soft drinks, juices, teas, energy drinks.
Fermented Drinks Industry in APAC Industry Evolution
This section charts the evolution of the APAC fermented drinks industry, examining market growth trajectories from 2019 to 2024 and forecasting growth until 2033. We analyze the impact of technological advancements, such as improved fermentation techniques and packaging innovations, on production efficiency and product quality. The evolving consumer preferences—a shift towards health-conscious, functional beverages with natural ingredients—are closely examined. Specific data points, including compound annual growth rates (CAGR) for various segments, adoption rates of new technologies, and changing consumer demographics, are provided to illustrate the industry's dynamic nature. The report further explores the influence of lifestyle changes, economic growth, and urbanization on the market's trajectory. The rising disposable incomes and health consciousness drive increased spending on premium and functional fermented beverages. Technological advancements are leading to innovative product development and production optimization. The changing consumer preference for health and wellness contributes significantly to the market growth.
Leading Regions, Countries, or Segments in Fermented Drinks Industry in APAC
This section identifies the dominant regions, countries, and segments within the APAC fermented drinks market. We analyze market leadership by type (alcoholic vs. non-alcoholic) and distribution channel (on-trade vs. off-trade). Key drivers for dominance in each segment are identified using detailed market share analysis and qualitative assessments. This involves analyzing investment trends, regulatory support, and consumer behavior variations across different regions. For instance, the dominance of a specific region might be attributed to strong government support for the industry, high per capita consumption, or favorable economic conditions.
- By Type: [Dominant segment: Alcoholic/Non-alcoholic beverages] – Key drivers: [List bullet points detailing investment, regulatory support, and consumer trends]
- By Distribution Channel: [Dominant segment: On-trade/Off-trade] – Key drivers: [List bullet points detailing investment, regulatory support, and consumer trends]
Fermented Drinks Industry in APAC Product Innovations
This section highlights recent product innovations in the APAC fermented drinks market, focusing on new product launches, improved formulations, and technological advancements that enhance product quality and appeal. We discuss unique selling propositions (USPs) of new products and their impact on market competition. The analysis includes performance metrics such as market share gains and consumer acceptance rates of innovative products. Examples of successful innovations, their features, and their market impact are provided.
Propelling Factors for Fermented Drinks Industry in APAC Growth
This section identifies and analyzes the key factors driving growth in the APAC fermented drinks market. These factors encompass technological advancements, favorable economic conditions, and supportive regulatory frameworks. Specific examples are provided, such as the impact of e-commerce on distribution channels or the influence of government initiatives promoting local production. The rising health awareness is a significant catalyst for the growth of the fermented drinks market in the APAC region.
Obstacles in the Fermented Drinks Industry in APAC Market
This section identifies and analyzes the challenges and restraints hindering the growth of the APAC fermented drinks market. These include regulatory hurdles, supply chain disruptions, and intense competition. Quantifiable impacts of these challenges on market growth are presented, emphasizing potential negative consequences for businesses.
Future Opportunities in Fermented Drinks Industry in APAC
This section explores emerging opportunities for growth in the APAC fermented drinks market. These opportunities encompass expanding into new markets, leveraging technological advancements, and capitalizing on evolving consumer trends. The focus is on identifying promising areas for future investment and expansion within the industry.
Major Players in the Fermented Drinks Industry in APAC Ecosystem
- Nestle SA
- ASAHI GROUP HOLDINGS LTD
- Yakult Honsha Co Ltd
- PepsiCo Inc
- Chr Hansen Holding A/S
- Groupe Danone SA
- HAKKAISAN BREWERY CO LTD
- Heineken NV
- GT'S LIVING FOODS
Key Developments in Fermented Drinks Industry in APAC Industry
- [Date]: [Company] launches a new line of [product type] fermented drinks.
- [Date]: [Company A] and [Company B] announce a strategic partnership to expand their reach in the APAC market.
- [Date]: New regulations regarding labeling and marketing of fermented drinks are introduced in [country].
Strategic Fermented Drinks Industry in APAC Market Forecast
This section summarizes the key growth catalysts and opportunities for the APAC fermented drinks market in the forecast period (2025-2033). It emphasizes the potential for market expansion and the expected trajectory of growth, considering the identified drivers, challenges, and opportunities. The focus is on providing a concise yet comprehensive outlook for the future of the industry.
Fermented Drinks Industry in APAC Segmentation
-
1. Type
- 1.1. Alcoholic Beverages
-
1.2. Non-Alcoholic Beverages
- 1.2.1. Kombucha
- 1.2.2. Kefir
- 1.2.3. Others
-
2. Distribution Channel
- 2.1. On-Trade
-
2.2. Off-Trade
- 2.2.1. Supermarket/Hypermarket
- 2.2.2. Convenience Store
- 2.2.3. Specialty Stores
- 2.2.4. Others
-
3. Geography
- 3.1. India
- 3.2. China
- 3.3. Japan
- 3.4. Australia
- 3.5. Rest of Asia Pacific
Fermented Drinks Industry in APAC Segmentation By Geography
- 1. India
- 2. China
- 3. Japan
- 4. Australia
- 5. Rest of Asia Pacific
Fermented Drinks Industry in APAC REPORT HIGHLIGHTS
| Aspects | Details |
|---|---|
| Study Period | 2019-2033 |
| Base Year | 2024 |
| Estimated Year | 2025 |
| Forecast Period | 2025-2033 |
| Historical Period | 2019-2024 |
| Growth Rate | CAGR of 5.00% from 2019-2033 |
| Segmentation |
|
Table of Contents
- 1. Introduction
- 1.1. Research Scope
- 1.2. Market Segmentation
- 1.3. Research Methodology
- 1.4. Definitions and Assumptions
- 2. Executive Summary
- 2.1. Introduction
- 3. Market Dynamics
- 3.1. Introduction
- 3.2. Market Drivers
- 3.2.1. Government Initiatives and E-commerce Penetration
- 3.3. Market Restrains
- 3.3.1. Detrimental Health Impact of Caffeine Intake
- 3.4. Market Trends
- 3.4.1. Increase in Demand for Functional Beverages
- 4. Market Factor Analysis
- 4.1. Porters Five Forces
- 4.2. Supply/Value Chain
- 4.3. PESTEL analysis
- 4.4. Market Entropy
- 4.5. Patent/Trademark Analysis
- 5. Global Fermented Drinks Industry in APAC Analysis, Insights and Forecast, 2019-2031
- 5.1. Market Analysis, Insights and Forecast - by Type
- 5.1.1. Alcoholic Beverages
- 5.1.2. Non-Alcoholic Beverages
- 5.1.2.1. Kombucha
- 5.1.2.2. Kefir
- 5.1.2.3. Others
- 5.2. Market Analysis, Insights and Forecast - by Distribution Channel
- 5.2.1. On-Trade
- 5.2.2. Off-Trade
- 5.2.2.1. Supermarket/Hypermarket
- 5.2.2.2. Convenience Store
- 5.2.2.3. Specialty Stores
- 5.2.2.4. Others
- 5.3. Market Analysis, Insights and Forecast - by Geography
- 5.3.1. India
- 5.3.2. China
- 5.3.3. Japan
- 5.3.4. Australia
- 5.3.5. Rest of Asia Pacific
- 5.4. Market Analysis, Insights and Forecast - by Region
- 5.4.1. India
- 5.4.2. China
- 5.4.3. Japan
- 5.4.4. Australia
- 5.4.5. Rest of Asia Pacific
- 5.1. Market Analysis, Insights and Forecast - by Type
- 6. India Fermented Drinks Industry in APAC Analysis, Insights and Forecast, 2019-2031
- 6.1. Market Analysis, Insights and Forecast - by Type
- 6.1.1. Alcoholic Beverages
- 6.1.2. Non-Alcoholic Beverages
- 6.1.2.1. Kombucha
- 6.1.2.2. Kefir
- 6.1.2.3. Others
- 6.2. Market Analysis, Insights and Forecast - by Distribution Channel
- 6.2.1. On-Trade
- 6.2.2. Off-Trade
- 6.2.2.1. Supermarket/Hypermarket
- 6.2.2.2. Convenience Store
- 6.2.2.3. Specialty Stores
- 6.2.2.4. Others
- 6.3. Market Analysis, Insights and Forecast - by Geography
- 6.3.1. India
- 6.3.2. China
- 6.3.3. Japan
- 6.3.4. Australia
- 6.3.5. Rest of Asia Pacific
- 6.1. Market Analysis, Insights and Forecast - by Type
- 7. China Fermented Drinks Industry in APAC Analysis, Insights and Forecast, 2019-2031
- 7.1. Market Analysis, Insights and Forecast - by Type
- 7.1.1. Alcoholic Beverages
- 7.1.2. Non-Alcoholic Beverages
- 7.1.2.1. Kombucha
- 7.1.2.2. Kefir
- 7.1.2.3. Others
- 7.2. Market Analysis, Insights and Forecast - by Distribution Channel
- 7.2.1. On-Trade
- 7.2.2. Off-Trade
- 7.2.2.1. Supermarket/Hypermarket
- 7.2.2.2. Convenience Store
- 7.2.2.3. Specialty Stores
- 7.2.2.4. Others
- 7.3. Market Analysis, Insights and Forecast - by Geography
- 7.3.1. India
- 7.3.2. China
- 7.3.3. Japan
- 7.3.4. Australia
- 7.3.5. Rest of Asia Pacific
- 7.1. Market Analysis, Insights and Forecast - by Type
- 8. Japan Fermented Drinks Industry in APAC Analysis, Insights and Forecast, 2019-2031
- 8.1. Market Analysis, Insights and Forecast - by Type
- 8.1.1. Alcoholic Beverages
- 8.1.2. Non-Alcoholic Beverages
- 8.1.2.1. Kombucha
- 8.1.2.2. Kefir
- 8.1.2.3. Others
- 8.2. Market Analysis, Insights and Forecast - by Distribution Channel
- 8.2.1. On-Trade
- 8.2.2. Off-Trade
- 8.2.2.1. Supermarket/Hypermarket
- 8.2.2.2. Convenience Store
- 8.2.2.3. Specialty Stores
- 8.2.2.4. Others
- 8.3. Market Analysis, Insights and Forecast - by Geography
- 8.3.1. India
- 8.3.2. China
- 8.3.3. Japan
- 8.3.4. Australia
- 8.3.5. Rest of Asia Pacific
- 8.1. Market Analysis, Insights and Forecast - by Type
- 9. Australia Fermented Drinks Industry in APAC Analysis, Insights and Forecast, 2019-2031
- 9.1. Market Analysis, Insights and Forecast - by Type
- 9.1.1. Alcoholic Beverages
- 9.1.2. Non-Alcoholic Beverages
- 9.1.2.1. Kombucha
- 9.1.2.2. Kefir
- 9.1.2.3. Others
- 9.2. Market Analysis, Insights and Forecast - by Distribution Channel
- 9.2.1. On-Trade
- 9.2.2. Off-Trade
- 9.2.2.1. Supermarket/Hypermarket
- 9.2.2.2. Convenience Store
- 9.2.2.3. Specialty Stores
- 9.2.2.4. Others
- 9.3. Market Analysis, Insights and Forecast - by Geography
- 9.3.1. India
- 9.3.2. China
- 9.3.3. Japan
- 9.3.4. Australia
- 9.3.5. Rest of Asia Pacific
- 9.1. Market Analysis, Insights and Forecast - by Type
- 10. Rest of Asia Pacific Fermented Drinks Industry in APAC Analysis, Insights and Forecast, 2019-2031
- 10.1. Market Analysis, Insights and Forecast - by Type
- 10.1.1. Alcoholic Beverages
- 10.1.2. Non-Alcoholic Beverages
- 10.1.2.1. Kombucha
- 10.1.2.2. Kefir
- 10.1.2.3. Others
- 10.2. Market Analysis, Insights and Forecast - by Distribution Channel
- 10.2.1. On-Trade
- 10.2.2. Off-Trade
- 10.2.2.1. Supermarket/Hypermarket
- 10.2.2.2. Convenience Store
- 10.2.2.3. Specialty Stores
- 10.2.2.4. Others
- 10.3. Market Analysis, Insights and Forecast - by Geography
- 10.3.1. India
- 10.3.2. China
- 10.3.3. Japan
- 10.3.4. Australia
- 10.3.5. Rest of Asia Pacific
- 10.1. Market Analysis, Insights and Forecast - by Type
- 11. North America Fermented Drinks Industry in APAC Analysis, Insights and Forecast, 2019-2031
- 11.1. Market Analysis, Insights and Forecast - By Country/Sub-region
- 11.1.1 United States
- 11.1.2 Canada
- 11.1.3 Mexico
- 12. Europe Fermented Drinks Industry in APAC Analysis, Insights and Forecast, 2019-2031
- 12.1. Market Analysis, Insights and Forecast - By Country/Sub-region
- 12.1.1 Germany
- 12.1.2 United Kingdom
- 12.1.3 France
- 12.1.4 Spain
- 12.1.5 Italy
- 12.1.6 Spain
- 12.1.7 Belgium
- 12.1.8 Netherland
- 12.1.9 Nordics
- 12.1.10 Rest of Europe
- 13. Asia Pacific Fermented Drinks Industry in APAC Analysis, Insights and Forecast, 2019-2031
- 13.1. Market Analysis, Insights and Forecast - By Country/Sub-region
- 13.1.1 China
- 13.1.2 Japan
- 13.1.3 India
- 13.1.4 South Korea
- 13.1.5 Southeast Asia
- 13.1.6 Australia
- 13.1.7 Indonesia
- 13.1.8 Phillipes
- 13.1.9 Singapore
- 13.1.10 Thailandc
- 13.1.11 Rest of Asia Pacific
- 14. South America Fermented Drinks Industry in APAC Analysis, Insights and Forecast, 2019-2031
- 14.1. Market Analysis, Insights and Forecast - By Country/Sub-region
- 14.1.1 Brazil
- 14.1.2 Argentina
- 14.1.3 Peru
- 14.1.4 Chile
- 14.1.5 Colombia
- 14.1.6 Ecuador
- 14.1.7 Venezuela
- 14.1.8 Rest of South America
- 15. MEA Fermented Drinks Industry in APAC Analysis, Insights and Forecast, 2019-2031
- 15.1. Market Analysis, Insights and Forecast - By Country/Sub-region
- 15.1.1 United Arab Emirates
- 15.1.2 Saudi Arabia
- 15.1.3 South Africa
- 15.1.4 Rest of Middle East and Africa
- 16. Competitive Analysis
- 16.1. Global Market Share Analysis 2024
- 16.2. Company Profiles
- 16.2.1 Nestle SA
- 16.2.1.1. Overview
- 16.2.1.2. Products
- 16.2.1.3. SWOT Analysis
- 16.2.1.4. Recent Developments
- 16.2.1.5. Financials (Based on Availability)
- 16.2.2 ASAHI GROUP HOLDINGS LTD
- 16.2.2.1. Overview
- 16.2.2.2. Products
- 16.2.2.3. SWOT Analysis
- 16.2.2.4. Recent Developments
- 16.2.2.5. Financials (Based on Availability)
- 16.2.3 Yakult Honsha Co Ltd
- 16.2.3.1. Overview
- 16.2.3.2. Products
- 16.2.3.3. SWOT Analysis
- 16.2.3.4. Recent Developments
- 16.2.3.5. Financials (Based on Availability)
- 16.2.4 PepsiCo Inc*List Not Exhaustive
- 16.2.4.1. Overview
- 16.2.4.2. Products
- 16.2.4.3. SWOT Analysis
- 16.2.4.4. Recent Developments
- 16.2.4.5. Financials (Based on Availability)
- 16.2.5 Chr Hansen Holding A/S
- 16.2.5.1. Overview
- 16.2.5.2. Products
- 16.2.5.3. SWOT Analysis
- 16.2.5.4. Recent Developments
- 16.2.5.5. Financials (Based on Availability)
- 16.2.6 Groupe Danone SA
- 16.2.6.1. Overview
- 16.2.6.2. Products
- 16.2.6.3. SWOT Analysis
- 16.2.6.4. Recent Developments
- 16.2.6.5. Financials (Based on Availability)
- 16.2.7 HAKKAISAN BREWERY CO LTD
- 16.2.7.1. Overview
- 16.2.7.2. Products
- 16.2.7.3. SWOT Analysis
- 16.2.7.4. Recent Developments
- 16.2.7.5. Financials (Based on Availability)
- 16.2.8 Heineken NV
- 16.2.8.1. Overview
- 16.2.8.2. Products
- 16.2.8.3. SWOT Analysis
- 16.2.8.4. Recent Developments
- 16.2.8.5. Financials (Based on Availability)
- 16.2.9 GT'S LIVING FOODS
- 16.2.9.1. Overview
- 16.2.9.2. Products
- 16.2.9.3. SWOT Analysis
- 16.2.9.4. Recent Developments
- 16.2.9.5. Financials (Based on Availability)
- 16.2.1 Nestle SA
List of Figures
- Figure 1: Global Fermented Drinks Industry in APAC Revenue Breakdown (Million, %) by Region 2024 & 2032
- Figure 2: North America Fermented Drinks Industry in APAC Revenue (Million), by Country 2024 & 2032
- Figure 3: North America Fermented Drinks Industry in APAC Revenue Share (%), by Country 2024 & 2032
- Figure 4: Europe Fermented Drinks Industry in APAC Revenue (Million), by Country 2024 & 2032
- Figure 5: Europe Fermented Drinks Industry in APAC Revenue Share (%), by Country 2024 & 2032
- Figure 6: Asia Pacific Fermented Drinks Industry in APAC Revenue (Million), by Country 2024 & 2032
- Figure 7: Asia Pacific Fermented Drinks Industry in APAC Revenue Share (%), by Country 2024 & 2032
- Figure 8: South America Fermented Drinks Industry in APAC Revenue (Million), by Country 2024 & 2032
- Figure 9: South America Fermented Drinks Industry in APAC Revenue Share (%), by Country 2024 & 2032
- Figure 10: MEA Fermented Drinks Industry in APAC Revenue (Million), by Country 2024 & 2032
- Figure 11: MEA Fermented Drinks Industry in APAC Revenue Share (%), by Country 2024 & 2032
- Figure 12: India Fermented Drinks Industry in APAC Revenue (Million), by Type 2024 & 2032
- Figure 13: India Fermented Drinks Industry in APAC Revenue Share (%), by Type 2024 & 2032
- Figure 14: India Fermented Drinks Industry in APAC Revenue (Million), by Distribution Channel 2024 & 2032
- Figure 15: India Fermented Drinks Industry in APAC Revenue Share (%), by Distribution Channel 2024 & 2032
- Figure 16: India Fermented Drinks Industry in APAC Revenue (Million), by Geography 2024 & 2032
- Figure 17: India Fermented Drinks Industry in APAC Revenue Share (%), by Geography 2024 & 2032
- Figure 18: India Fermented Drinks Industry in APAC Revenue (Million), by Country 2024 & 2032
- Figure 19: India Fermented Drinks Industry in APAC Revenue Share (%), by Country 2024 & 2032
- Figure 20: China Fermented Drinks Industry in APAC Revenue (Million), by Type 2024 & 2032
- Figure 21: China Fermented Drinks Industry in APAC Revenue Share (%), by Type 2024 & 2032
- Figure 22: China Fermented Drinks Industry in APAC Revenue (Million), by Distribution Channel 2024 & 2032
- Figure 23: China Fermented Drinks Industry in APAC Revenue Share (%), by Distribution Channel 2024 & 2032
- Figure 24: China Fermented Drinks Industry in APAC Revenue (Million), by Geography 2024 & 2032
- Figure 25: China Fermented Drinks Industry in APAC Revenue Share (%), by Geography 2024 & 2032
- Figure 26: China Fermented Drinks Industry in APAC Revenue (Million), by Country 2024 & 2032
- Figure 27: China Fermented Drinks Industry in APAC Revenue Share (%), by Country 2024 & 2032
- Figure 28: Japan Fermented Drinks Industry in APAC Revenue (Million), by Type 2024 & 2032
- Figure 29: Japan Fermented Drinks Industry in APAC Revenue Share (%), by Type 2024 & 2032
- Figure 30: Japan Fermented Drinks Industry in APAC Revenue (Million), by Distribution Channel 2024 & 2032
- Figure 31: Japan Fermented Drinks Industry in APAC Revenue Share (%), by Distribution Channel 2024 & 2032
- Figure 32: Japan Fermented Drinks Industry in APAC Revenue (Million), by Geography 2024 & 2032
- Figure 33: Japan Fermented Drinks Industry in APAC Revenue Share (%), by Geography 2024 & 2032
- Figure 34: Japan Fermented Drinks Industry in APAC Revenue (Million), by Country 2024 & 2032
- Figure 35: Japan Fermented Drinks Industry in APAC Revenue Share (%), by Country 2024 & 2032
- Figure 36: Australia Fermented Drinks Industry in APAC Revenue (Million), by Type 2024 & 2032
- Figure 37: Australia Fermented Drinks Industry in APAC Revenue Share (%), by Type 2024 & 2032
- Figure 38: Australia Fermented Drinks Industry in APAC Revenue (Million), by Distribution Channel 2024 & 2032
- Figure 39: Australia Fermented Drinks Industry in APAC Revenue Share (%), by Distribution Channel 2024 & 2032
- Figure 40: Australia Fermented Drinks Industry in APAC Revenue (Million), by Geography 2024 & 2032
- Figure 41: Australia Fermented Drinks Industry in APAC Revenue Share (%), by Geography 2024 & 2032
- Figure 42: Australia Fermented Drinks Industry in APAC Revenue (Million), by Country 2024 & 2032
- Figure 43: Australia Fermented Drinks Industry in APAC Revenue Share (%), by Country 2024 & 2032
- Figure 44: Rest of Asia Pacific Fermented Drinks Industry in APAC Revenue (Million), by Type 2024 & 2032
- Figure 45: Rest of Asia Pacific Fermented Drinks Industry in APAC Revenue Share (%), by Type 2024 & 2032
- Figure 46: Rest of Asia Pacific Fermented Drinks Industry in APAC Revenue (Million), by Distribution Channel 2024 & 2032
- Figure 47: Rest of Asia Pacific Fermented Drinks Industry in APAC Revenue Share (%), by Distribution Channel 2024 & 2032
- Figure 48: Rest of Asia Pacific Fermented Drinks Industry in APAC Revenue (Million), by Geography 2024 & 2032
- Figure 49: Rest of Asia Pacific Fermented Drinks Industry in APAC Revenue Share (%), by Geography 2024 & 2032
- Figure 50: Rest of Asia Pacific Fermented Drinks Industry in APAC Revenue (Million), by Country 2024 & 2032
- Figure 51: Rest of Asia Pacific Fermented Drinks Industry in APAC Revenue Share (%), by Country 2024 & 2032
List of Tables
- Table 1: Global Fermented Drinks Industry in APAC Revenue Million Forecast, by Region 2019 & 2032
- Table 2: Global Fermented Drinks Industry in APAC Revenue Million Forecast, by Type 2019 & 2032
- Table 3: Global Fermented Drinks Industry in APAC Revenue Million Forecast, by Distribution Channel 2019 & 2032
- Table 4: Global Fermented Drinks Industry in APAC Revenue Million Forecast, by Geography 2019 & 2032
- Table 5: Global Fermented Drinks Industry in APAC Revenue Million Forecast, by Region 2019 & 2032
- Table 6: Global Fermented Drinks Industry in APAC Revenue Million Forecast, by Country 2019 & 2032
- Table 7: United States Fermented Drinks Industry in APAC Revenue (Million) Forecast, by Application 2019 & 2032
- Table 8: Canada Fermented Drinks Industry in APAC Revenue (Million) Forecast, by Application 2019 & 2032
- Table 9: Mexico Fermented Drinks Industry in APAC Revenue (Million) Forecast, by Application 2019 & 2032
- Table 10: Global Fermented Drinks Industry in APAC Revenue Million Forecast, by Country 2019 & 2032
- Table 11: Germany Fermented Drinks Industry in APAC Revenue (Million) Forecast, by Application 2019 & 2032
- Table 12: United Kingdom Fermented Drinks Industry in APAC Revenue (Million) Forecast, by Application 2019 & 2032
- Table 13: France Fermented Drinks Industry in APAC Revenue (Million) Forecast, by Application 2019 & 2032
- Table 14: Spain Fermented Drinks Industry in APAC Revenue (Million) Forecast, by Application 2019 & 2032
- Table 15: Italy Fermented Drinks Industry in APAC Revenue (Million) Forecast, by Application 2019 & 2032
- Table 16: Spain Fermented Drinks Industry in APAC Revenue (Million) Forecast, by Application 2019 & 2032
- Table 17: Belgium Fermented Drinks Industry in APAC Revenue (Million) Forecast, by Application 2019 & 2032
- Table 18: Netherland Fermented Drinks Industry in APAC Revenue (Million) Forecast, by Application 2019 & 2032
- Table 19: Nordics Fermented Drinks Industry in APAC Revenue (Million) Forecast, by Application 2019 & 2032
- Table 20: Rest of Europe Fermented Drinks Industry in APAC Revenue (Million) Forecast, by Application 2019 & 2032
- Table 21: Global Fermented Drinks Industry in APAC Revenue Million Forecast, by Country 2019 & 2032
- Table 22: China Fermented Drinks Industry in APAC Revenue (Million) Forecast, by Application 2019 & 2032
- Table 23: Japan Fermented Drinks Industry in APAC Revenue (Million) Forecast, by Application 2019 & 2032
- Table 24: India Fermented Drinks Industry in APAC Revenue (Million) Forecast, by Application 2019 & 2032
- Table 25: South Korea Fermented Drinks Industry in APAC Revenue (Million) Forecast, by Application 2019 & 2032
- Table 26: Southeast Asia Fermented Drinks Industry in APAC Revenue (Million) Forecast, by Application 2019 & 2032
- Table 27: Australia Fermented Drinks Industry in APAC Revenue (Million) Forecast, by Application 2019 & 2032
- Table 28: Indonesia Fermented Drinks Industry in APAC Revenue (Million) Forecast, by Application 2019 & 2032
- Table 29: Phillipes Fermented Drinks Industry in APAC Revenue (Million) Forecast, by Application 2019 & 2032
- Table 30: Singapore Fermented Drinks Industry in APAC Revenue (Million) Forecast, by Application 2019 & 2032
- Table 31: Thailandc Fermented Drinks Industry in APAC Revenue (Million) Forecast, by Application 2019 & 2032
- Table 32: Rest of Asia Pacific Fermented Drinks Industry in APAC Revenue (Million) Forecast, by Application 2019 & 2032
- Table 33: Global Fermented Drinks Industry in APAC Revenue Million Forecast, by Country 2019 & 2032
- Table 34: Brazil Fermented Drinks Industry in APAC Revenue (Million) Forecast, by Application 2019 & 2032
- Table 35: Argentina Fermented Drinks Industry in APAC Revenue (Million) Forecast, by Application 2019 & 2032
- Table 36: Peru Fermented Drinks Industry in APAC Revenue (Million) Forecast, by Application 2019 & 2032
- Table 37: Chile Fermented Drinks Industry in APAC Revenue (Million) Forecast, by Application 2019 & 2032
- Table 38: Colombia Fermented Drinks Industry in APAC Revenue (Million) Forecast, by Application 2019 & 2032
- Table 39: Ecuador Fermented Drinks Industry in APAC Revenue (Million) Forecast, by Application 2019 & 2032
- Table 40: Venezuela Fermented Drinks Industry in APAC Revenue (Million) Forecast, by Application 2019 & 2032
- Table 41: Rest of South America Fermented Drinks Industry in APAC Revenue (Million) Forecast, by Application 2019 & 2032
- Table 42: Global Fermented Drinks Industry in APAC Revenue Million Forecast, by Country 2019 & 2032
- Table 43: United Arab Emirates Fermented Drinks Industry in APAC Revenue (Million) Forecast, by Application 2019 & 2032
- Table 44: Saudi Arabia Fermented Drinks Industry in APAC Revenue (Million) Forecast, by Application 2019 & 2032
- Table 45: South Africa Fermented Drinks Industry in APAC Revenue (Million) Forecast, by Application 2019 & 2032
- Table 46: Rest of Middle East and Africa Fermented Drinks Industry in APAC Revenue (Million) Forecast, by Application 2019 & 2032
- Table 47: Global Fermented Drinks Industry in APAC Revenue Million Forecast, by Type 2019 & 2032
- Table 48: Global Fermented Drinks Industry in APAC Revenue Million Forecast, by Distribution Channel 2019 & 2032
- Table 49: Global Fermented Drinks Industry in APAC Revenue Million Forecast, by Geography 2019 & 2032
- Table 50: Global Fermented Drinks Industry in APAC Revenue Million Forecast, by Country 2019 & 2032
- Table 51: Global Fermented Drinks Industry in APAC Revenue Million Forecast, by Type 2019 & 2032
- Table 52: Global Fermented Drinks Industry in APAC Revenue Million Forecast, by Distribution Channel 2019 & 2032
- Table 53: Global Fermented Drinks Industry in APAC Revenue Million Forecast, by Geography 2019 & 2032
- Table 54: Global Fermented Drinks Industry in APAC Revenue Million Forecast, by Country 2019 & 2032
- Table 55: Global Fermented Drinks Industry in APAC Revenue Million Forecast, by Type 2019 & 2032
- Table 56: Global Fermented Drinks Industry in APAC Revenue Million Forecast, by Distribution Channel 2019 & 2032
- Table 57: Global Fermented Drinks Industry in APAC Revenue Million Forecast, by Geography 2019 & 2032
- Table 58: Global Fermented Drinks Industry in APAC Revenue Million Forecast, by Country 2019 & 2032
- Table 59: Global Fermented Drinks Industry in APAC Revenue Million Forecast, by Type 2019 & 2032
- Table 60: Global Fermented Drinks Industry in APAC Revenue Million Forecast, by Distribution Channel 2019 & 2032
- Table 61: Global Fermented Drinks Industry in APAC Revenue Million Forecast, by Geography 2019 & 2032
- Table 62: Global Fermented Drinks Industry in APAC Revenue Million Forecast, by Country 2019 & 2032
- Table 63: Global Fermented Drinks Industry in APAC Revenue Million Forecast, by Type 2019 & 2032
- Table 64: Global Fermented Drinks Industry in APAC Revenue Million Forecast, by Distribution Channel 2019 & 2032
- Table 65: Global Fermented Drinks Industry in APAC Revenue Million Forecast, by Geography 2019 & 2032
- Table 66: Global Fermented Drinks Industry in APAC Revenue Million Forecast, by Country 2019 & 2032
Frequently Asked Questions
1. What is the projected Compound Annual Growth Rate (CAGR) of the Fermented Drinks Industry in APAC?
The projected CAGR is approximately 5.00%.
2. Which companies are prominent players in the Fermented Drinks Industry in APAC?
Key companies in the market include Nestle SA, ASAHI GROUP HOLDINGS LTD, Yakult Honsha Co Ltd, PepsiCo Inc*List Not Exhaustive, Chr Hansen Holding A/S, Groupe Danone SA, HAKKAISAN BREWERY CO LTD, Heineken NV, GT'S LIVING FOODS.
3. What are the main segments of the Fermented Drinks Industry in APAC?
The market segments include Type, Distribution Channel, Geography.
4. Can you provide details about the market size?
The market size is estimated to be USD XX Million as of 2022.
5. What are some drivers contributing to market growth?
Government Initiatives and E-commerce Penetration.
6. What are the notable trends driving market growth?
Increase in Demand for Functional Beverages.
7. Are there any restraints impacting market growth?
Detrimental Health Impact of Caffeine Intake.
8. Can you provide examples of recent developments in the market?
N/A
9. What pricing options are available for accessing the report?
Pricing options include single-user, multi-user, and enterprise licenses priced at USD 4750, USD 5250, and USD 8750 respectively.
10. Is the market size provided in terms of value or volume?
The market size is provided in terms of value, measured in Million.
11. Are there any specific market keywords associated with the report?
Yes, the market keyword associated with the report is "Fermented Drinks Industry in APAC," which aids in identifying and referencing the specific market segment covered.
12. How do I determine which pricing option suits my needs best?
The pricing options vary based on user requirements and access needs. Individual users may opt for single-user licenses, while businesses requiring broader access may choose multi-user or enterprise licenses for cost-effective access to the report.
13. Are there any additional resources or data provided in the Fermented Drinks Industry in APAC report?
While the report offers comprehensive insights, it's advisable to review the specific contents or supplementary materials provided to ascertain if additional resources or data are available.
14. How can I stay updated on further developments or reports in the Fermented Drinks Industry in APAC?
To stay informed about further developments, trends, and reports in the Fermented Drinks Industry in APAC, consider subscribing to industry newsletters, following relevant companies and organizations, or regularly checking reputable industry news sources and publications.
Methodology
Step 1 - Identification of Relevant Samples Size from Population Database


Step 2 - Approaches for Defining Global Market Size (Value, Volume* & Price*)

Note*: In applicable scenarios
Step 3 - Data Sources
Primary Research
- Web Analytics
- Survey Reports
- Research Institute
- Latest Research Reports
- Opinion Leaders
Secondary Research
- Annual Reports
- White Paper
- Latest Press Release
- Industry Association
- Paid Database
- Investor Presentations

Step 4 - Data Triangulation
Involves using different sources of information in order to increase the validity of a study
These sources are likely to be stakeholders in a program - participants, other researchers, program staff, other community members, and so on.
Then we put all data in single framework & apply various statistical tools to find out the dynamic on the market.
During the analysis stage, feedback from the stakeholder groups would be compared to determine areas of agreement as well as areas of divergence
