

Key Insights
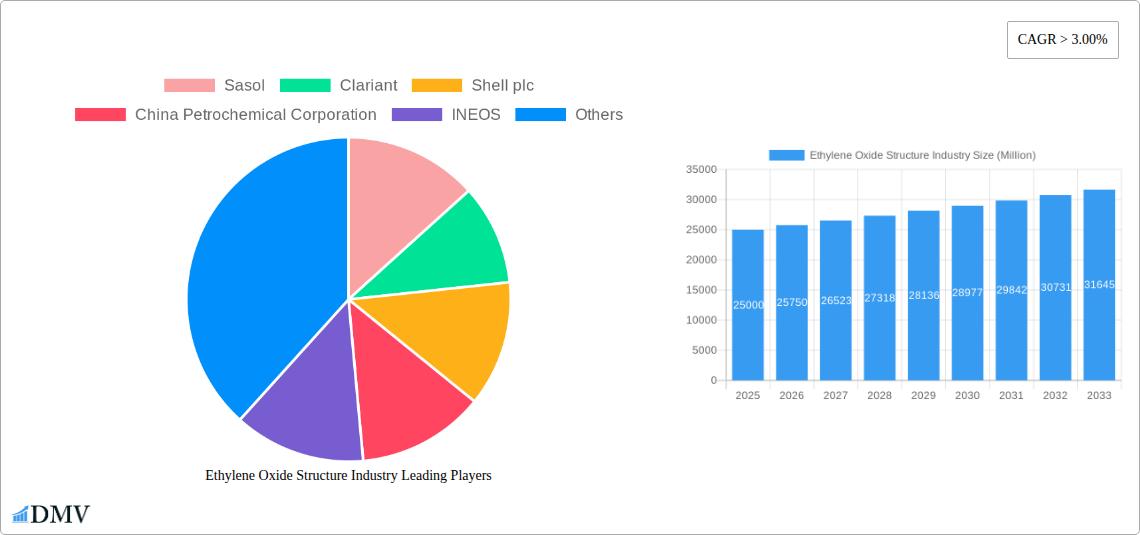
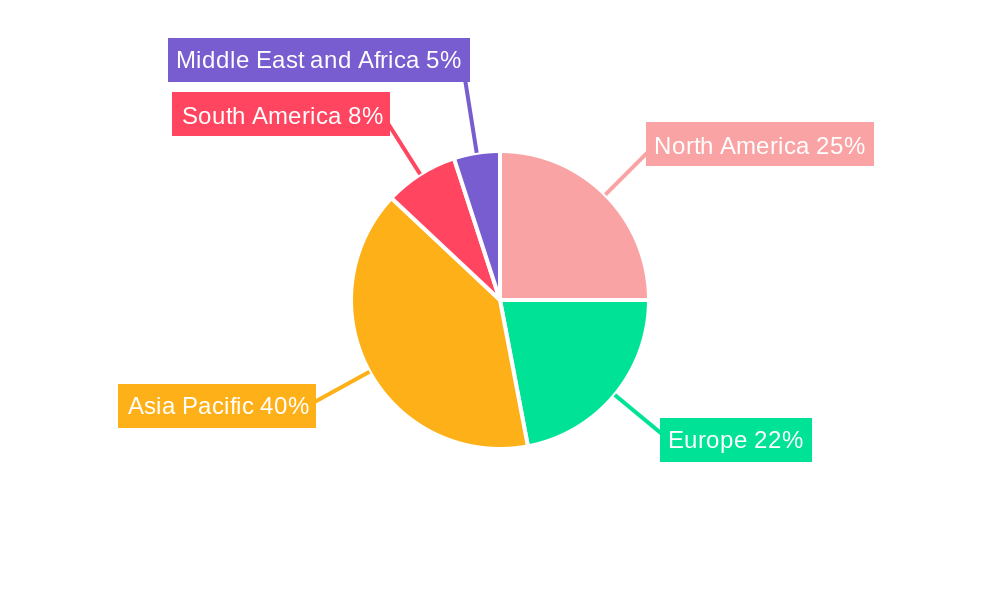
The Ethylene Oxide (EO) market, valued at approximately $XX million in 2025, is projected to experience robust growth with a Compound Annual Growth Rate (CAGR) exceeding 3% from 2025 to 2033. This expansion is driven by increasing demand across diverse end-use industries. The automotive sector's reliance on EO-derived products for antifreeze and lubricants fuels significant market growth. Similarly, the burgeoning agrochemicals industry leverages EO for the production of effective pesticides and herbicides, contributing to market expansion. The food and beverage industry utilizes EO derivatives as emulsifiers and solvents, further bolstering demand. Growth is also spurred by rising personal care product consumption and the expansion of the pharmaceutical sector, both of which utilize EO-derived components. However, stringent environmental regulations concerning EO production and handling pose a significant restraint, impacting overall market growth. The market is segmented by derivative type, with ethylene glycols, ethoxylates, ethanolamines, glycol ethers, and polyethylene glycols dominating the landscape. Geographical analysis reveals strong market presence across the Asia-Pacific region, fueled by industrialization and economic growth in countries like China and India, followed by North America and Europe. Key players such as Sasol, Clariant, Shell plc, and BASF SE are driving innovation and shaping market competition through strategic expansions and technological advancements. The forecast period will likely see increased focus on sustainable production methods and the development of novel EO-derived products to address evolving market needs and environmental concerns.
The continued expansion of the EO market is anticipated to be influenced by several factors. Technological advancements in EO production aim to improve efficiency and reduce environmental impact, potentially mitigating the constraints imposed by stricter regulations. Furthermore, the increasing demand for advanced materials in various sectors, such as electronics and renewable energy, could create new avenues for EO applications, driving future growth. However, fluctuations in raw material prices and potential geopolitical instability within key producing regions could pose challenges to market stability. Companies are actively investing in research and development to create more sustainable and cost-effective EO production processes, and strategic partnerships and mergers & acquisitions are expected to further shape the competitive landscape throughout the forecast period. Overall, the market's trajectory remains positive, driven by a multifaceted interplay of industrial demand, technological innovation, and evolving regulatory environments.
Ethylene Oxide Structure Industry: A Comprehensive Market Report (2019-2033)
This insightful report provides a comprehensive analysis of the Ethylene Oxide Structure industry, offering a detailed examination of market dynamics, leading players, and future growth prospects. Spanning the period from 2019 to 2033, with a base year of 2025 and a forecast period of 2025-2033, this report is an essential resource for stakeholders seeking to understand and capitalize on opportunities within this dynamic sector. The global market size in 2025 is estimated at xx Million.
Ethylene Oxide Structure Industry Market Composition & Trends
This section delves into the intricate structure of the Ethylene Oxide market, analyzing its concentration, innovation drivers, regulatory environment, substitute products, end-user profiles, and mergers and acquisitions (M&A) activity. The report provides a granular view of market share distribution among key players like Sasol, Clariant, Shell plc, China Petrochemical Corporation, INEOS, Reliance Industries Limited, BASF SE, LyondellBasell Industries Holdings B.V., India Glycols Limited, SABIC, Dow, NIPPON SHOKUBAI CO LTD, and LOTTE Chemical Corporation.
- Market Concentration: The report quantifies the market share held by the top five players, revealing the level of competition and potential for consolidation. The Herfindahl-Hirschman Index (HHI) will be calculated to measure market concentration.
- Innovation Catalysts: Analysis of key technological advancements driving innovation within the industry, focusing on production efficiency and new derivative applications.
- Regulatory Landscape: A detailed assessment of the regulatory frameworks impacting Ethylene Oxide production and usage across key regions, including emission standards and safety regulations.
- Substitute Products: Evaluation of existing and emerging substitutes for Ethylene Oxide and their potential impact on market share.
- End-User Profiles: A detailed segmentation of end-user industries, including Automotive, Agrochemicals, Food and Beverage, Textile, Personal Care, Pharmaceuticals, Detergents, and Other End-user Industries, with analysis of consumption patterns and growth drivers within each sector.
- M&A Activities: Comprehensive review of significant M&A activities within the Ethylene Oxide industry during the study period (2019-2024), including deal values and strategic implications. For example, the report will analyze the impact of deals exceeding xx Million.
Ethylene Oxide Structure Industry Industry Evolution
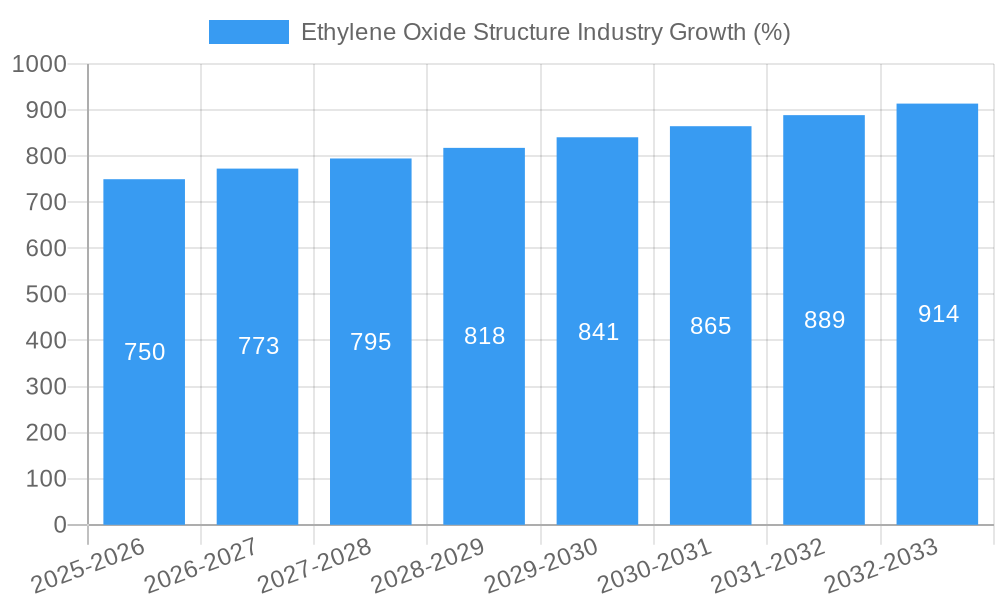
This section traces the evolution of the Ethylene Oxide industry, analyzing market growth trajectories, technological advancements, and the shifting demands of consumers. It provides a comprehensive overview of past performance and future projections, incorporating detailed data points on growth rates and adoption metrics for various derivatives and end-use applications. The analysis considers factors like evolving production processes, rising demand from key sectors, and the impact of government policies. Specific growth rates for the historical (2019-2024), estimated (2025), and forecast (2025-2033) periods are provided.
Leading Regions, Countries, or Segments in Ethylene Oxide Structure Industry
This section identifies the dominant regions, countries, and segments within the Ethylene Oxide industry. A detailed breakdown by end-user industry (Automotive, Agrochemicals, etc.) and derivative (Ethylene Glycols, Triethylene Glycol (TEG), etc.) will reveal the key growth areas.
- Key Drivers (by region/segment):
- Investment trends in specific geographic regions and sectors.
- Government regulations and incentives impacting growth.
- Availability of raw materials and infrastructure.
- Dominance Factors: In-depth analysis explaining the factors contributing to the leading position of specific regions or segments. This includes an examination of economic conditions, market access, and competitive landscapes.
Ethylene Oxide Structure Industry Product Innovations
This section highlights recent product innovations, applications, and performance metrics within the Ethylene Oxide industry. The focus is on unique selling propositions (USPs) and technological advancements impacting the production processes and downstream applications of Ethylene Oxide and its derivatives. This includes the exploration of new applications of Ethylene Oxide derivatives and improvements in efficiency and sustainability in manufacturing processes.
Propelling Factors for Ethylene Oxide Structure Industry Growth
This section identifies the key growth drivers of the Ethylene Oxide industry, encompassing technological advancements, economic factors, and regulatory influences. Examples include the increasing demand for ethylene glycol in the manufacturing of polyester fibers and PET bottles and the growing utilization of ethoxylates in detergents and personal care products.
Obstacles in the Ethylene Oxide Structure Industry Market
This section outlines significant barriers and restraints facing the Ethylene Oxide industry. This includes a discussion of regulatory challenges (e.g., stricter environmental regulations), supply chain disruptions (e.g., geopolitical instability affecting raw material sourcing), and competitive pressures (e.g., the emergence of substitute products). The quantifiable impact of these obstacles on market growth is assessed.
Future Opportunities in Ethylene Oxide Structure Industry
This section explores emerging opportunities within the Ethylene Oxide industry. It focuses on new markets, innovative technologies, and evolving consumer trends that could drive future growth. The identification of niche applications for ethylene oxide derivatives and advancements in production technologies are key areas of discussion.
Major Players in the Ethylene Oxide Structure Industry Ecosystem
- Sasol
- Clariant
- Shell plc
- China Petrochemical Corporation
- INEOS
- Reliance Industries Limited
- BASF SE
- LyondellBasell Industries Holdings B.V.
- India Glycols Limited
- SABIC
- Dow
- NIPPON SHOKUBAI CO LTD
- LOTTE Chemical Corporation
Key Developments in Ethylene Oxide Structure Industry Industry
- April 2022: BASF SE and China Petrochemical Corporation announced the expansion of their Verbund site in Nanjing, China, focusing on increased capacities for downstream chemicals, including ethanolamines. This expansion signifies a significant investment in the ethanolamine derivative market, boosting overall production capacity.
- January 2022: ExxonMobil and SABIC announced the startup of a world-scale manufacturing facility in Texas, including a mono-ethylene glycol unit with a capacity of 1.1 Million metric tons per year. This substantial increase in mono-ethylene glycol production capacity indicates a significant boost in supply for this key ethylene oxide derivative.
Strategic Ethylene Oxide Structure Industry Market Forecast
This section summarizes the key growth catalysts and provides a strategic outlook for the Ethylene Oxide industry. It highlights the potential for continued growth driven by increasing demand from key end-use sectors, technological advancements in production processes, and the development of novel applications for ethylene oxide derivatives. The forecast considers the impacts of various macroeconomic factors and potential disruptions. The report concludes by emphasizing the significant market potential and the opportunities for companies to capitalize on the expected growth trajectory.
Ethylene Oxide Structure Industry Segmentation
-
1. Derivative
-
1.1. Ethylene Glycols
- 1.1.1. Monoethylene Glycol (MEG)
- 1.1.2. Diethylene Glycol (DEG)
- 1.1.3. Triethylene Glycol (TEG)
- 1.2. Ethoxylates
- 1.3. Ethanolamines
- 1.4. Glycol Ethers
- 1.5. Polyethylene Glycol
- 1.6. Other Derivatives
-
1.1. Ethylene Glycols
-
2. End-user Industry
- 2.1. Automotive
- 2.2. Agrochemicals
- 2.3. Food and Beverage
- 2.4. Textile
- 2.5. Personal Care
- 2.6. Pharmaceuticals
- 2.7. Detergents
- 2.8. Other End-user Industries
Ethylene Oxide Structure Industry Segmentation By Geography
-
1. Asia Pacific
- 1.1. China
- 1.2. India
- 1.3. Japan
- 1.4. South Korea
- 1.5. Rest of Asia Pacific
-
2. North America
- 2.1. United States
- 2.2. Canada
- 2.3. Mexico
-
3. Europe
- 3.1. Germany
- 3.2. United Kingdom
- 3.3. Italy
- 3.4. France
- 3.5. Rest of Europe
-
4. South America
- 4.1. Brazil
- 4.2. Argentina
- 4.3. Rest of South America
-
5. Middle East and Africa
- 5.1. Saudi Arabia
- 5.2. South Africa
- 5.3. Rest of Middle East and Africa
Ethylene Oxide Structure Industry REPORT HIGHLIGHTS
| Aspects | Details |
|---|---|
| Study Period | 2019-2033 |
| Base Year | 2024 |
| Estimated Year | 2025 |
| Forecast Period | 2025-2033 |
| Historical Period | 2019-2024 |
| Growth Rate | CAGR of > 3.00% from 2019-2033 |
| Segmentation |
|
Table of Contents
- 1. Introduction
- 1.1. Research Scope
- 1.2. Market Segmentation
- 1.3. Research Methodology
- 1.4. Definitions and Assumptions
- 2. Executive Summary
- 2.1. Introduction
- 3. Market Dynamics
- 3.1. Introduction
- 3.2. Market Drivers
- 3.2.1. Growing Usage of PET in the Food and Beverage Industry; Increasing Demand for Household and Personal Care Products in the Developing Countries
- 3.3. Market Restrains
- 3.3.1. Health and Environmental Effects over High Exposure
- 3.4. Market Trends
- 3.4.1. Increasing Demand from the Textile Industry
- 4. Market Factor Analysis
- 4.1. Porters Five Forces
- 4.2. Supply/Value Chain
- 4.3. PESTEL analysis
- 4.4. Market Entropy
- 4.5. Patent/Trademark Analysis
- 5. Global Ethylene Oxide Structure Industry Analysis, Insights and Forecast, 2019-2031
- 5.1. Market Analysis, Insights and Forecast - by Derivative
- 5.1.1. Ethylene Glycols
- 5.1.1.1. Monoethylene Glycol (MEG)
- 5.1.1.2. Diethylene Glycol (DEG)
- 5.1.1.3. Triethylene Glycol (TEG)
- 5.1.2. Ethoxylates
- 5.1.3. Ethanolamines
- 5.1.4. Glycol Ethers
- 5.1.5. Polyethylene Glycol
- 5.1.6. Other Derivatives
- 5.1.1. Ethylene Glycols
- 5.2. Market Analysis, Insights and Forecast - by End-user Industry
- 5.2.1. Automotive
- 5.2.2. Agrochemicals
- 5.2.3. Food and Beverage
- 5.2.4. Textile
- 5.2.5. Personal Care
- 5.2.6. Pharmaceuticals
- 5.2.7. Detergents
- 5.2.8. Other End-user Industries
- 5.3. Market Analysis, Insights and Forecast - by Region
- 5.3.1. Asia Pacific
- 5.3.2. North America
- 5.3.3. Europe
- 5.3.4. South America
- 5.3.5. Middle East and Africa
- 5.1. Market Analysis, Insights and Forecast - by Derivative
- 6. Asia Pacific Ethylene Oxide Structure Industry Analysis, Insights and Forecast, 2019-2031
- 6.1. Market Analysis, Insights and Forecast - by Derivative
- 6.1.1. Ethylene Glycols
- 6.1.1.1. Monoethylene Glycol (MEG)
- 6.1.1.2. Diethylene Glycol (DEG)
- 6.1.1.3. Triethylene Glycol (TEG)
- 6.1.2. Ethoxylates
- 6.1.3. Ethanolamines
- 6.1.4. Glycol Ethers
- 6.1.5. Polyethylene Glycol
- 6.1.6. Other Derivatives
- 6.1.1. Ethylene Glycols
- 6.2. Market Analysis, Insights and Forecast - by End-user Industry
- 6.2.1. Automotive
- 6.2.2. Agrochemicals
- 6.2.3. Food and Beverage
- 6.2.4. Textile
- 6.2.5. Personal Care
- 6.2.6. Pharmaceuticals
- 6.2.7. Detergents
- 6.2.8. Other End-user Industries
- 6.1. Market Analysis, Insights and Forecast - by Derivative
- 7. North America Ethylene Oxide Structure Industry Analysis, Insights and Forecast, 2019-2031
- 7.1. Market Analysis, Insights and Forecast - by Derivative
- 7.1.1. Ethylene Glycols
- 7.1.1.1. Monoethylene Glycol (MEG)
- 7.1.1.2. Diethylene Glycol (DEG)
- 7.1.1.3. Triethylene Glycol (TEG)
- 7.1.2. Ethoxylates
- 7.1.3. Ethanolamines
- 7.1.4. Glycol Ethers
- 7.1.5. Polyethylene Glycol
- 7.1.6. Other Derivatives
- 7.1.1. Ethylene Glycols
- 7.2. Market Analysis, Insights and Forecast - by End-user Industry
- 7.2.1. Automotive
- 7.2.2. Agrochemicals
- 7.2.3. Food and Beverage
- 7.2.4. Textile
- 7.2.5. Personal Care
- 7.2.6. Pharmaceuticals
- 7.2.7. Detergents
- 7.2.8. Other End-user Industries
- 7.1. Market Analysis, Insights and Forecast - by Derivative
- 8. Europe Ethylene Oxide Structure Industry Analysis, Insights and Forecast, 2019-2031
- 8.1. Market Analysis, Insights and Forecast - by Derivative
- 8.1.1. Ethylene Glycols
- 8.1.1.1. Monoethylene Glycol (MEG)
- 8.1.1.2. Diethylene Glycol (DEG)
- 8.1.1.3. Triethylene Glycol (TEG)
- 8.1.2. Ethoxylates
- 8.1.3. Ethanolamines
- 8.1.4. Glycol Ethers
- 8.1.5. Polyethylene Glycol
- 8.1.6. Other Derivatives
- 8.1.1. Ethylene Glycols
- 8.2. Market Analysis, Insights and Forecast - by End-user Industry
- 8.2.1. Automotive
- 8.2.2. Agrochemicals
- 8.2.3. Food and Beverage
- 8.2.4. Textile
- 8.2.5. Personal Care
- 8.2.6. Pharmaceuticals
- 8.2.7. Detergents
- 8.2.8. Other End-user Industries
- 8.1. Market Analysis, Insights and Forecast - by Derivative
- 9. South America Ethylene Oxide Structure Industry Analysis, Insights and Forecast, 2019-2031
- 9.1. Market Analysis, Insights and Forecast - by Derivative
- 9.1.1. Ethylene Glycols
- 9.1.1.1. Monoethylene Glycol (MEG)
- 9.1.1.2. Diethylene Glycol (DEG)
- 9.1.1.3. Triethylene Glycol (TEG)
- 9.1.2. Ethoxylates
- 9.1.3. Ethanolamines
- 9.1.4. Glycol Ethers
- 9.1.5. Polyethylene Glycol
- 9.1.6. Other Derivatives
- 9.1.1. Ethylene Glycols
- 9.2. Market Analysis, Insights and Forecast - by End-user Industry
- 9.2.1. Automotive
- 9.2.2. Agrochemicals
- 9.2.3. Food and Beverage
- 9.2.4. Textile
- 9.2.5. Personal Care
- 9.2.6. Pharmaceuticals
- 9.2.7. Detergents
- 9.2.8. Other End-user Industries
- 9.1. Market Analysis, Insights and Forecast - by Derivative
- 10. Middle East and Africa Ethylene Oxide Structure Industry Analysis, Insights and Forecast, 2019-2031
- 10.1. Market Analysis, Insights and Forecast - by Derivative
- 10.1.1. Ethylene Glycols
- 10.1.1.1. Monoethylene Glycol (MEG)
- 10.1.1.2. Diethylene Glycol (DEG)
- 10.1.1.3. Triethylene Glycol (TEG)
- 10.1.2. Ethoxylates
- 10.1.3. Ethanolamines
- 10.1.4. Glycol Ethers
- 10.1.5. Polyethylene Glycol
- 10.1.6. Other Derivatives
- 10.1.1. Ethylene Glycols
- 10.2. Market Analysis, Insights and Forecast - by End-user Industry
- 10.2.1. Automotive
- 10.2.2. Agrochemicals
- 10.2.3. Food and Beverage
- 10.2.4. Textile
- 10.2.5. Personal Care
- 10.2.6. Pharmaceuticals
- 10.2.7. Detergents
- 10.2.8. Other End-user Industries
- 10.1. Market Analysis, Insights and Forecast - by Derivative
- 11. Asia Pacific Ethylene Oxide Structure Industry Analysis, Insights and Forecast, 2019-2031
- 11.1. Market Analysis, Insights and Forecast - By Country/Sub-region
- 11.1.1 China
- 11.1.2 India
- 11.1.3 Japan
- 11.1.4 South Korea
- 11.1.5 Rest of Asia Pacific
- 12. North America Ethylene Oxide Structure Industry Analysis, Insights and Forecast, 2019-2031
- 12.1. Market Analysis, Insights and Forecast - By Country/Sub-region
- 12.1.1 United States
- 12.1.2 Canada
- 12.1.3 Mexico
- 13. Europe Ethylene Oxide Structure Industry Analysis, Insights and Forecast, 2019-2031
- 13.1. Market Analysis, Insights and Forecast - By Country/Sub-region
- 13.1.1 Germany
- 13.1.2 United Kingdom
- 13.1.3 Italy
- 13.1.4 France
- 13.1.5 Rest of Europe
- 14. South America Ethylene Oxide Structure Industry Analysis, Insights and Forecast, 2019-2031
- 14.1. Market Analysis, Insights and Forecast - By Country/Sub-region
- 14.1.1 Brazil
- 14.1.2 Argentina
- 14.1.3 Rest of South America
- 15. Middle East and Africa Ethylene Oxide Structure Industry Analysis, Insights and Forecast, 2019-2031
- 15.1. Market Analysis, Insights and Forecast - By Country/Sub-region
- 15.1.1 Saudi Arabia
- 15.1.2 South Africa
- 15.1.3 Rest of Middle East and Africa
- 16. Competitive Analysis
- 16.1. Global Market Share Analysis 2024
- 16.2. Company Profiles
- 16.2.1 Sasol
- 16.2.1.1. Overview
- 16.2.1.2. Products
- 16.2.1.3. SWOT Analysis
- 16.2.1.4. Recent Developments
- 16.2.1.5. Financials (Based on Availability)
- 16.2.2 Clariant
- 16.2.2.1. Overview
- 16.2.2.2. Products
- 16.2.2.3. SWOT Analysis
- 16.2.2.4. Recent Developments
- 16.2.2.5. Financials (Based on Availability)
- 16.2.3 Shell plc
- 16.2.3.1. Overview
- 16.2.3.2. Products
- 16.2.3.3. SWOT Analysis
- 16.2.3.4. Recent Developments
- 16.2.3.5. Financials (Based on Availability)
- 16.2.4 China Petrochemical Corporation
- 16.2.4.1. Overview
- 16.2.4.2. Products
- 16.2.4.3. SWOT Analysis
- 16.2.4.4. Recent Developments
- 16.2.4.5. Financials (Based on Availability)
- 16.2.5 INEOS
- 16.2.5.1. Overview
- 16.2.5.2. Products
- 16.2.5.3. SWOT Analysis
- 16.2.5.4. Recent Developments
- 16.2.5.5. Financials (Based on Availability)
- 16.2.6 Reliance Industries Limited
- 16.2.6.1. Overview
- 16.2.6.2. Products
- 16.2.6.3. SWOT Analysis
- 16.2.6.4. Recent Developments
- 16.2.6.5. Financials (Based on Availability)
- 16.2.7 BASF SE
- 16.2.7.1. Overview
- 16.2.7.2. Products
- 16.2.7.3. SWOT Analysis
- 16.2.7.4. Recent Developments
- 16.2.7.5. Financials (Based on Availability)
- 16.2.8 LyondellBasell Industries Holdings B V
- 16.2.8.1. Overview
- 16.2.8.2. Products
- 16.2.8.3. SWOT Analysis
- 16.2.8.4. Recent Developments
- 16.2.8.5. Financials (Based on Availability)
- 16.2.9 India Glycols Limited
- 16.2.9.1. Overview
- 16.2.9.2. Products
- 16.2.9.3. SWOT Analysis
- 16.2.9.4. Recent Developments
- 16.2.9.5. Financials (Based on Availability)
- 16.2.10 SABIC
- 16.2.10.1. Overview
- 16.2.10.2. Products
- 16.2.10.3. SWOT Analysis
- 16.2.10.4. Recent Developments
- 16.2.10.5. Financials (Based on Availability)
- 16.2.11 Dow
- 16.2.11.1. Overview
- 16.2.11.2. Products
- 16.2.11.3. SWOT Analysis
- 16.2.11.4. Recent Developments
- 16.2.11.5. Financials (Based on Availability)
- 16.2.12 NIPPON SHOKUBAI CO LTD
- 16.2.12.1. Overview
- 16.2.12.2. Products
- 16.2.12.3. SWOT Analysis
- 16.2.12.4. Recent Developments
- 16.2.12.5. Financials (Based on Availability)
- 16.2.13 LOTTE Chemical Corporation
- 16.2.13.1. Overview
- 16.2.13.2. Products
- 16.2.13.3. SWOT Analysis
- 16.2.13.4. Recent Developments
- 16.2.13.5. Financials (Based on Availability)
- 16.2.1 Sasol
List of Figures
- Figure 1: Global Ethylene Oxide Structure Industry Revenue Breakdown (Million, %) by Region 2024 & 2032
- Figure 2: Asia Pacific Ethylene Oxide Structure Industry Revenue (Million), by Country 2024 & 2032
- Figure 3: Asia Pacific Ethylene Oxide Structure Industry Revenue Share (%), by Country 2024 & 2032
- Figure 4: North America Ethylene Oxide Structure Industry Revenue (Million), by Country 2024 & 2032
- Figure 5: North America Ethylene Oxide Structure Industry Revenue Share (%), by Country 2024 & 2032
- Figure 6: Europe Ethylene Oxide Structure Industry Revenue (Million), by Country 2024 & 2032
- Figure 7: Europe Ethylene Oxide Structure Industry Revenue Share (%), by Country 2024 & 2032
- Figure 8: South America Ethylene Oxide Structure Industry Revenue (Million), by Country 2024 & 2032
- Figure 9: South America Ethylene Oxide Structure Industry Revenue Share (%), by Country 2024 & 2032
- Figure 10: Middle East and Africa Ethylene Oxide Structure Industry Revenue (Million), by Country 2024 & 2032
- Figure 11: Middle East and Africa Ethylene Oxide Structure Industry Revenue Share (%), by Country 2024 & 2032
- Figure 12: Asia Pacific Ethylene Oxide Structure Industry Revenue (Million), by Derivative 2024 & 2032
- Figure 13: Asia Pacific Ethylene Oxide Structure Industry Revenue Share (%), by Derivative 2024 & 2032
- Figure 14: Asia Pacific Ethylene Oxide Structure Industry Revenue (Million), by End-user Industry 2024 & 2032
- Figure 15: Asia Pacific Ethylene Oxide Structure Industry Revenue Share (%), by End-user Industry 2024 & 2032
- Figure 16: Asia Pacific Ethylene Oxide Structure Industry Revenue (Million), by Country 2024 & 2032
- Figure 17: Asia Pacific Ethylene Oxide Structure Industry Revenue Share (%), by Country 2024 & 2032
- Figure 18: North America Ethylene Oxide Structure Industry Revenue (Million), by Derivative 2024 & 2032
- Figure 19: North America Ethylene Oxide Structure Industry Revenue Share (%), by Derivative 2024 & 2032
- Figure 20: North America Ethylene Oxide Structure Industry Revenue (Million), by End-user Industry 2024 & 2032
- Figure 21: North America Ethylene Oxide Structure Industry Revenue Share (%), by End-user Industry 2024 & 2032
- Figure 22: North America Ethylene Oxide Structure Industry Revenue (Million), by Country 2024 & 2032
- Figure 23: North America Ethylene Oxide Structure Industry Revenue Share (%), by Country 2024 & 2032
- Figure 24: Europe Ethylene Oxide Structure Industry Revenue (Million), by Derivative 2024 & 2032
- Figure 25: Europe Ethylene Oxide Structure Industry Revenue Share (%), by Derivative 2024 & 2032
- Figure 26: Europe Ethylene Oxide Structure Industry Revenue (Million), by End-user Industry 2024 & 2032
- Figure 27: Europe Ethylene Oxide Structure Industry Revenue Share (%), by End-user Industry 2024 & 2032
- Figure 28: Europe Ethylene Oxide Structure Industry Revenue (Million), by Country 2024 & 2032
- Figure 29: Europe Ethylene Oxide Structure Industry Revenue Share (%), by Country 2024 & 2032
- Figure 30: South America Ethylene Oxide Structure Industry Revenue (Million), by Derivative 2024 & 2032
- Figure 31: South America Ethylene Oxide Structure Industry Revenue Share (%), by Derivative 2024 & 2032
- Figure 32: South America Ethylene Oxide Structure Industry Revenue (Million), by End-user Industry 2024 & 2032
- Figure 33: South America Ethylene Oxide Structure Industry Revenue Share (%), by End-user Industry 2024 & 2032
- Figure 34: South America Ethylene Oxide Structure Industry Revenue (Million), by Country 2024 & 2032
- Figure 35: South America Ethylene Oxide Structure Industry Revenue Share (%), by Country 2024 & 2032
- Figure 36: Middle East and Africa Ethylene Oxide Structure Industry Revenue (Million), by Derivative 2024 & 2032
- Figure 37: Middle East and Africa Ethylene Oxide Structure Industry Revenue Share (%), by Derivative 2024 & 2032
- Figure 38: Middle East and Africa Ethylene Oxide Structure Industry Revenue (Million), by End-user Industry 2024 & 2032
- Figure 39: Middle East and Africa Ethylene Oxide Structure Industry Revenue Share (%), by End-user Industry 2024 & 2032
- Figure 40: Middle East and Africa Ethylene Oxide Structure Industry Revenue (Million), by Country 2024 & 2032
- Figure 41: Middle East and Africa Ethylene Oxide Structure Industry Revenue Share (%), by Country 2024 & 2032
List of Tables
- Table 1: Global Ethylene Oxide Structure Industry Revenue Million Forecast, by Region 2019 & 2032
- Table 2: Global Ethylene Oxide Structure Industry Revenue Million Forecast, by Derivative 2019 & 2032
- Table 3: Global Ethylene Oxide Structure Industry Revenue Million Forecast, by End-user Industry 2019 & 2032
- Table 4: Global Ethylene Oxide Structure Industry Revenue Million Forecast, by Region 2019 & 2032
- Table 5: Global Ethylene Oxide Structure Industry Revenue Million Forecast, by Country 2019 & 2032
- Table 6: China Ethylene Oxide Structure Industry Revenue (Million) Forecast, by Application 2019 & 2032
- Table 7: India Ethylene Oxide Structure Industry Revenue (Million) Forecast, by Application 2019 & 2032
- Table 8: Japan Ethylene Oxide Structure Industry Revenue (Million) Forecast, by Application 2019 & 2032
- Table 9: South Korea Ethylene Oxide Structure Industry Revenue (Million) Forecast, by Application 2019 & 2032
- Table 10: Rest of Asia Pacific Ethylene Oxide Structure Industry Revenue (Million) Forecast, by Application 2019 & 2032
- Table 11: Global Ethylene Oxide Structure Industry Revenue Million Forecast, by Country 2019 & 2032
- Table 12: United States Ethylene Oxide Structure Industry Revenue (Million) Forecast, by Application 2019 & 2032
- Table 13: Canada Ethylene Oxide Structure Industry Revenue (Million) Forecast, by Application 2019 & 2032
- Table 14: Mexico Ethylene Oxide Structure Industry Revenue (Million) Forecast, by Application 2019 & 2032
- Table 15: Global Ethylene Oxide Structure Industry Revenue Million Forecast, by Country 2019 & 2032
- Table 16: Germany Ethylene Oxide Structure Industry Revenue (Million) Forecast, by Application 2019 & 2032
- Table 17: United Kingdom Ethylene Oxide Structure Industry Revenue (Million) Forecast, by Application 2019 & 2032
- Table 18: Italy Ethylene Oxide Structure Industry Revenue (Million) Forecast, by Application 2019 & 2032
- Table 19: France Ethylene Oxide Structure Industry Revenue (Million) Forecast, by Application 2019 & 2032
- Table 20: Rest of Europe Ethylene Oxide Structure Industry Revenue (Million) Forecast, by Application 2019 & 2032
- Table 21: Global Ethylene Oxide Structure Industry Revenue Million Forecast, by Country 2019 & 2032
- Table 22: Brazil Ethylene Oxide Structure Industry Revenue (Million) Forecast, by Application 2019 & 2032
- Table 23: Argentina Ethylene Oxide Structure Industry Revenue (Million) Forecast, by Application 2019 & 2032
- Table 24: Rest of South America Ethylene Oxide Structure Industry Revenue (Million) Forecast, by Application 2019 & 2032
- Table 25: Global Ethylene Oxide Structure Industry Revenue Million Forecast, by Country 2019 & 2032
- Table 26: Saudi Arabia Ethylene Oxide Structure Industry Revenue (Million) Forecast, by Application 2019 & 2032
- Table 27: South Africa Ethylene Oxide Structure Industry Revenue (Million) Forecast, by Application 2019 & 2032
- Table 28: Rest of Middle East and Africa Ethylene Oxide Structure Industry Revenue (Million) Forecast, by Application 2019 & 2032
- Table 29: Global Ethylene Oxide Structure Industry Revenue Million Forecast, by Derivative 2019 & 2032
- Table 30: Global Ethylene Oxide Structure Industry Revenue Million Forecast, by End-user Industry 2019 & 2032
- Table 31: Global Ethylene Oxide Structure Industry Revenue Million Forecast, by Country 2019 & 2032
- Table 32: China Ethylene Oxide Structure Industry Revenue (Million) Forecast, by Application 2019 & 2032
- Table 33: India Ethylene Oxide Structure Industry Revenue (Million) Forecast, by Application 2019 & 2032
- Table 34: Japan Ethylene Oxide Structure Industry Revenue (Million) Forecast, by Application 2019 & 2032
- Table 35: South Korea Ethylene Oxide Structure Industry Revenue (Million) Forecast, by Application 2019 & 2032
- Table 36: Rest of Asia Pacific Ethylene Oxide Structure Industry Revenue (Million) Forecast, by Application 2019 & 2032
- Table 37: Global Ethylene Oxide Structure Industry Revenue Million Forecast, by Derivative 2019 & 2032
- Table 38: Global Ethylene Oxide Structure Industry Revenue Million Forecast, by End-user Industry 2019 & 2032
- Table 39: Global Ethylene Oxide Structure Industry Revenue Million Forecast, by Country 2019 & 2032
- Table 40: United States Ethylene Oxide Structure Industry Revenue (Million) Forecast, by Application 2019 & 2032
- Table 41: Canada Ethylene Oxide Structure Industry Revenue (Million) Forecast, by Application 2019 & 2032
- Table 42: Mexico Ethylene Oxide Structure Industry Revenue (Million) Forecast, by Application 2019 & 2032
- Table 43: Global Ethylene Oxide Structure Industry Revenue Million Forecast, by Derivative 2019 & 2032
- Table 44: Global Ethylene Oxide Structure Industry Revenue Million Forecast, by End-user Industry 2019 & 2032
- Table 45: Global Ethylene Oxide Structure Industry Revenue Million Forecast, by Country 2019 & 2032
- Table 46: Germany Ethylene Oxide Structure Industry Revenue (Million) Forecast, by Application 2019 & 2032
- Table 47: United Kingdom Ethylene Oxide Structure Industry Revenue (Million) Forecast, by Application 2019 & 2032
- Table 48: Italy Ethylene Oxide Structure Industry Revenue (Million) Forecast, by Application 2019 & 2032
- Table 49: France Ethylene Oxide Structure Industry Revenue (Million) Forecast, by Application 2019 & 2032
- Table 50: Rest of Europe Ethylene Oxide Structure Industry Revenue (Million) Forecast, by Application 2019 & 2032
- Table 51: Global Ethylene Oxide Structure Industry Revenue Million Forecast, by Derivative 2019 & 2032
- Table 52: Global Ethylene Oxide Structure Industry Revenue Million Forecast, by End-user Industry 2019 & 2032
- Table 53: Global Ethylene Oxide Structure Industry Revenue Million Forecast, by Country 2019 & 2032
- Table 54: Brazil Ethylene Oxide Structure Industry Revenue (Million) Forecast, by Application 2019 & 2032
- Table 55: Argentina Ethylene Oxide Structure Industry Revenue (Million) Forecast, by Application 2019 & 2032
- Table 56: Rest of South America Ethylene Oxide Structure Industry Revenue (Million) Forecast, by Application 2019 & 2032
- Table 57: Global Ethylene Oxide Structure Industry Revenue Million Forecast, by Derivative 2019 & 2032
- Table 58: Global Ethylene Oxide Structure Industry Revenue Million Forecast, by End-user Industry 2019 & 2032
- Table 59: Global Ethylene Oxide Structure Industry Revenue Million Forecast, by Country 2019 & 2032
- Table 60: Saudi Arabia Ethylene Oxide Structure Industry Revenue (Million) Forecast, by Application 2019 & 2032
- Table 61: South Africa Ethylene Oxide Structure Industry Revenue (Million) Forecast, by Application 2019 & 2032
- Table 62: Rest of Middle East and Africa Ethylene Oxide Structure Industry Revenue (Million) Forecast, by Application 2019 & 2032
Frequently Asked Questions
1. What is the projected Compound Annual Growth Rate (CAGR) of the Ethylene Oxide Structure Industry?
The projected CAGR is approximately > 3.00%.
2. Which companies are prominent players in the Ethylene Oxide Structure Industry?
Key companies in the market include Sasol, Clariant, Shell plc, China Petrochemical Corporation, INEOS, Reliance Industries Limited, BASF SE, LyondellBasell Industries Holdings B V, India Glycols Limited, SABIC, Dow, NIPPON SHOKUBAI CO LTD, LOTTE Chemical Corporation.
3. What are the main segments of the Ethylene Oxide Structure Industry?
The market segments include Derivative, End-user Industry.
4. Can you provide details about the market size?
The market size is estimated to be USD XX Million as of 2022.
5. What are some drivers contributing to market growth?
Growing Usage of PET in the Food and Beverage Industry; Increasing Demand for Household and Personal Care Products in the Developing Countries.
6. What are the notable trends driving market growth?
Increasing Demand from the Textile Industry.
7. Are there any restraints impacting market growth?
Health and Environmental Effects over High Exposure.
8. Can you provide examples of recent developments in the market?
In April 2022: BASF SE and China Petrochemical Corporation announced the expansion of their Verbund site located in China operated by BASF-YPC Co., Ltd. It is a 50-50 joint venture of both companies in Nanjing. The expansion will focus on increasing the capacities of many downstream chemicals, including ethanolamines which are the derivatives of ethylene oxide.
9. What pricing options are available for accessing the report?
Pricing options include single-user, multi-user, and enterprise licenses priced at USD 4750, USD 5250, and USD 8750 respectively.
10. Is the market size provided in terms of value or volume?
The market size is provided in terms of value, measured in Million.
11. Are there any specific market keywords associated with the report?
Yes, the market keyword associated with the report is "Ethylene Oxide Structure Industry," which aids in identifying and referencing the specific market segment covered.
12. How do I determine which pricing option suits my needs best?
The pricing options vary based on user requirements and access needs. Individual users may opt for single-user licenses, while businesses requiring broader access may choose multi-user or enterprise licenses for cost-effective access to the report.
13. Are there any additional resources or data provided in the Ethylene Oxide Structure Industry report?
While the report offers comprehensive insights, it's advisable to review the specific contents or supplementary materials provided to ascertain if additional resources or data are available.
14. How can I stay updated on further developments or reports in the Ethylene Oxide Structure Industry?
To stay informed about further developments, trends, and reports in the Ethylene Oxide Structure Industry, consider subscribing to industry newsletters, following relevant companies and organizations, or regularly checking reputable industry news sources and publications.
Methodology
Step 1 - Identification of Relevant Samples Size from Population Database


Step 2 - Approaches for Defining Global Market Size (Value, Volume* & Price*)

Note*: In applicable scenarios
Step 3 - Data Sources
Primary Research
- Web Analytics
- Survey Reports
- Research Institute
- Latest Research Reports
- Opinion Leaders
Secondary Research
- Annual Reports
- White Paper
- Latest Press Release
- Industry Association
- Paid Database
- Investor Presentations

Step 4 - Data Triangulation
Involves using different sources of information in order to increase the validity of a study
These sources are likely to be stakeholders in a program - participants, other researchers, program staff, other community members, and so on.
Then we put all data in single framework & apply various statistical tools to find out the dynamic on the market.
During the analysis stage, feedback from the stakeholder groups would be compared to determine areas of agreement as well as areas of divergence
