

Key Insights
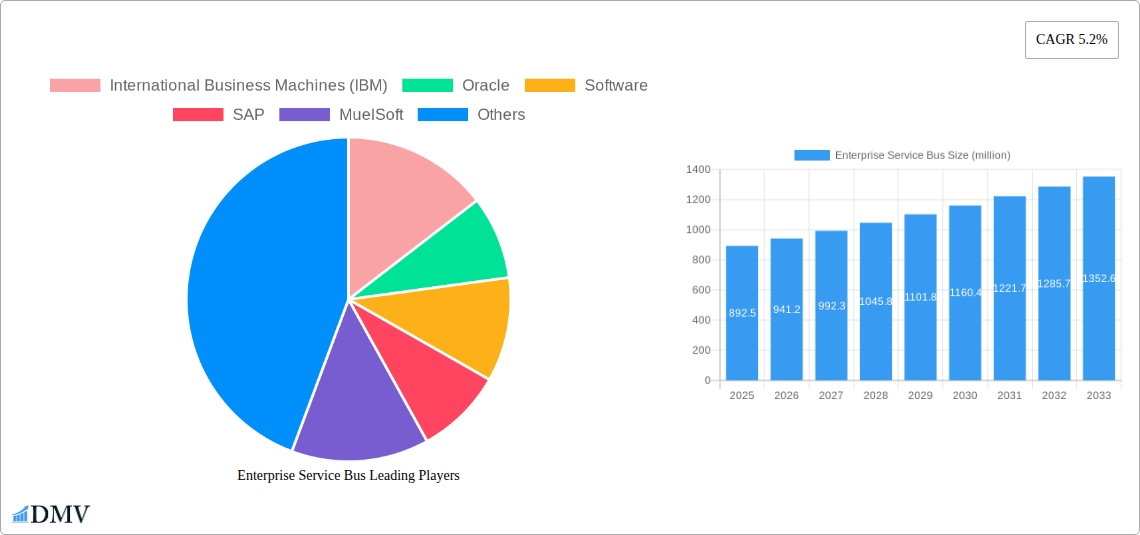
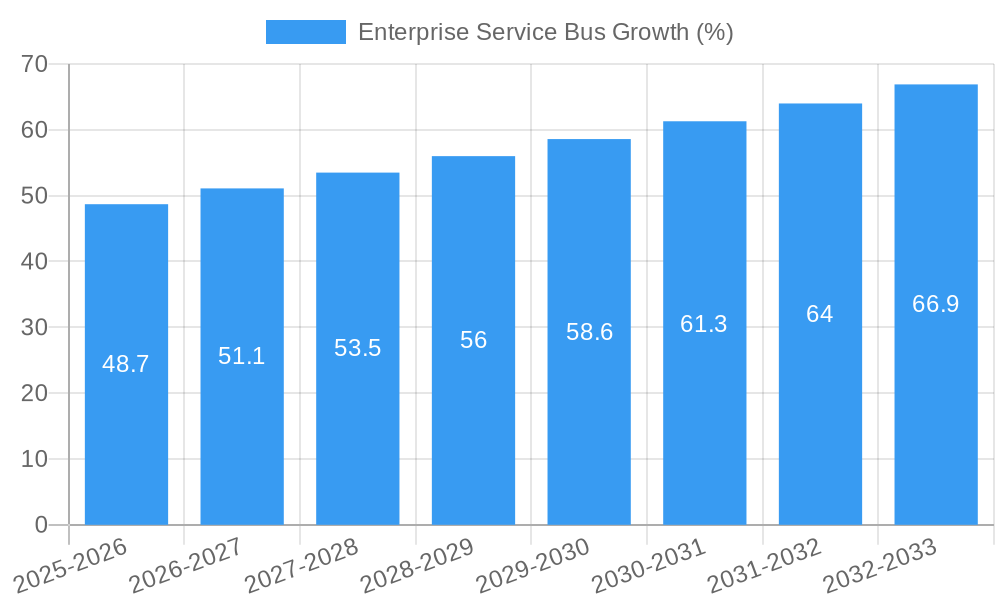
The Enterprise Service Bus (ESB) market, valued at $892.5 million in 2025, is projected to experience robust growth, driven by the increasing need for seamless integration of applications and data within organizations. A Compound Annual Growth Rate (CAGR) of 5.2% from 2025 to 2033 indicates a significant expansion, fueled by several key factors. The rise of cloud computing and microservices architectures necessitates efficient and reliable integration solutions, creating a strong demand for ESBs. Furthermore, the growing adoption of digital transformation initiatives across various industries, including finance, healthcare, and retail, is a primary driver. Businesses are increasingly relying on ESBs to consolidate disparate systems, improve operational efficiency, and enhance data visibility. The market's growth is also influenced by the development of advanced functionalities such as API management, real-time data processing, and improved security features within ESB platforms. Competitive landscape analysis shows key players like IBM, Oracle, Software AG, SAP, and MuleSoft vying for market share through innovation and strategic partnerships.
Despite the positive growth trajectory, certain challenges may restrain market expansion. High implementation costs and the complexity involved in integrating legacy systems with modern ESB architectures can pose barriers for smaller businesses. The need for skilled professionals to manage and maintain these complex systems represents another potential constraint. However, the long-term benefits of enhanced data connectivity, improved application performance, and streamlined business processes outweigh these challenges, leading to continuous market growth. The emergence of newer integration technologies, such as event-driven architectures, might influence ESB market penetration, but ESBs will likely remain a critical component in many organizations' integration strategies due to their proven track record and established functionalities.
Enterprise Service Bus Market: A Comprehensive Report (2019-2033)
This insightful report provides a detailed analysis of the Enterprise Service Bus (ESB) market, projecting a multi-million dollar valuation by 2033. The study covers the period from 2019 to 2033, with 2025 serving as both the base and estimated year. This comprehensive analysis will equip stakeholders with crucial insights for informed decision-making in this dynamic sector. We delve deep into market composition, technological advancements, key players (including IBM, Oracle, SAP, MuleSoft), and future growth opportunities. The report utilizes rigorous data analysis and expert insights to provide a clear and actionable understanding of this multi-million dollar market.
Enterprise Service Bus Market Composition & Trends
The global Enterprise Service Bus market, valued at $XX million in 2024, is expected to reach $XX million by 2033, exhibiting a CAGR of XX%. Market concentration is moderate, with key players like IBM, Oracle, and SAP holding significant shares. However, the emergence of agile players like MuleSoft is increasing competition.
- Market Share Distribution (2024): IBM (XX%), Oracle (XX%), SAP (XX%), MuleSoft (XX%), Others (XX%). These figures are estimates based on available market data.
- Innovation Catalysts: Cloud computing, microservices architecture, and AI integration are driving innovation.
- Regulatory Landscape: Compliance regulations like GDPR and CCPA are influencing ESB adoption and security practices.
- Substitute Products: API gateways and message queues offer alternative solutions, but ESB's robust integration capabilities remain a key differentiator.
- End-User Profiles: Large enterprises across diverse sectors, including finance, healthcare, and retail, are major adopters.
- M&A Activities: The historical period (2019-2024) witnessed several M&A deals totaling $XX million, primarily focused on enhancing capabilities and expanding market reach. These deals involved acquisitions of smaller ESB providers by larger technology firms.
Enterprise Service Bus Industry Evolution
The ESB market has evolved significantly since 2019. The initial years saw a focus on on-premise deployments. However, the shift towards cloud-native architectures and the rise of microservices have significantly impacted the market. We've witnessed a dramatic increase in cloud-based ESB solutions, driven by the need for scalability, agility, and cost-effectiveness. The adoption rate of cloud-based ESB solutions has grown exponentially, increasing from XX% in 2019 to an estimated XX% in 2024, fueled by the increasing demand for seamless integration across diverse applications and platforms. The market growth trajectory showcases a steady upward trend, with a projected compound annual growth rate (CAGR) of XX% during the forecast period (2025-2033). This growth is primarily driven by the need for real-time data integration and the increasing complexity of IT infrastructures. Consumer demand is shifting towards solutions offering improved security, ease of management, and enhanced scalability.
Leading Regions, Countries, or Segments in Enterprise Service Bus
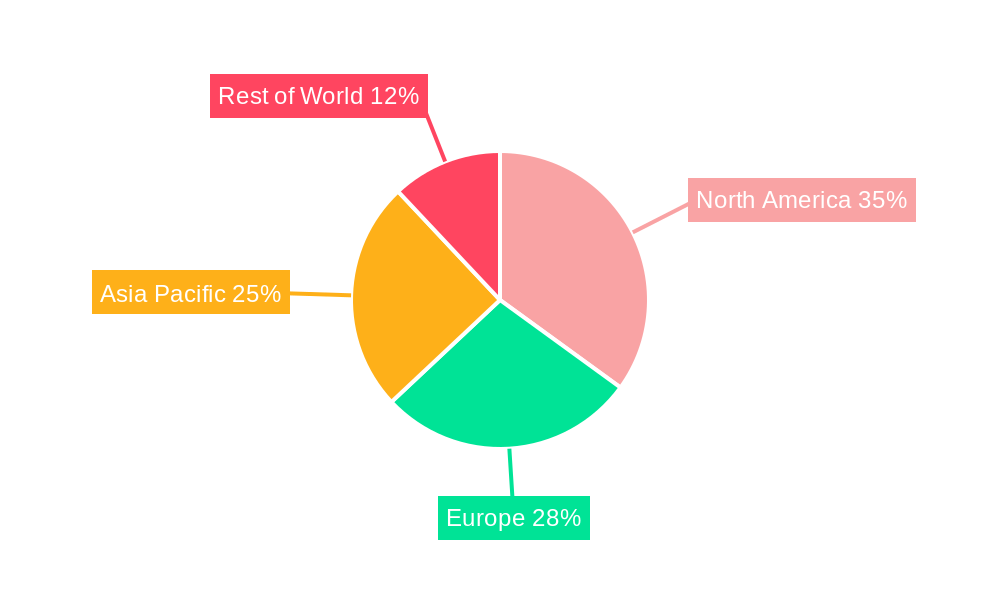
North America currently holds the dominant position in the ESB market, followed by Europe and Asia-Pacific.
Key Drivers for North American Dominance:
- High adoption of cloud technologies.
- Significant investments in digital transformation initiatives.
- Robust regulatory frameworks supporting digital innovation.
- Presence of major ESB vendors.
Detailed Analysis: The strong presence of major technology companies and a mature IT infrastructure in North America have contributed significantly to its market leadership. The region's emphasis on digital transformation has further boosted the demand for ESB solutions to integrate diverse applications and streamline business processes. Government initiatives and regulatory support for digital infrastructure development have further accelerated market growth.
Enterprise Service Bus Product Innovations
Recent innovations focus on enhancing security, scalability, and ease of use. Advanced features include real-time data streaming, AI-powered integration capabilities, and improved monitoring and management tools. Key selling propositions include simplified deployment, reduced operational costs, and enhanced interoperability. This evolution results in faster integration processes, improved data security, and greater agility for businesses.
Propelling Factors for Enterprise Service Bus Growth
Several factors drive ESB market growth:
- Technological Advancements: Cloud computing, microservices, and AI are key drivers.
- Economic Growth: Increased investment in digital transformation across industries.
- Regulatory Compliance: Compliance needs are pushing businesses towards robust integration solutions.
Obstacles in the Enterprise Service Bus Market
Challenges include:
- High Implementation Costs: Deploying and managing ESBs can be expensive.
- Complexity: Integrating diverse systems can be technically challenging.
- Security Concerns: Protecting sensitive data transmitted through the ESB is crucial.
Future Opportunities in Enterprise Service Bus
The ESB market presents exciting opportunities:
- Expansion into Emerging Markets: Developing economies present significant growth potential.
- Integration with IoT Devices: Connecting IoT devices and enterprise systems offers vast possibilities.
- Serverless Computing Integration: Leveraging serverless architectures for enhanced scalability and efficiency.
Major Players in the Enterprise Service Bus Ecosystem
- International Business Machines (IBM)
- Oracle
- SAP
- MuleSoft
Key Developments in Enterprise Service Bus Industry
- 2022 Q3: MuleSoft launches enhanced security features for its Anypoint Platform.
- 2023 Q1: IBM announces its new cloud-based ESB solution, integrating AI capabilities.
- 2024 Q2: Oracle releases a significant upgrade to its ESB offering, improving scalability.
Strategic Enterprise Service Bus Market Forecast
The ESB market is poised for continued growth, driven by increasing digital transformation initiatives and the rising need for seamless application integration. New technologies like serverless computing and edge computing will further fuel market expansion, creating significant opportunities for vendors and fostering innovation. The forecast indicates a sustained high growth trajectory throughout the forecast period (2025-2033), making it a lucrative market for both established players and emerging companies.
Enterprise Service Bus Segmentation
-
1. Application
- 1.1. Banks
- 1.2. Financial Services And Insurance (BFSI)
- 1.3. Retail
- 1.4. Manufacturing And Utilities
-
2. Types
- 2.1. Hardware Devices
- 2.2. Software System
Enterprise Service Bus Segmentation By Geography
-
1. North America
- 1.1. United States
- 1.2. Canada
- 1.3. Mexico
-
2. South America
- 2.1. Brazil
- 2.2. Argentina
- 2.3. Rest of South America
-
3. Europe
- 3.1. United Kingdom
- 3.2. Germany
- 3.3. France
- 3.4. Italy
- 3.5. Spain
- 3.6. Russia
- 3.7. Benelux
- 3.8. Nordics
- 3.9. Rest of Europe
-
4. Middle East & Africa
- 4.1. Turkey
- 4.2. Israel
- 4.3. GCC
- 4.4. North Africa
- 4.5. South Africa
- 4.6. Rest of Middle East & Africa
-
5. Asia Pacific
- 5.1. China
- 5.2. India
- 5.3. Japan
- 5.4. South Korea
- 5.5. ASEAN
- 5.6. Oceania
- 5.7. Rest of Asia Pacific
Enterprise Service Bus REPORT HIGHLIGHTS
| Aspects | Details |
|---|---|
| Study Period | 2019-2033 |
| Base Year | 2024 |
| Estimated Year | 2025 |
| Forecast Period | 2025-2033 |
| Historical Period | 2019-2024 |
| Growth Rate | CAGR of 5.2% from 2019-2033 |
| Segmentation |
|
Table of Contents
- 1. Introduction
- 1.1. Research Scope
- 1.2. Market Segmentation
- 1.3. Research Methodology
- 1.4. Definitions and Assumptions
- 2. Executive Summary
- 2.1. Introduction
- 3. Market Dynamics
- 3.1. Introduction
- 3.2. Market Drivers
- 3.3. Market Restrains
- 3.4. Market Trends
- 4. Market Factor Analysis
- 4.1. Porters Five Forces
- 4.2. Supply/Value Chain
- 4.3. PESTEL analysis
- 4.4. Market Entropy
- 4.5. Patent/Trademark Analysis
- 5. Global Enterprise Service Bus Analysis, Insights and Forecast, 2019-2031
- 5.1. Market Analysis, Insights and Forecast - by Application
- 5.1.1. Banks
- 5.1.2. Financial Services And Insurance (BFSI)
- 5.1.3. Retail
- 5.1.4. Manufacturing And Utilities
- 5.2. Market Analysis, Insights and Forecast - by Types
- 5.2.1. Hardware Devices
- 5.2.2. Software System
- 5.3. Market Analysis, Insights and Forecast - by Region
- 5.3.1. North America
- 5.3.2. South America
- 5.3.3. Europe
- 5.3.4. Middle East & Africa
- 5.3.5. Asia Pacific
- 5.1. Market Analysis, Insights and Forecast - by Application
- 6. North America Enterprise Service Bus Analysis, Insights and Forecast, 2019-2031
- 6.1. Market Analysis, Insights and Forecast - by Application
- 6.1.1. Banks
- 6.1.2. Financial Services And Insurance (BFSI)
- 6.1.3. Retail
- 6.1.4. Manufacturing And Utilities
- 6.2. Market Analysis, Insights and Forecast - by Types
- 6.2.1. Hardware Devices
- 6.2.2. Software System
- 6.1. Market Analysis, Insights and Forecast - by Application
- 7. South America Enterprise Service Bus Analysis, Insights and Forecast, 2019-2031
- 7.1. Market Analysis, Insights and Forecast - by Application
- 7.1.1. Banks
- 7.1.2. Financial Services And Insurance (BFSI)
- 7.1.3. Retail
- 7.1.4. Manufacturing And Utilities
- 7.2. Market Analysis, Insights and Forecast - by Types
- 7.2.1. Hardware Devices
- 7.2.2. Software System
- 7.1. Market Analysis, Insights and Forecast - by Application
- 8. Europe Enterprise Service Bus Analysis, Insights and Forecast, 2019-2031
- 8.1. Market Analysis, Insights and Forecast - by Application
- 8.1.1. Banks
- 8.1.2. Financial Services And Insurance (BFSI)
- 8.1.3. Retail
- 8.1.4. Manufacturing And Utilities
- 8.2. Market Analysis, Insights and Forecast - by Types
- 8.2.1. Hardware Devices
- 8.2.2. Software System
- 8.1. Market Analysis, Insights and Forecast - by Application
- 9. Middle East & Africa Enterprise Service Bus Analysis, Insights and Forecast, 2019-2031
- 9.1. Market Analysis, Insights and Forecast - by Application
- 9.1.1. Banks
- 9.1.2. Financial Services And Insurance (BFSI)
- 9.1.3. Retail
- 9.1.4. Manufacturing And Utilities
- 9.2. Market Analysis, Insights and Forecast - by Types
- 9.2.1. Hardware Devices
- 9.2.2. Software System
- 9.1. Market Analysis, Insights and Forecast - by Application
- 10. Asia Pacific Enterprise Service Bus Analysis, Insights and Forecast, 2019-2031
- 10.1. Market Analysis, Insights and Forecast - by Application
- 10.1.1. Banks
- 10.1.2. Financial Services And Insurance (BFSI)
- 10.1.3. Retail
- 10.1.4. Manufacturing And Utilities
- 10.2. Market Analysis, Insights and Forecast - by Types
- 10.2.1. Hardware Devices
- 10.2.2. Software System
- 10.1. Market Analysis, Insights and Forecast - by Application
- 11. Competitive Analysis
- 11.1. Global Market Share Analysis 2024
- 11.2. Company Profiles
- 11.2.1 International Business Machines (IBM)
- 11.2.1.1. Overview
- 11.2.1.2. Products
- 11.2.1.3. SWOT Analysis
- 11.2.1.4. Recent Developments
- 11.2.1.5. Financials (Based on Availability)
- 11.2.2 Oracle
- 11.2.2.1. Overview
- 11.2.2.2. Products
- 11.2.2.3. SWOT Analysis
- 11.2.2.4. Recent Developments
- 11.2.2.5. Financials (Based on Availability)
- 11.2.3 Software
- 11.2.3.1. Overview
- 11.2.3.2. Products
- 11.2.3.3. SWOT Analysis
- 11.2.3.4. Recent Developments
- 11.2.3.5. Financials (Based on Availability)
- 11.2.4 SAP
- 11.2.4.1. Overview
- 11.2.4.2. Products
- 11.2.4.3. SWOT Analysis
- 11.2.4.4. Recent Developments
- 11.2.4.5. Financials (Based on Availability)
- 11.2.5 MuelSoft
- 11.2.5.1. Overview
- 11.2.5.2. Products
- 11.2.5.3. SWOT Analysis
- 11.2.5.4. Recent Developments
- 11.2.5.5. Financials (Based on Availability)
- 11.2.1 International Business Machines (IBM)
List of Figures
- Figure 1: Global Enterprise Service Bus Revenue Breakdown (million, %) by Region 2024 & 2032
- Figure 2: North America Enterprise Service Bus Revenue (million), by Application 2024 & 2032
- Figure 3: North America Enterprise Service Bus Revenue Share (%), by Application 2024 & 2032
- Figure 4: North America Enterprise Service Bus Revenue (million), by Types 2024 & 2032
- Figure 5: North America Enterprise Service Bus Revenue Share (%), by Types 2024 & 2032
- Figure 6: North America Enterprise Service Bus Revenue (million), by Country 2024 & 2032
- Figure 7: North America Enterprise Service Bus Revenue Share (%), by Country 2024 & 2032
- Figure 8: South America Enterprise Service Bus Revenue (million), by Application 2024 & 2032
- Figure 9: South America Enterprise Service Bus Revenue Share (%), by Application 2024 & 2032
- Figure 10: South America Enterprise Service Bus Revenue (million), by Types 2024 & 2032
- Figure 11: South America Enterprise Service Bus Revenue Share (%), by Types 2024 & 2032
- Figure 12: South America Enterprise Service Bus Revenue (million), by Country 2024 & 2032
- Figure 13: South America Enterprise Service Bus Revenue Share (%), by Country 2024 & 2032
- Figure 14: Europe Enterprise Service Bus Revenue (million), by Application 2024 & 2032
- Figure 15: Europe Enterprise Service Bus Revenue Share (%), by Application 2024 & 2032
- Figure 16: Europe Enterprise Service Bus Revenue (million), by Types 2024 & 2032
- Figure 17: Europe Enterprise Service Bus Revenue Share (%), by Types 2024 & 2032
- Figure 18: Europe Enterprise Service Bus Revenue (million), by Country 2024 & 2032
- Figure 19: Europe Enterprise Service Bus Revenue Share (%), by Country 2024 & 2032
- Figure 20: Middle East & Africa Enterprise Service Bus Revenue (million), by Application 2024 & 2032
- Figure 21: Middle East & Africa Enterprise Service Bus Revenue Share (%), by Application 2024 & 2032
- Figure 22: Middle East & Africa Enterprise Service Bus Revenue (million), by Types 2024 & 2032
- Figure 23: Middle East & Africa Enterprise Service Bus Revenue Share (%), by Types 2024 & 2032
- Figure 24: Middle East & Africa Enterprise Service Bus Revenue (million), by Country 2024 & 2032
- Figure 25: Middle East & Africa Enterprise Service Bus Revenue Share (%), by Country 2024 & 2032
- Figure 26: Asia Pacific Enterprise Service Bus Revenue (million), by Application 2024 & 2032
- Figure 27: Asia Pacific Enterprise Service Bus Revenue Share (%), by Application 2024 & 2032
- Figure 28: Asia Pacific Enterprise Service Bus Revenue (million), by Types 2024 & 2032
- Figure 29: Asia Pacific Enterprise Service Bus Revenue Share (%), by Types 2024 & 2032
- Figure 30: Asia Pacific Enterprise Service Bus Revenue (million), by Country 2024 & 2032
- Figure 31: Asia Pacific Enterprise Service Bus Revenue Share (%), by Country 2024 & 2032
List of Tables
- Table 1: Global Enterprise Service Bus Revenue million Forecast, by Region 2019 & 2032
- Table 2: Global Enterprise Service Bus Revenue million Forecast, by Application 2019 & 2032
- Table 3: Global Enterprise Service Bus Revenue million Forecast, by Types 2019 & 2032
- Table 4: Global Enterprise Service Bus Revenue million Forecast, by Region 2019 & 2032
- Table 5: Global Enterprise Service Bus Revenue million Forecast, by Application 2019 & 2032
- Table 6: Global Enterprise Service Bus Revenue million Forecast, by Types 2019 & 2032
- Table 7: Global Enterprise Service Bus Revenue million Forecast, by Country 2019 & 2032
- Table 8: United States Enterprise Service Bus Revenue (million) Forecast, by Application 2019 & 2032
- Table 9: Canada Enterprise Service Bus Revenue (million) Forecast, by Application 2019 & 2032
- Table 10: Mexico Enterprise Service Bus Revenue (million) Forecast, by Application 2019 & 2032
- Table 11: Global Enterprise Service Bus Revenue million Forecast, by Application 2019 & 2032
- Table 12: Global Enterprise Service Bus Revenue million Forecast, by Types 2019 & 2032
- Table 13: Global Enterprise Service Bus Revenue million Forecast, by Country 2019 & 2032
- Table 14: Brazil Enterprise Service Bus Revenue (million) Forecast, by Application 2019 & 2032
- Table 15: Argentina Enterprise Service Bus Revenue (million) Forecast, by Application 2019 & 2032
- Table 16: Rest of South America Enterprise Service Bus Revenue (million) Forecast, by Application 2019 & 2032
- Table 17: Global Enterprise Service Bus Revenue million Forecast, by Application 2019 & 2032
- Table 18: Global Enterprise Service Bus Revenue million Forecast, by Types 2019 & 2032
- Table 19: Global Enterprise Service Bus Revenue million Forecast, by Country 2019 & 2032
- Table 20: United Kingdom Enterprise Service Bus Revenue (million) Forecast, by Application 2019 & 2032
- Table 21: Germany Enterprise Service Bus Revenue (million) Forecast, by Application 2019 & 2032
- Table 22: France Enterprise Service Bus Revenue (million) Forecast, by Application 2019 & 2032
- Table 23: Italy Enterprise Service Bus Revenue (million) Forecast, by Application 2019 & 2032
- Table 24: Spain Enterprise Service Bus Revenue (million) Forecast, by Application 2019 & 2032
- Table 25: Russia Enterprise Service Bus Revenue (million) Forecast, by Application 2019 & 2032
- Table 26: Benelux Enterprise Service Bus Revenue (million) Forecast, by Application 2019 & 2032
- Table 27: Nordics Enterprise Service Bus Revenue (million) Forecast, by Application 2019 & 2032
- Table 28: Rest of Europe Enterprise Service Bus Revenue (million) Forecast, by Application 2019 & 2032
- Table 29: Global Enterprise Service Bus Revenue million Forecast, by Application 2019 & 2032
- Table 30: Global Enterprise Service Bus Revenue million Forecast, by Types 2019 & 2032
- Table 31: Global Enterprise Service Bus Revenue million Forecast, by Country 2019 & 2032
- Table 32: Turkey Enterprise Service Bus Revenue (million) Forecast, by Application 2019 & 2032
- Table 33: Israel Enterprise Service Bus Revenue (million) Forecast, by Application 2019 & 2032
- Table 34: GCC Enterprise Service Bus Revenue (million) Forecast, by Application 2019 & 2032
- Table 35: North Africa Enterprise Service Bus Revenue (million) Forecast, by Application 2019 & 2032
- Table 36: South Africa Enterprise Service Bus Revenue (million) Forecast, by Application 2019 & 2032
- Table 37: Rest of Middle East & Africa Enterprise Service Bus Revenue (million) Forecast, by Application 2019 & 2032
- Table 38: Global Enterprise Service Bus Revenue million Forecast, by Application 2019 & 2032
- Table 39: Global Enterprise Service Bus Revenue million Forecast, by Types 2019 & 2032
- Table 40: Global Enterprise Service Bus Revenue million Forecast, by Country 2019 & 2032
- Table 41: China Enterprise Service Bus Revenue (million) Forecast, by Application 2019 & 2032
- Table 42: India Enterprise Service Bus Revenue (million) Forecast, by Application 2019 & 2032
- Table 43: Japan Enterprise Service Bus Revenue (million) Forecast, by Application 2019 & 2032
- Table 44: South Korea Enterprise Service Bus Revenue (million) Forecast, by Application 2019 & 2032
- Table 45: ASEAN Enterprise Service Bus Revenue (million) Forecast, by Application 2019 & 2032
- Table 46: Oceania Enterprise Service Bus Revenue (million) Forecast, by Application 2019 & 2032
- Table 47: Rest of Asia Pacific Enterprise Service Bus Revenue (million) Forecast, by Application 2019 & 2032
Frequently Asked Questions
1. What is the projected Compound Annual Growth Rate (CAGR) of the Enterprise Service Bus?
The projected CAGR is approximately 5.2%.
2. Which companies are prominent players in the Enterprise Service Bus?
Key companies in the market include International Business Machines (IBM), Oracle, Software, SAP, MuelSoft.
3. What are the main segments of the Enterprise Service Bus?
The market segments include Application, Types.
4. Can you provide details about the market size?
The market size is estimated to be USD 892.5 million as of 2022.
5. What are some drivers contributing to market growth?
N/A
6. What are the notable trends driving market growth?
N/A
7. Are there any restraints impacting market growth?
N/A
8. Can you provide examples of recent developments in the market?
N/A
9. What pricing options are available for accessing the report?
Pricing options include single-user, multi-user, and enterprise licenses priced at USD 4900.00, USD 7350.00, and USD 9800.00 respectively.
10. Is the market size provided in terms of value or volume?
The market size is provided in terms of value, measured in million.
11. Are there any specific market keywords associated with the report?
Yes, the market keyword associated with the report is "Enterprise Service Bus," which aids in identifying and referencing the specific market segment covered.
12. How do I determine which pricing option suits my needs best?
The pricing options vary based on user requirements and access needs. Individual users may opt for single-user licenses, while businesses requiring broader access may choose multi-user or enterprise licenses for cost-effective access to the report.
13. Are there any additional resources or data provided in the Enterprise Service Bus report?
While the report offers comprehensive insights, it's advisable to review the specific contents or supplementary materials provided to ascertain if additional resources or data are available.
14. How can I stay updated on further developments or reports in the Enterprise Service Bus?
To stay informed about further developments, trends, and reports in the Enterprise Service Bus, consider subscribing to industry newsletters, following relevant companies and organizations, or regularly checking reputable industry news sources and publications.
Methodology
Step 1 - Identification of Relevant Samples Size from Population Database


Step 2 - Approaches for Defining Global Market Size (Value, Volume* & Price*)

Note*: In applicable scenarios
Step 3 - Data Sources
Primary Research
- Web Analytics
- Survey Reports
- Research Institute
- Latest Research Reports
- Opinion Leaders
Secondary Research
- Annual Reports
- White Paper
- Latest Press Release
- Industry Association
- Paid Database
- Investor Presentations

Step 4 - Data Triangulation
Involves using different sources of information in order to increase the validity of a study
These sources are likely to be stakeholders in a program - participants, other researchers, program staff, other community members, and so on.
Then we put all data in single framework & apply various statistical tools to find out the dynamic on the market.
During the analysis stage, feedback from the stakeholder groups would be compared to determine areas of agreement as well as areas of divergence
