

Key Insights
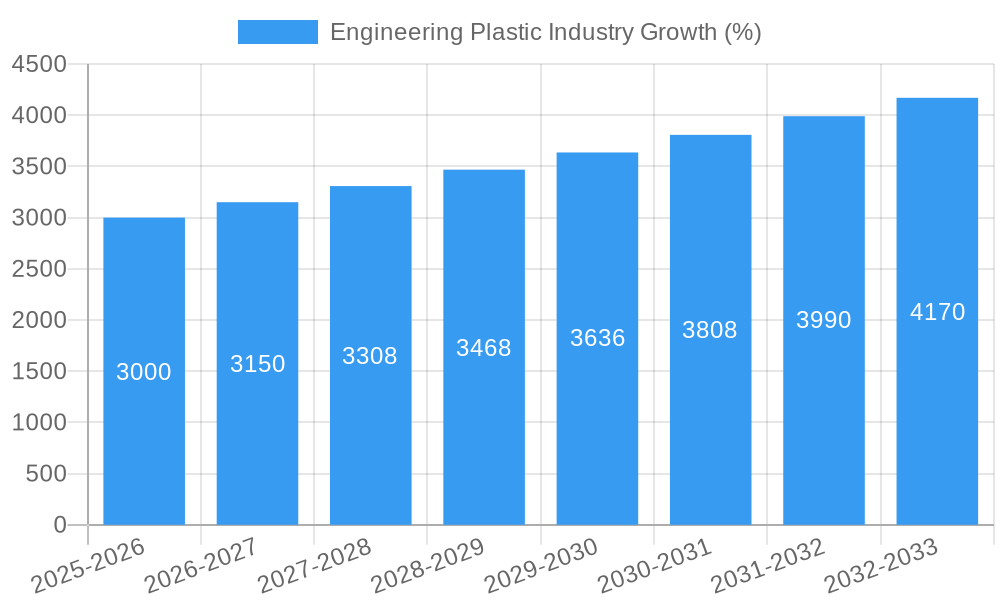
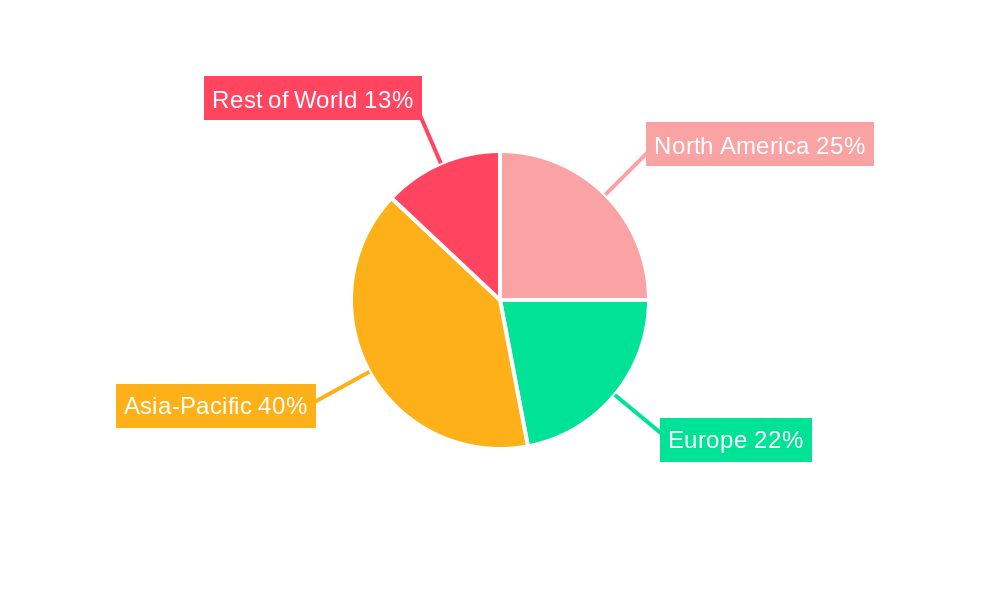
The engineering plastics market is experiencing robust growth, driven by increasing demand across diverse sectors such as automotive, electronics, and healthcare. The market's expansion is fueled by several key factors: the rising adoption of lightweight materials to enhance fuel efficiency in vehicles, the miniaturization of electronic components requiring high-performance plastics, and the growing need for durable and biocompatible materials in medical devices. Technological advancements in polymer science are continuously leading to the development of new engineering plastics with enhanced properties like higher strength-to-weight ratios, improved heat resistance, and better chemical resistance, further stimulating market growth. While fluctuating raw material prices and concerns about environmental impact pose challenges, the market is expected to maintain a healthy Compound Annual Growth Rate (CAGR) of approximately 5% between 2025 and 2033, reaching an estimated market size of $80 billion by 2033. This growth is anticipated to be driven primarily by the Asia-Pacific region, fueled by increasing industrialization and rising disposable incomes.
Segmentation within the engineering plastics market is significant, with key players focusing on specific niche applications. The market is dominated by established players such as BASF, DuPont, and SABIC, who leverage their strong research and development capabilities and extensive global distribution networks. However, the emergence of new entrants with innovative products and competitive pricing is likely to intensify competition in the coming years. The focus on sustainable and bio-based engineering plastics is gaining momentum as environmental concerns are becoming increasingly important for both manufacturers and consumers, further shaping the future of this dynamic market. To maintain a competitive edge, companies will need to focus on innovation, cost optimization, and sustainable manufacturing practices.
Engineering Plastics Industry Market Report: 2019-2033
This comprehensive report provides an in-depth analysis of the Engineering Plastics Industry, offering invaluable insights for stakeholders seeking to navigate this dynamic market. The report covers the period from 2019 to 2033, with a focus on the 2025-2033 forecast period. The study reveals key trends, growth drivers, challenges, and opportunities within this multi-billion dollar market. This report is crucial for strategic planning, investment decisions, and understanding competitive dynamics within the Engineering Plastics sector. The global market is projected to reach xx Million by 2033.
Engineering Plastic Industry Market Composition & Trends
The Engineering Plastics market exhibits a moderately concentrated landscape, with key players like BASF SE, SABIC, and Covestro AG holding significant market share. The combined market share of the top 5 players is estimated at xx%. Innovation is a key catalyst, driven by the increasing demand for high-performance materials across diverse sectors. Stringent regulatory frameworks, particularly concerning environmental impact and material safety, significantly influence market dynamics. Substitute materials, like advanced composites, present a competitive challenge, although Engineering Plastics maintain a strong position due to superior properties in specific applications. End-users are diverse, encompassing automotive, electronics, healthcare, and packaging industries. M&A activity has been moderate in recent years, with deal values averaging xx Million per transaction (2019-2024).
- Market Concentration: Top 5 players hold xx% market share.
- Innovation Catalysts: Focus on high-performance materials, sustainability, and regulatory compliance.
- Regulatory Landscape: Stringent environmental and safety regulations drive innovation and impact material selection.
- Substitute Products: Competition from advanced composites; however, engineering plastics retain dominance in key applications.
- End-User Profiles: Automotive, electronics, healthcare, and packaging industries are key consumers.
- M&A Activities: Average deal value of xx Million per transaction (2019-2024).
Engineering Plastic Industry Industry Evolution
The Engineering Plastics industry has experienced steady growth over the historical period (2019-2024), with a Compound Annual Growth Rate (CAGR) of xx%. This growth is projected to continue into the forecast period (2025-2033), albeit at a slightly moderated pace, reaching a projected CAGR of xx%. Technological advancements, particularly in material science and additive manufacturing, are key drivers of this expansion. Consumer demand for lightweight, durable, and sustainable materials is further fueling market growth. The adoption rate of advanced engineering plastics in high-growth sectors like electric vehicles and medical devices is significantly increasing, with penetration rates expected to surpass xx% by 2033. Specific advancements in polymers, such as PEEK and polycarbonate blends, are driving increased adoption in demanding applications.
Leading Regions, Countries, or Segments in Engineering Plastic Industry
Asia-Pacific holds the dominant position in the global Engineering Plastics market, driven by robust economic growth, substantial manufacturing activities, and a burgeoning automotive industry. China, in particular, represents a significant market, accounting for xx% of global demand.
- Key Drivers in Asia-Pacific:
- High manufacturing output and industrialization.
- Expanding automotive and electronics sectors.
- Significant government investments in infrastructure development.
- Dominance Factors:
- Large and growing consumer base.
- Cost-competitive manufacturing base.
- Increasing adoption of advanced technologies.
Engineering Plastic Industry Product Innovations
Recent innovations focus on high-performance materials with enhanced properties like improved strength-to-weight ratio, chemical resistance, and biocompatibility. Victrex PLC's new implantable PEEK-OPTIMA polymer for medical device manufacturing and Covestro AG's Makrolon 3638 polycarbonate for healthcare applications exemplify this trend. These advancements open new avenues for application across diverse industries, strengthening the competitive advantage of engineering plastics.
Propelling Factors for Engineering Plastic Industry Growth
Technological advancements in material science and processing techniques are driving industry growth. Rising demand from key end-use sectors like automotive (lightweighting initiatives), electronics (high-performance components), and healthcare (implantable devices) fuels market expansion. Favorable government policies and regulations promoting sustainable materials further boost market growth. The increasing adoption of additive manufacturing technologies also significantly impacts the market.
Obstacles in the Engineering Plastic Industry Market
Fluctuations in raw material prices, particularly for petroleum-based feedstocks, pose significant challenges. Supply chain disruptions, exacerbated by geopolitical factors, can impact production and availability. Intense competition from substitute materials and the pressure to adopt more sustainable manufacturing processes also present challenges. The global market is estimated to have faced a xx% reduction in production due to supply chain bottlenecks in 2022.
Future Opportunities in Engineering Plastic Industry
The increasing demand for sustainable and recyclable engineering plastics presents significant growth opportunities. Expansion into emerging markets in Africa and South America offers untapped potential. The growing adoption of advanced manufacturing technologies like 3D printing and the development of bio-based engineering plastics are further opportunities for growth. Focus on creating more sustainable and environmentally friendly materials is projected to create a market worth xx Million by 2033.
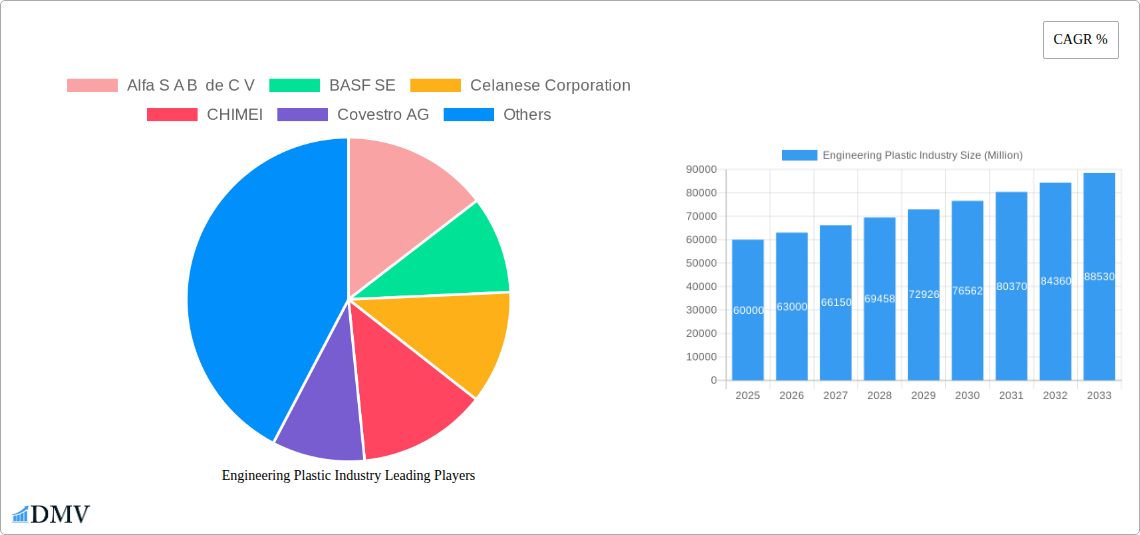
Major Players in the Engineering Plastic Industry Ecosystem
- Alfa S A B de C V
- BASF SE
- Celanese Corporation
- CHIMEI
- Covestro AG
- Dongyue Group
- DuPont
- Far Eastern New Century Corporation
- Indorama Ventures Public Company Limited
- LG Chem
- Mitsubishi Chemical Corporation
- SABIC
- Solvay
- Toray Industries Inc
- Victrex
Key Developments in Engineering Plastic Industry Industry
- February 2023: Victrex PLC announced plans to expand its medical division, Invibio Biomaterial Solutions, including a new product development facility in Leeds, UK. This signifies a major investment in the medical applications of engineering plastics.
- February 2023: Covestro AG launched Makrolon 3638 polycarbonate, targeting healthcare and life sciences applications. This expands the applications of polycarbonate in high-growth sectors.
- March 2023: Victrex PLC introduced a new implantable PEEK-OPTIMA polymer for medical device additive manufacturing (FDM and FFF). This innovation significantly impacts the medical device manufacturing landscape.
Strategic Engineering Plastic Industry Market Forecast
The Engineering Plastics market is poised for continued growth, driven by technological advancements, increasing demand from key end-use sectors, and a focus on sustainability. Emerging opportunities in high-growth sectors like electric vehicles, renewable energy, and medical devices will fuel market expansion. The market's robust growth trajectory, supported by innovation and increased adoption in diverse applications, ensures significant market potential in the coming years.
Engineering Plastic Industry Segmentation
-
1. End User Industry
- 1.1. Aerospace
- 1.2. Automotive
- 1.3. Building and Construction
- 1.4. Electrical and Electronics
- 1.5. Industrial and Machinery
- 1.6. Packaging
- 1.7. Other End-user Industries
-
2. Resin Type
-
2.1. Fluoropolymer
-
2.1.1. By Sub Resin Type
- 2.1.1.1. Ethylenetetrafluoroethylene (ETFE)
- 2.1.1.2. Fluorinated Ethylene-propylene (FEP)
- 2.1.1.3. Polytetrafluoroethylene (PTFE)
- 2.1.1.4. Polyvinylfluoride (PVF)
- 2.1.1.5. Polyvinylidene Fluoride (PVDF)
- 2.1.1.6. Other Sub Resin Types
-
2.1.1. By Sub Resin Type
- 2.2. Liquid Crystal Polymer (LCP)
-
2.3. Polyamide (PA)
- 2.3.1. Aramid
- 2.3.2. Polyamide (PA) 6
- 2.3.3. Polyamide (PA) 66
- 2.3.4. Polyphthalamide
- 2.4. Polybutylene Terephthalate (PBT)
- 2.5. Polycarbonate (PC)
- 2.6. Polyether Ether Ketone (PEEK)
- 2.7. Polyethylene Terephthalate (PET)
- 2.8. Polyimide (PI)
- 2.9. Polymethyl Methacrylate (PMMA)
- 2.10. Polyoxymethylene (POM)
- 2.11. Styrene Copolymers (ABS and SAN)
-
2.1. Fluoropolymer
Engineering Plastic Industry Segmentation By Geography
-
1. North America
- 1.1. United States
- 1.2. Canada
- 1.3. Mexico
-
2. South America
- 2.1. Brazil
- 2.2. Argentina
- 2.3. Rest of South America
-
3. Europe
- 3.1. United Kingdom
- 3.2. Germany
- 3.3. France
- 3.4. Italy
- 3.5. Spain
- 3.6. Russia
- 3.7. Benelux
- 3.8. Nordics
- 3.9. Rest of Europe
-
4. Middle East & Africa
- 4.1. Turkey
- 4.2. Israel
- 4.3. GCC
- 4.4. North Africa
- 4.5. South Africa
- 4.6. Rest of Middle East & Africa
-
5. Asia Pacific
- 5.1. China
- 5.2. India
- 5.3. Japan
- 5.4. South Korea
- 5.5. ASEAN
- 5.6. Oceania
- 5.7. Rest of Asia Pacific
Engineering Plastic Industry REPORT HIGHLIGHTS
| Aspects | Details |
|---|---|
| Study Period | 2019-2033 |
| Base Year | 2024 |
| Estimated Year | 2025 |
| Forecast Period | 2025-2033 |
| Historical Period | 2019-2024 |
| Growth Rate | CAGR of % from 2019-2033 |
| Segmentation |
|
Table of Contents
- 1. Introduction
- 1.1. Research Scope
- 1.2. Market Segmentation
- 1.3. Research Methodology
- 1.4. Definitions and Assumptions
- 2. Executive Summary
- 2.1. Introduction
- 3. Market Dynamics
- 3.1. Introduction
- 3.2. Market Drivers
- 3.3. Market Restrains
- 3.4. Market Trends
- 3.4.1. OTHER KEY INDUSTRY TRENDS COVERED IN THE REPORT
- 4. Market Factor Analysis
- 4.1. Porters Five Forces
- 4.2. Supply/Value Chain
- 4.3. PESTEL analysis
- 4.4. Market Entropy
- 4.5. Patent/Trademark Analysis
- 5. Global Engineering Plastic Industry Analysis, Insights and Forecast, 2019-2031
- 5.1. Market Analysis, Insights and Forecast - by End User Industry
- 5.1.1. Aerospace
- 5.1.2. Automotive
- 5.1.3. Building and Construction
- 5.1.4. Electrical and Electronics
- 5.1.5. Industrial and Machinery
- 5.1.6. Packaging
- 5.1.7. Other End-user Industries
- 5.2. Market Analysis, Insights and Forecast - by Resin Type
- 5.2.1. Fluoropolymer
- 5.2.1.1. By Sub Resin Type
- 5.2.1.1.1. Ethylenetetrafluoroethylene (ETFE)
- 5.2.1.1.2. Fluorinated Ethylene-propylene (FEP)
- 5.2.1.1.3. Polytetrafluoroethylene (PTFE)
- 5.2.1.1.4. Polyvinylfluoride (PVF)
- 5.2.1.1.5. Polyvinylidene Fluoride (PVDF)
- 5.2.1.1.6. Other Sub Resin Types
- 5.2.1.1. By Sub Resin Type
- 5.2.2. Liquid Crystal Polymer (LCP)
- 5.2.3. Polyamide (PA)
- 5.2.3.1. Aramid
- 5.2.3.2. Polyamide (PA) 6
- 5.2.3.3. Polyamide (PA) 66
- 5.2.3.4. Polyphthalamide
- 5.2.4. Polybutylene Terephthalate (PBT)
- 5.2.5. Polycarbonate (PC)
- 5.2.6. Polyether Ether Ketone (PEEK)
- 5.2.7. Polyethylene Terephthalate (PET)
- 5.2.8. Polyimide (PI)
- 5.2.9. Polymethyl Methacrylate (PMMA)
- 5.2.10. Polyoxymethylene (POM)
- 5.2.11. Styrene Copolymers (ABS and SAN)
- 5.2.1. Fluoropolymer
- 5.3. Market Analysis, Insights and Forecast - by Region
- 5.3.1. North America
- 5.3.2. South America
- 5.3.3. Europe
- 5.3.4. Middle East & Africa
- 5.3.5. Asia Pacific
- 5.1. Market Analysis, Insights and Forecast - by End User Industry
- 6. North America Engineering Plastic Industry Analysis, Insights and Forecast, 2019-2031
- 6.1. Market Analysis, Insights and Forecast - by End User Industry
- 6.1.1. Aerospace
- 6.1.2. Automotive
- 6.1.3. Building and Construction
- 6.1.4. Electrical and Electronics
- 6.1.5. Industrial and Machinery
- 6.1.6. Packaging
- 6.1.7. Other End-user Industries
- 6.2. Market Analysis, Insights and Forecast - by Resin Type
- 6.2.1. Fluoropolymer
- 6.2.1.1. By Sub Resin Type
- 6.2.1.1.1. Ethylenetetrafluoroethylene (ETFE)
- 6.2.1.1.2. Fluorinated Ethylene-propylene (FEP)
- 6.2.1.1.3. Polytetrafluoroethylene (PTFE)
- 6.2.1.1.4. Polyvinylfluoride (PVF)
- 6.2.1.1.5. Polyvinylidene Fluoride (PVDF)
- 6.2.1.1.6. Other Sub Resin Types
- 6.2.1.1. By Sub Resin Type
- 6.2.2. Liquid Crystal Polymer (LCP)
- 6.2.3. Polyamide (PA)
- 6.2.3.1. Aramid
- 6.2.3.2. Polyamide (PA) 6
- 6.2.3.3. Polyamide (PA) 66
- 6.2.3.4. Polyphthalamide
- 6.2.4. Polybutylene Terephthalate (PBT)
- 6.2.5. Polycarbonate (PC)
- 6.2.6. Polyether Ether Ketone (PEEK)
- 6.2.7. Polyethylene Terephthalate (PET)
- 6.2.8. Polyimide (PI)
- 6.2.9. Polymethyl Methacrylate (PMMA)
- 6.2.10. Polyoxymethylene (POM)
- 6.2.11. Styrene Copolymers (ABS and SAN)
- 6.2.1. Fluoropolymer
- 6.1. Market Analysis, Insights and Forecast - by End User Industry
- 7. South America Engineering Plastic Industry Analysis, Insights and Forecast, 2019-2031
- 7.1. Market Analysis, Insights and Forecast - by End User Industry
- 7.1.1. Aerospace
- 7.1.2. Automotive
- 7.1.3. Building and Construction
- 7.1.4. Electrical and Electronics
- 7.1.5. Industrial and Machinery
- 7.1.6. Packaging
- 7.1.7. Other End-user Industries
- 7.2. Market Analysis, Insights and Forecast - by Resin Type
- 7.2.1. Fluoropolymer
- 7.2.1.1. By Sub Resin Type
- 7.2.1.1.1. Ethylenetetrafluoroethylene (ETFE)
- 7.2.1.1.2. Fluorinated Ethylene-propylene (FEP)
- 7.2.1.1.3. Polytetrafluoroethylene (PTFE)
- 7.2.1.1.4. Polyvinylfluoride (PVF)
- 7.2.1.1.5. Polyvinylidene Fluoride (PVDF)
- 7.2.1.1.6. Other Sub Resin Types
- 7.2.1.1. By Sub Resin Type
- 7.2.2. Liquid Crystal Polymer (LCP)
- 7.2.3. Polyamide (PA)
- 7.2.3.1. Aramid
- 7.2.3.2. Polyamide (PA) 6
- 7.2.3.3. Polyamide (PA) 66
- 7.2.3.4. Polyphthalamide
- 7.2.4. Polybutylene Terephthalate (PBT)
- 7.2.5. Polycarbonate (PC)
- 7.2.6. Polyether Ether Ketone (PEEK)
- 7.2.7. Polyethylene Terephthalate (PET)
- 7.2.8. Polyimide (PI)
- 7.2.9. Polymethyl Methacrylate (PMMA)
- 7.2.10. Polyoxymethylene (POM)
- 7.2.11. Styrene Copolymers (ABS and SAN)
- 7.2.1. Fluoropolymer
- 7.1. Market Analysis, Insights and Forecast - by End User Industry
- 8. Europe Engineering Plastic Industry Analysis, Insights and Forecast, 2019-2031
- 8.1. Market Analysis, Insights and Forecast - by End User Industry
- 8.1.1. Aerospace
- 8.1.2. Automotive
- 8.1.3. Building and Construction
- 8.1.4. Electrical and Electronics
- 8.1.5. Industrial and Machinery
- 8.1.6. Packaging
- 8.1.7. Other End-user Industries
- 8.2. Market Analysis, Insights and Forecast - by Resin Type
- 8.2.1. Fluoropolymer
- 8.2.1.1. By Sub Resin Type
- 8.2.1.1.1. Ethylenetetrafluoroethylene (ETFE)
- 8.2.1.1.2. Fluorinated Ethylene-propylene (FEP)
- 8.2.1.1.3. Polytetrafluoroethylene (PTFE)
- 8.2.1.1.4. Polyvinylfluoride (PVF)
- 8.2.1.1.5. Polyvinylidene Fluoride (PVDF)
- 8.2.1.1.6. Other Sub Resin Types
- 8.2.1.1. By Sub Resin Type
- 8.2.2. Liquid Crystal Polymer (LCP)
- 8.2.3. Polyamide (PA)
- 8.2.3.1. Aramid
- 8.2.3.2. Polyamide (PA) 6
- 8.2.3.3. Polyamide (PA) 66
- 8.2.3.4. Polyphthalamide
- 8.2.4. Polybutylene Terephthalate (PBT)
- 8.2.5. Polycarbonate (PC)
- 8.2.6. Polyether Ether Ketone (PEEK)
- 8.2.7. Polyethylene Terephthalate (PET)
- 8.2.8. Polyimide (PI)
- 8.2.9. Polymethyl Methacrylate (PMMA)
- 8.2.10. Polyoxymethylene (POM)
- 8.2.11. Styrene Copolymers (ABS and SAN)
- 8.2.1. Fluoropolymer
- 8.1. Market Analysis, Insights and Forecast - by End User Industry
- 9. Middle East & Africa Engineering Plastic Industry Analysis, Insights and Forecast, 2019-2031
- 9.1. Market Analysis, Insights and Forecast - by End User Industry
- 9.1.1. Aerospace
- 9.1.2. Automotive
- 9.1.3. Building and Construction
- 9.1.4. Electrical and Electronics
- 9.1.5. Industrial and Machinery
- 9.1.6. Packaging
- 9.1.7. Other End-user Industries
- 9.2. Market Analysis, Insights and Forecast - by Resin Type
- 9.2.1. Fluoropolymer
- 9.2.1.1. By Sub Resin Type
- 9.2.1.1.1. Ethylenetetrafluoroethylene (ETFE)
- 9.2.1.1.2. Fluorinated Ethylene-propylene (FEP)
- 9.2.1.1.3. Polytetrafluoroethylene (PTFE)
- 9.2.1.1.4. Polyvinylfluoride (PVF)
- 9.2.1.1.5. Polyvinylidene Fluoride (PVDF)
- 9.2.1.1.6. Other Sub Resin Types
- 9.2.1.1. By Sub Resin Type
- 9.2.2. Liquid Crystal Polymer (LCP)
- 9.2.3. Polyamide (PA)
- 9.2.3.1. Aramid
- 9.2.3.2. Polyamide (PA) 6
- 9.2.3.3. Polyamide (PA) 66
- 9.2.3.4. Polyphthalamide
- 9.2.4. Polybutylene Terephthalate (PBT)
- 9.2.5. Polycarbonate (PC)
- 9.2.6. Polyether Ether Ketone (PEEK)
- 9.2.7. Polyethylene Terephthalate (PET)
- 9.2.8. Polyimide (PI)
- 9.2.9. Polymethyl Methacrylate (PMMA)
- 9.2.10. Polyoxymethylene (POM)
- 9.2.11. Styrene Copolymers (ABS and SAN)
- 9.2.1. Fluoropolymer
- 9.1. Market Analysis, Insights and Forecast - by End User Industry
- 10. Asia Pacific Engineering Plastic Industry Analysis, Insights and Forecast, 2019-2031
- 10.1. Market Analysis, Insights and Forecast - by End User Industry
- 10.1.1. Aerospace
- 10.1.2. Automotive
- 10.1.3. Building and Construction
- 10.1.4. Electrical and Electronics
- 10.1.5. Industrial and Machinery
- 10.1.6. Packaging
- 10.1.7. Other End-user Industries
- 10.2. Market Analysis, Insights and Forecast - by Resin Type
- 10.2.1. Fluoropolymer
- 10.2.1.1. By Sub Resin Type
- 10.2.1.1.1. Ethylenetetrafluoroethylene (ETFE)
- 10.2.1.1.2. Fluorinated Ethylene-propylene (FEP)
- 10.2.1.1.3. Polytetrafluoroethylene (PTFE)
- 10.2.1.1.4. Polyvinylfluoride (PVF)
- 10.2.1.1.5. Polyvinylidene Fluoride (PVDF)
- 10.2.1.1.6. Other Sub Resin Types
- 10.2.1.1. By Sub Resin Type
- 10.2.2. Liquid Crystal Polymer (LCP)
- 10.2.3. Polyamide (PA)
- 10.2.3.1. Aramid
- 10.2.3.2. Polyamide (PA) 6
- 10.2.3.3. Polyamide (PA) 66
- 10.2.3.4. Polyphthalamide
- 10.2.4. Polybutylene Terephthalate (PBT)
- 10.2.5. Polycarbonate (PC)
- 10.2.6. Polyether Ether Ketone (PEEK)
- 10.2.7. Polyethylene Terephthalate (PET)
- 10.2.8. Polyimide (PI)
- 10.2.9. Polymethyl Methacrylate (PMMA)
- 10.2.10. Polyoxymethylene (POM)
- 10.2.11. Styrene Copolymers (ABS and SAN)
- 10.2.1. Fluoropolymer
- 10.1. Market Analysis, Insights and Forecast - by End User Industry
- 11. Competitive Analysis
- 11.1. Global Market Share Analysis 2024
- 11.2. Company Profiles
- 11.2.1 Alfa S A B de C V
- 11.2.1.1. Overview
- 11.2.1.2. Products
- 11.2.1.3. SWOT Analysis
- 11.2.1.4. Recent Developments
- 11.2.1.5. Financials (Based on Availability)
- 11.2.2 BASF SE
- 11.2.2.1. Overview
- 11.2.2.2. Products
- 11.2.2.3. SWOT Analysis
- 11.2.2.4. Recent Developments
- 11.2.2.5. Financials (Based on Availability)
- 11.2.3 Celanese Corporation
- 11.2.3.1. Overview
- 11.2.3.2. Products
- 11.2.3.3. SWOT Analysis
- 11.2.3.4. Recent Developments
- 11.2.3.5. Financials (Based on Availability)
- 11.2.4 CHIMEI
- 11.2.4.1. Overview
- 11.2.4.2. Products
- 11.2.4.3. SWOT Analysis
- 11.2.4.4. Recent Developments
- 11.2.4.5. Financials (Based on Availability)
- 11.2.5 Covestro AG
- 11.2.5.1. Overview
- 11.2.5.2. Products
- 11.2.5.3. SWOT Analysis
- 11.2.5.4. Recent Developments
- 11.2.5.5. Financials (Based on Availability)
- 11.2.6 Dongyue Group
- 11.2.6.1. Overview
- 11.2.6.2. Products
- 11.2.6.3. SWOT Analysis
- 11.2.6.4. Recent Developments
- 11.2.6.5. Financials (Based on Availability)
- 11.2.7 DuPont
- 11.2.7.1. Overview
- 11.2.7.2. Products
- 11.2.7.3. SWOT Analysis
- 11.2.7.4. Recent Developments
- 11.2.7.5. Financials (Based on Availability)
- 11.2.8 Far Eastern New Century Corporation
- 11.2.8.1. Overview
- 11.2.8.2. Products
- 11.2.8.3. SWOT Analysis
- 11.2.8.4. Recent Developments
- 11.2.8.5. Financials (Based on Availability)
- 11.2.9 Indorama Ventures Public Company Limited
- 11.2.9.1. Overview
- 11.2.9.2. Products
- 11.2.9.3. SWOT Analysis
- 11.2.9.4. Recent Developments
- 11.2.9.5. Financials (Based on Availability)
- 11.2.10 LG Chem
- 11.2.10.1. Overview
- 11.2.10.2. Products
- 11.2.10.3. SWOT Analysis
- 11.2.10.4. Recent Developments
- 11.2.10.5. Financials (Based on Availability)
- 11.2.11 Mitsubishi Chemical Corporation
- 11.2.11.1. Overview
- 11.2.11.2. Products
- 11.2.11.3. SWOT Analysis
- 11.2.11.4. Recent Developments
- 11.2.11.5. Financials (Based on Availability)
- 11.2.12 SABIC
- 11.2.12.1. Overview
- 11.2.12.2. Products
- 11.2.12.3. SWOT Analysis
- 11.2.12.4. Recent Developments
- 11.2.12.5. Financials (Based on Availability)
- 11.2.13 Solvay
- 11.2.13.1. Overview
- 11.2.13.2. Products
- 11.2.13.3. SWOT Analysis
- 11.2.13.4. Recent Developments
- 11.2.13.5. Financials (Based on Availability)
- 11.2.14 Toray Industries Inc
- 11.2.14.1. Overview
- 11.2.14.2. Products
- 11.2.14.3. SWOT Analysis
- 11.2.14.4. Recent Developments
- 11.2.14.5. Financials (Based on Availability)
- 11.2.15 Victre
- 11.2.15.1. Overview
- 11.2.15.2. Products
- 11.2.15.3. SWOT Analysis
- 11.2.15.4. Recent Developments
- 11.2.15.5. Financials (Based on Availability)
- 11.2.1 Alfa S A B de C V
List of Figures
- Figure 1: Global Engineering Plastic Industry Revenue Breakdown (Million, %) by Region 2024 & 2032
- Figure 2: North America Engineering Plastic Industry Revenue (Million), by End User Industry 2024 & 2032
- Figure 3: North America Engineering Plastic Industry Revenue Share (%), by End User Industry 2024 & 2032
- Figure 4: North America Engineering Plastic Industry Revenue (Million), by Resin Type 2024 & 2032
- Figure 5: North America Engineering Plastic Industry Revenue Share (%), by Resin Type 2024 & 2032
- Figure 6: North America Engineering Plastic Industry Revenue (Million), by Country 2024 & 2032
- Figure 7: North America Engineering Plastic Industry Revenue Share (%), by Country 2024 & 2032
- Figure 8: South America Engineering Plastic Industry Revenue (Million), by End User Industry 2024 & 2032
- Figure 9: South America Engineering Plastic Industry Revenue Share (%), by End User Industry 2024 & 2032
- Figure 10: South America Engineering Plastic Industry Revenue (Million), by Resin Type 2024 & 2032
- Figure 11: South America Engineering Plastic Industry Revenue Share (%), by Resin Type 2024 & 2032
- Figure 12: South America Engineering Plastic Industry Revenue (Million), by Country 2024 & 2032
- Figure 13: South America Engineering Plastic Industry Revenue Share (%), by Country 2024 & 2032
- Figure 14: Europe Engineering Plastic Industry Revenue (Million), by End User Industry 2024 & 2032
- Figure 15: Europe Engineering Plastic Industry Revenue Share (%), by End User Industry 2024 & 2032
- Figure 16: Europe Engineering Plastic Industry Revenue (Million), by Resin Type 2024 & 2032
- Figure 17: Europe Engineering Plastic Industry Revenue Share (%), by Resin Type 2024 & 2032
- Figure 18: Europe Engineering Plastic Industry Revenue (Million), by Country 2024 & 2032
- Figure 19: Europe Engineering Plastic Industry Revenue Share (%), by Country 2024 & 2032
- Figure 20: Middle East & Africa Engineering Plastic Industry Revenue (Million), by End User Industry 2024 & 2032
- Figure 21: Middle East & Africa Engineering Plastic Industry Revenue Share (%), by End User Industry 2024 & 2032
- Figure 22: Middle East & Africa Engineering Plastic Industry Revenue (Million), by Resin Type 2024 & 2032
- Figure 23: Middle East & Africa Engineering Plastic Industry Revenue Share (%), by Resin Type 2024 & 2032
- Figure 24: Middle East & Africa Engineering Plastic Industry Revenue (Million), by Country 2024 & 2032
- Figure 25: Middle East & Africa Engineering Plastic Industry Revenue Share (%), by Country 2024 & 2032
- Figure 26: Asia Pacific Engineering Plastic Industry Revenue (Million), by End User Industry 2024 & 2032
- Figure 27: Asia Pacific Engineering Plastic Industry Revenue Share (%), by End User Industry 2024 & 2032
- Figure 28: Asia Pacific Engineering Plastic Industry Revenue (Million), by Resin Type 2024 & 2032
- Figure 29: Asia Pacific Engineering Plastic Industry Revenue Share (%), by Resin Type 2024 & 2032
- Figure 30: Asia Pacific Engineering Plastic Industry Revenue (Million), by Country 2024 & 2032
- Figure 31: Asia Pacific Engineering Plastic Industry Revenue Share (%), by Country 2024 & 2032
List of Tables
- Table 1: Global Engineering Plastic Industry Revenue Million Forecast, by Region 2019 & 2032
- Table 2: Global Engineering Plastic Industry Revenue Million Forecast, by End User Industry 2019 & 2032
- Table 3: Global Engineering Plastic Industry Revenue Million Forecast, by Resin Type 2019 & 2032
- Table 4: Global Engineering Plastic Industry Revenue Million Forecast, by Region 2019 & 2032
- Table 5: Global Engineering Plastic Industry Revenue Million Forecast, by End User Industry 2019 & 2032
- Table 6: Global Engineering Plastic Industry Revenue Million Forecast, by Resin Type 2019 & 2032
- Table 7: Global Engineering Plastic Industry Revenue Million Forecast, by Country 2019 & 2032
- Table 8: United States Engineering Plastic Industry Revenue (Million) Forecast, by Application 2019 & 2032
- Table 9: Canada Engineering Plastic Industry Revenue (Million) Forecast, by Application 2019 & 2032
- Table 10: Mexico Engineering Plastic Industry Revenue (Million) Forecast, by Application 2019 & 2032
- Table 11: Global Engineering Plastic Industry Revenue Million Forecast, by End User Industry 2019 & 2032
- Table 12: Global Engineering Plastic Industry Revenue Million Forecast, by Resin Type 2019 & 2032
- Table 13: Global Engineering Plastic Industry Revenue Million Forecast, by Country 2019 & 2032
- Table 14: Brazil Engineering Plastic Industry Revenue (Million) Forecast, by Application 2019 & 2032
- Table 15: Argentina Engineering Plastic Industry Revenue (Million) Forecast, by Application 2019 & 2032
- Table 16: Rest of South America Engineering Plastic Industry Revenue (Million) Forecast, by Application 2019 & 2032
- Table 17: Global Engineering Plastic Industry Revenue Million Forecast, by End User Industry 2019 & 2032
- Table 18: Global Engineering Plastic Industry Revenue Million Forecast, by Resin Type 2019 & 2032
- Table 19: Global Engineering Plastic Industry Revenue Million Forecast, by Country 2019 & 2032
- Table 20: United Kingdom Engineering Plastic Industry Revenue (Million) Forecast, by Application 2019 & 2032
- Table 21: Germany Engineering Plastic Industry Revenue (Million) Forecast, by Application 2019 & 2032
- Table 22: France Engineering Plastic Industry Revenue (Million) Forecast, by Application 2019 & 2032
- Table 23: Italy Engineering Plastic Industry Revenue (Million) Forecast, by Application 2019 & 2032
- Table 24: Spain Engineering Plastic Industry Revenue (Million) Forecast, by Application 2019 & 2032
- Table 25: Russia Engineering Plastic Industry Revenue (Million) Forecast, by Application 2019 & 2032
- Table 26: Benelux Engineering Plastic Industry Revenue (Million) Forecast, by Application 2019 & 2032
- Table 27: Nordics Engineering Plastic Industry Revenue (Million) Forecast, by Application 2019 & 2032
- Table 28: Rest of Europe Engineering Plastic Industry Revenue (Million) Forecast, by Application 2019 & 2032
- Table 29: Global Engineering Plastic Industry Revenue Million Forecast, by End User Industry 2019 & 2032
- Table 30: Global Engineering Plastic Industry Revenue Million Forecast, by Resin Type 2019 & 2032
- Table 31: Global Engineering Plastic Industry Revenue Million Forecast, by Country 2019 & 2032
- Table 32: Turkey Engineering Plastic Industry Revenue (Million) Forecast, by Application 2019 & 2032
- Table 33: Israel Engineering Plastic Industry Revenue (Million) Forecast, by Application 2019 & 2032
- Table 34: GCC Engineering Plastic Industry Revenue (Million) Forecast, by Application 2019 & 2032
- Table 35: North Africa Engineering Plastic Industry Revenue (Million) Forecast, by Application 2019 & 2032
- Table 36: South Africa Engineering Plastic Industry Revenue (Million) Forecast, by Application 2019 & 2032
- Table 37: Rest of Middle East & Africa Engineering Plastic Industry Revenue (Million) Forecast, by Application 2019 & 2032
- Table 38: Global Engineering Plastic Industry Revenue Million Forecast, by End User Industry 2019 & 2032
- Table 39: Global Engineering Plastic Industry Revenue Million Forecast, by Resin Type 2019 & 2032
- Table 40: Global Engineering Plastic Industry Revenue Million Forecast, by Country 2019 & 2032
- Table 41: China Engineering Plastic Industry Revenue (Million) Forecast, by Application 2019 & 2032
- Table 42: India Engineering Plastic Industry Revenue (Million) Forecast, by Application 2019 & 2032
- Table 43: Japan Engineering Plastic Industry Revenue (Million) Forecast, by Application 2019 & 2032
- Table 44: South Korea Engineering Plastic Industry Revenue (Million) Forecast, by Application 2019 & 2032
- Table 45: ASEAN Engineering Plastic Industry Revenue (Million) Forecast, by Application 2019 & 2032
- Table 46: Oceania Engineering Plastic Industry Revenue (Million) Forecast, by Application 2019 & 2032
- Table 47: Rest of Asia Pacific Engineering Plastic Industry Revenue (Million) Forecast, by Application 2019 & 2032
Frequently Asked Questions
1. What is the projected Compound Annual Growth Rate (CAGR) of the Engineering Plastic Industry?
The projected CAGR is approximately N/A%.
2. Which companies are prominent players in the Engineering Plastic Industry?
Key companies in the market include Alfa S A B de C V, BASF SE, Celanese Corporation, CHIMEI, Covestro AG, Dongyue Group, DuPont, Far Eastern New Century Corporation, Indorama Ventures Public Company Limited, LG Chem, Mitsubishi Chemical Corporation, SABIC, Solvay, Toray Industries Inc, Victre.
3. What are the main segments of the Engineering Plastic Industry?
The market segments include End User Industry, Resin Type.
4. Can you provide details about the market size?
The market size is estimated to be USD XX Million as of 2022.
5. What are some drivers contributing to market growth?
N/A
6. What are the notable trends driving market growth?
OTHER KEY INDUSTRY TRENDS COVERED IN THE REPORT.
7. Are there any restraints impacting market growth?
N/A
8. Can you provide examples of recent developments in the market?
March 2023: Victrex PLC introduced a new type of implantable PEEK-OPTIMA polymer that is specifically designed for use in the manufacturing processes of medical device additives, such as fused deposition modeling (FDM) and fused filament fabrication (FFF).February 2023: Victrex PLC revealed its plans to invest in the expansion of its medical division, Invibio Biomaterial Solutions, which includes establishing a new product development facility in Leeds, United Kingdom.February 2023: Covestro AG introduced Makrolon 3638 polycarbonate for healthcare and life sciences applications such as drug delivery devices, wellness and wearable devices, and single-use containers for biopharmaceutical manufacturing.
9. What pricing options are available for accessing the report?
Pricing options include single-user, multi-user, and enterprise licenses priced at USD 3800, USD 4500, and USD 5800 respectively.
10. Is the market size provided in terms of value or volume?
The market size is provided in terms of value, measured in Million.
11. Are there any specific market keywords associated with the report?
Yes, the market keyword associated with the report is "Engineering Plastic Industry," which aids in identifying and referencing the specific market segment covered.
12. How do I determine which pricing option suits my needs best?
The pricing options vary based on user requirements and access needs. Individual users may opt for single-user licenses, while businesses requiring broader access may choose multi-user or enterprise licenses for cost-effective access to the report.
13. Are there any additional resources or data provided in the Engineering Plastic Industry report?
While the report offers comprehensive insights, it's advisable to review the specific contents or supplementary materials provided to ascertain if additional resources or data are available.
14. How can I stay updated on further developments or reports in the Engineering Plastic Industry?
To stay informed about further developments, trends, and reports in the Engineering Plastic Industry, consider subscribing to industry newsletters, following relevant companies and organizations, or regularly checking reputable industry news sources and publications.
Methodology
Step 1 - Identification of Relevant Samples Size from Population Database


Step 2 - Approaches for Defining Global Market Size (Value, Volume* & Price*)

Note*: In applicable scenarios
Step 3 - Data Sources
Primary Research
- Web Analytics
- Survey Reports
- Research Institute
- Latest Research Reports
- Opinion Leaders
Secondary Research
- Annual Reports
- White Paper
- Latest Press Release
- Industry Association
- Paid Database
- Investor Presentations

Step 4 - Data Triangulation
Involves using different sources of information in order to increase the validity of a study
These sources are likely to be stakeholders in a program - participants, other researchers, program staff, other community members, and so on.
Then we put all data in single framework & apply various statistical tools to find out the dynamic on the market.
During the analysis stage, feedback from the stakeholder groups would be compared to determine areas of agreement as well as areas of divergence
