

Key Insights
The engineered wood industry is experiencing robust growth, driven by several key factors. The increasing demand for sustainable and cost-effective building materials is a primary driver, as engineered wood products like plywood, oriented strand board (OSB), and laminated veneer lumber (LVL) offer superior performance and efficiency compared to traditional lumber. Furthermore, the construction industry's ongoing expansion, particularly in residential and commercial sectors globally, fuels significant demand. Stringent building codes emphasizing energy efficiency and durability also contribute to the adoption of engineered wood, given its superior strength-to-weight ratio and dimensional stability. Technological advancements in manufacturing processes are leading to improved product quality and reduced production costs, further bolstering market growth. However, fluctuations in raw material prices, particularly lumber and wood adhesives, pose a challenge to the industry. Additionally, environmental concerns regarding deforestation and sustainable sourcing practices require ongoing attention and investment in responsible forestry management. The market is segmented by product type (plywood, OSB, LVL, etc.), application (residential, commercial, industrial), and geography. Major players are investing heavily in research and development to introduce innovative products and expand their geographic reach. This includes focusing on high-performance engineered wood solutions tailored for specific applications and exploring sustainable sourcing initiatives.
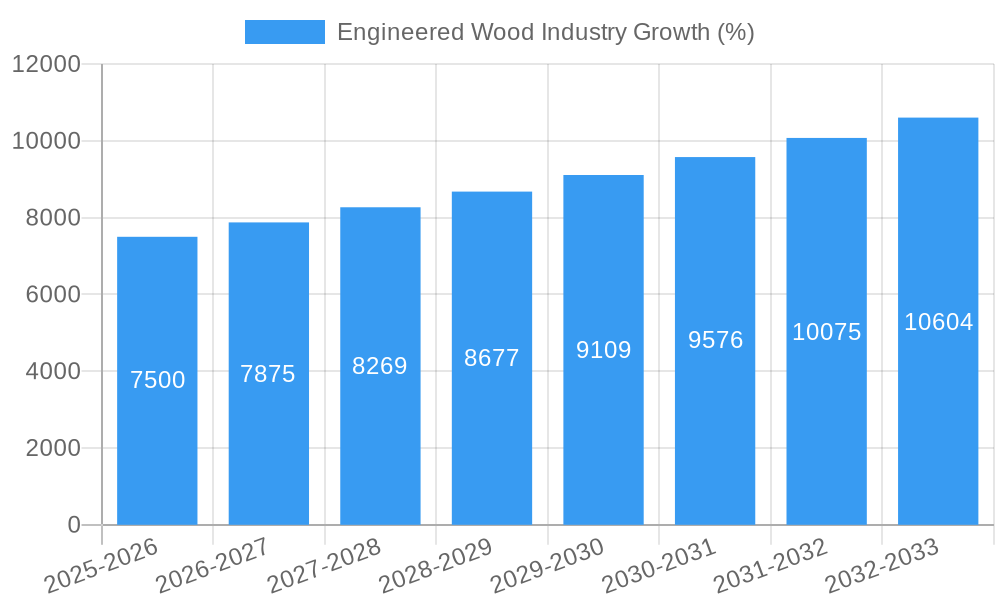
The projected Compound Annual Growth Rate (CAGR) of over 5% indicates a significant expansion in the engineered wood market through 2033. This growth will likely be unevenly distributed across regions, with North America and Europe expected to maintain substantial market shares due to established construction sectors and robust economies. However, rapidly developing economies in Asia-Pacific and other regions present significant opportunities for future expansion. The competitive landscape is characterized by both large multinational corporations and smaller regional players. The industry's future will depend on ongoing innovation, sustainable sourcing practices, and the ability to meet the evolving demands of the construction and related industries. Market consolidation through mergers and acquisitions is also anticipated as companies seek to gain scale and market share. Strategies focused on enhancing product quality, expanding distribution networks, and providing customized solutions will be crucial for achieving competitive advantage.
Engineered Wood Industry Market Report: 2019-2033
This comprehensive report provides a detailed analysis of the Engineered Wood Industry, offering invaluable insights for stakeholders seeking to navigate this dynamic market. The study period spans from 2019-2033, with 2025 serving as both the base and estimated year. The forecast period covers 2025-2033, while the historical period encompasses 2019-2024. This report projects a market valued at $XX Million in 2025, growing to $XX Million by 2033.
Engineered Wood Industry Market Composition & Trends
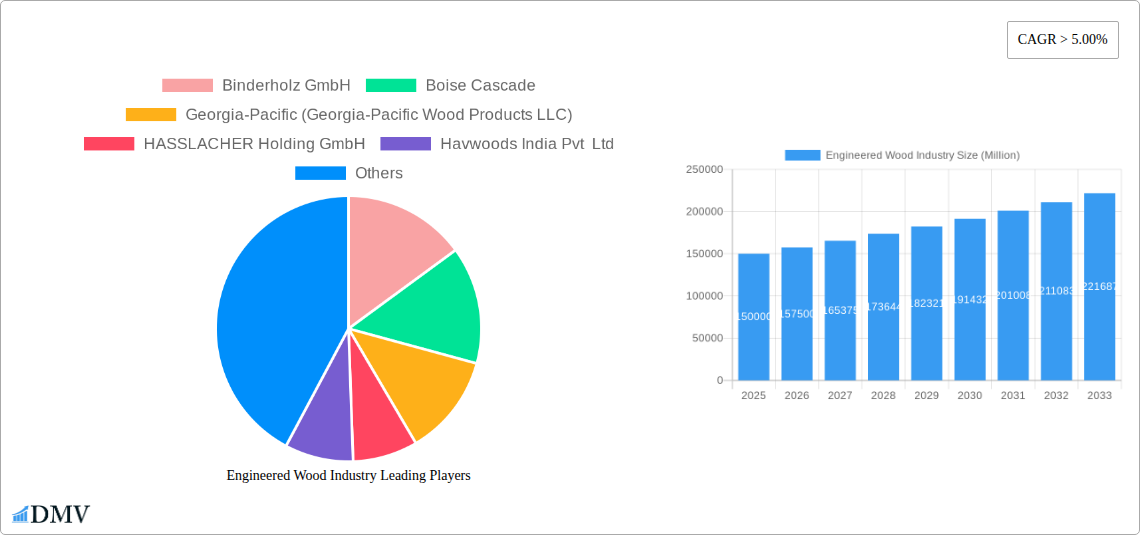
This section delves into the intricate structure of the engineered wood market, examining market concentration, innovation drivers, regulatory landscapes, substitute products, end-user profiles, and mergers and acquisitions (M&A) activity. We analyze market share distribution among key players like Boise Cascade, Georgia-Pacific, and Weyerhaeuser Company, revealing a moderately concentrated market with significant opportunities for growth and consolidation. The report also quantifies M&A deal values in the $XX Million range over the historical period.
- Market Concentration: The market exhibits a moderately consolidated structure with the top 5 players holding approximately XX% of the market share in 2024.
- Innovation Catalysts: Growing demand for sustainable building materials and advancements in wood processing technologies are driving innovation.
- Regulatory Landscape: Stringent environmental regulations are shaping industry practices and driving the adoption of sustainable wood products.
- Substitute Products: Competition from other building materials like concrete and steel is analyzed, along with their impact on market share.
- End-User Profiles: Detailed analysis of end-user segments, including residential construction, commercial construction, and industrial applications, is included.
- M&A Activity: The report documents major M&A activities with a total deal value of approximately $XX Million between 2019 and 2024. Key drivers of M&A are examined.
Engineered Wood Industry Industry Evolution
This section meticulously tracks the evolution of the engineered wood industry, analyzing market growth trajectories, technological advancements, and shifting consumer demands. It presents specific data points, including compound annual growth rates (CAGRs) and adoption rates for new technologies. The report highlights the increasing adoption of sustainable practices, the shift towards high-performance engineered wood products, and the influence of changing building codes and consumer preferences on market growth. The projected CAGR from 2025 to 2033 is approximately XX%. Key factors contributing to this growth include increasing urbanization, rising infrastructure spending, and growing demand for sustainable building materials.
Leading Regions, Countries, or Segments in Engineered Wood Industry
This section identifies the dominant regions, countries, or segments within the engineered wood market. The report leverages both quantitative and qualitative data to pinpoint the leading players and their competitive advantages. In-depth analysis, bolstered by compelling data, reveals the key drivers propelling growth in these areas.
- Key Drivers in Leading Regions:
- North America: Strong residential construction sector, favorable government policies, and ample timber resources.
- Europe: Emphasis on sustainable building practices, robust infrastructure development, and high demand for high-performance engineered wood products.
- Asia-Pacific: Rapid urbanization, rising disposable incomes, and increasing investment in infrastructure projects.
The report details how these factors contribute to the market dominance of specific regions, providing a comprehensive overview of the global landscape.
Engineered Wood Industry Product Innovations
This section showcases recent product innovations, exploring their applications and performance metrics. The report highlights the development of novel engineered wood products with improved strength, durability, and sustainability features. This includes advancements in cross-laminated timber (CLT), glued laminated timber (glulam), and other engineered wood solutions. The focus is on unique selling propositions and the technological advancements that make these products stand out in the marketplace.
Propelling Factors for Engineered Wood Industry Growth
Several key factors fuel the growth of the engineered wood industry. These include technological advancements, supportive economic conditions, and regulatory frameworks promoting sustainable building practices. The increasing adoption of CLT in high-rise construction is a prime example, alongside government incentives for sustainable building materials and the rising demand for eco-friendly construction solutions.
Obstacles in the Engineered Wood Industry Market
Despite significant growth potential, challenges persist. These include regulatory hurdles concerning building codes and environmental standards, supply chain disruptions impacting raw material availability and transportation costs, and intense competition from substitute materials. These factors can lead to price fluctuations and impact market expansion. Quantifiable impacts are presented where data is available.
Future Opportunities in Engineered Wood Industry
The engineered wood industry presents considerable future opportunities. These include expanding into new markets in developing economies, embracing cutting-edge technologies like 3D printing for wood construction, and catering to evolving consumer preferences for sustainable and aesthetically pleasing building materials.
Major Players in the Engineered Wood Industry Ecosystem
- Binderholz GmbH
- Boise Cascade
- Georgia-Pacific (Georgia-Pacific Wood Products LLC)
- HASSLACHER Holding GmbH
- Havwoods India Pvt Ltd
- Huber Engineered Woods LLC
- KLH Massivholz Wiesenau GmbH
- Kronoplus Limited
- Louisiana-Pacific Corporation
- Mayr-Melnhof Holz Holding AG
- Nordic Structures
- Pacific Woodtech Corporation
- Resolute Forest Products
- Roseburg
- Stora Enso
- West Fraser
- Weyerhaeuser Company *List Not Exhaustive
Key Developments in Engineered Wood Industry Industry
- October 2022: Boise Cascade expanded its distribution center in Albuquerque, New Mexico, acquiring 4.67 acres of adjacent land. This expansion enhances its market reach and distribution capabilities in the region.
- December 2022: Boise Cascade further expanded its distribution network by acquiring 45 acres in Walterboro, SC, and a 34-acre land parcel in Hondo, Texas. These acquisitions demonstrate strategic investments in enhancing logistics and market penetration.
These developments underscore the ongoing investments and strategic expansions within the engineered wood industry, shaping market dynamics and competitive landscapes.
Strategic Engineered Wood Industry Market Forecast
The engineered wood industry is poised for robust growth driven by increasing demand for sustainable building materials, technological advancements in wood processing, and continued investment in infrastructure development globally. The market's potential is substantial, with significant opportunities in both established and emerging markets. This growth will be influenced by factors such as fluctuating raw material prices, technological innovations, and government regulations promoting sustainable construction practices. The forecast indicates a positive outlook for the industry, with a projected market value exceeding $XX Million by 2033.
Engineered Wood Industry Segmentation
-
1. Type
- 1.1. Plywood
- 1.2. Oriented Strand Board (OSB)
- 1.3. Glulam
- 1.4. Cross-laminated Timber (CLT)
- 1.5. Laminated Veneer Lumber (LVL)
- 1.6. Particleboard
- 1.7. Other Types (Fiber Board, Parallel Strand, Others)
-
2. Application
- 2.1. Non-residential
- 2.2. Residential
Engineered Wood Industry Segmentation By Geography
-
1. Asia Pacific
- 1.1. China
- 1.2. India
- 1.3. Japan
- 1.4. South Korea
- 1.5. Malaysia
- 1.6. Thailand
- 1.7. Indonesia
- 1.8. Vietnam
- 1.9. Rest of Asia Pacific
-
2. North America
- 2.1. United States
- 2.2. Canada
- 2.3. Mexico
-
3. Europe
- 3.1. Germany
- 3.2. United Kingdom
- 3.3. France
- 3.4. Italy
- 3.5. Spain
- 3.6. Turkey
- 3.7. Russia
- 3.8. NORDIC Countries
- 3.9. Rest of Europe
-
4. South America
- 4.1. Brazil
- 4.2. Argentina
- 4.3. Colombia
- 4.4. Rest of South America
-
5. Middle East and Africa
- 5.1. Saudi Arabia
- 5.2. Nigeria
- 5.3. Qatar
- 5.4. Egypt
- 5.5. United Arab Emirates
- 5.6. South Africa
- 5.7. Rest of Middle East and Africa

Engineered Wood Industry REPORT HIGHLIGHTS
| Aspects | Details |
|---|---|
| Study Period | 2019-2033 |
| Base Year | 2024 |
| Estimated Year | 2025 |
| Forecast Period | 2025-2033 |
| Historical Period | 2019-2024 |
| Growth Rate | CAGR of > 5.00% from 2019-2033 |
| Segmentation |
|
Table of Contents
- 1. Introduction
- 1.1. Research Scope
- 1.2. Market Segmentation
- 1.3. Research Methodology
- 1.4. Definitions and Assumptions
- 2. Executive Summary
- 2.1. Introduction
- 3. Market Dynamics
- 3.1. Introduction
- 3.2. Market Drivers
- 3.2.1. Growing Demand from the Non-residential Sector; Increasing Use of Cross-laminated Timber (CLT) as Construction Materials; Other Opportunities
- 3.3. Market Restrains
- 3.3.1. Growing Demand from the Non-residential Sector; Increasing Use of Cross-laminated Timber (CLT) as Construction Materials; Other Opportunities
- 3.4. Market Trends
- 3.4.1. The Residential Segment to Dominate the Market
- 4. Market Factor Analysis
- 4.1. Porters Five Forces
- 4.2. Supply/Value Chain
- 4.3. PESTEL analysis
- 4.4. Market Entropy
- 4.5. Patent/Trademark Analysis
- 5. Global Engineered Wood Industry Analysis, Insights and Forecast, 2019-2031
- 5.1. Market Analysis, Insights and Forecast - by Type
- 5.1.1. Plywood
- 5.1.2. Oriented Strand Board (OSB)
- 5.1.3. Glulam
- 5.1.4. Cross-laminated Timber (CLT)
- 5.1.5. Laminated Veneer Lumber (LVL)
- 5.1.6. Particleboard
- 5.1.7. Other Types (Fiber Board, Parallel Strand, Others)
- 5.2. Market Analysis, Insights and Forecast - by Application
- 5.2.1. Non-residential
- 5.2.2. Residential
- 5.3. Market Analysis, Insights and Forecast - by Region
- 5.3.1. Asia Pacific
- 5.3.2. North America
- 5.3.3. Europe
- 5.3.4. South America
- 5.3.5. Middle East and Africa
- 5.1. Market Analysis, Insights and Forecast - by Type
- 6. Asia Pacific Engineered Wood Industry Analysis, Insights and Forecast, 2019-2031
- 6.1. Market Analysis, Insights and Forecast - by Type
- 6.1.1. Plywood
- 6.1.2. Oriented Strand Board (OSB)
- 6.1.3. Glulam
- 6.1.4. Cross-laminated Timber (CLT)
- 6.1.5. Laminated Veneer Lumber (LVL)
- 6.1.6. Particleboard
- 6.1.7. Other Types (Fiber Board, Parallel Strand, Others)
- 6.2. Market Analysis, Insights and Forecast - by Application
- 6.2.1. Non-residential
- 6.2.2. Residential
- 6.1. Market Analysis, Insights and Forecast - by Type
- 7. North America Engineered Wood Industry Analysis, Insights and Forecast, 2019-2031
- 7.1. Market Analysis, Insights and Forecast - by Type
- 7.1.1. Plywood
- 7.1.2. Oriented Strand Board (OSB)
- 7.1.3. Glulam
- 7.1.4. Cross-laminated Timber (CLT)
- 7.1.5. Laminated Veneer Lumber (LVL)
- 7.1.6. Particleboard
- 7.1.7. Other Types (Fiber Board, Parallel Strand, Others)
- 7.2. Market Analysis, Insights and Forecast - by Application
- 7.2.1. Non-residential
- 7.2.2. Residential
- 7.1. Market Analysis, Insights and Forecast - by Type
- 8. Europe Engineered Wood Industry Analysis, Insights and Forecast, 2019-2031
- 8.1. Market Analysis, Insights and Forecast - by Type
- 8.1.1. Plywood
- 8.1.2. Oriented Strand Board (OSB)
- 8.1.3. Glulam
- 8.1.4. Cross-laminated Timber (CLT)
- 8.1.5. Laminated Veneer Lumber (LVL)
- 8.1.6. Particleboard
- 8.1.7. Other Types (Fiber Board, Parallel Strand, Others)
- 8.2. Market Analysis, Insights and Forecast - by Application
- 8.2.1. Non-residential
- 8.2.2. Residential
- 8.1. Market Analysis, Insights and Forecast - by Type
- 9. South America Engineered Wood Industry Analysis, Insights and Forecast, 2019-2031
- 9.1. Market Analysis, Insights and Forecast - by Type
- 9.1.1. Plywood
- 9.1.2. Oriented Strand Board (OSB)
- 9.1.3. Glulam
- 9.1.4. Cross-laminated Timber (CLT)
- 9.1.5. Laminated Veneer Lumber (LVL)
- 9.1.6. Particleboard
- 9.1.7. Other Types (Fiber Board, Parallel Strand, Others)
- 9.2. Market Analysis, Insights and Forecast - by Application
- 9.2.1. Non-residential
- 9.2.2. Residential
- 9.1. Market Analysis, Insights and Forecast - by Type
- 10. Middle East and Africa Engineered Wood Industry Analysis, Insights and Forecast, 2019-2031
- 10.1. Market Analysis, Insights and Forecast - by Type
- 10.1.1. Plywood
- 10.1.2. Oriented Strand Board (OSB)
- 10.1.3. Glulam
- 10.1.4. Cross-laminated Timber (CLT)
- 10.1.5. Laminated Veneer Lumber (LVL)
- 10.1.6. Particleboard
- 10.1.7. Other Types (Fiber Board, Parallel Strand, Others)
- 10.2. Market Analysis, Insights and Forecast - by Application
- 10.2.1. Non-residential
- 10.2.2. Residential
- 10.1. Market Analysis, Insights and Forecast - by Type
- 11. Competitive Analysis
- 11.1. Global Market Share Analysis 2024
- 11.2. Company Profiles
- 11.2.1 Binderholz GmbH
- 11.2.1.1. Overview
- 11.2.1.2. Products
- 11.2.1.3. SWOT Analysis
- 11.2.1.4. Recent Developments
- 11.2.1.5. Financials (Based on Availability)
- 11.2.2 Boise Cascade
- 11.2.2.1. Overview
- 11.2.2.2. Products
- 11.2.2.3. SWOT Analysis
- 11.2.2.4. Recent Developments
- 11.2.2.5. Financials (Based on Availability)
- 11.2.3 Georgia-Pacific (Georgia-Pacific Wood Products LLC)
- 11.2.3.1. Overview
- 11.2.3.2. Products
- 11.2.3.3. SWOT Analysis
- 11.2.3.4. Recent Developments
- 11.2.3.5. Financials (Based on Availability)
- 11.2.4 HASSLACHER Holding GmbH
- 11.2.4.1. Overview
- 11.2.4.2. Products
- 11.2.4.3. SWOT Analysis
- 11.2.4.4. Recent Developments
- 11.2.4.5. Financials (Based on Availability)
- 11.2.5 Havwoods India Pvt Ltd
- 11.2.5.1. Overview
- 11.2.5.2. Products
- 11.2.5.3. SWOT Analysis
- 11.2.5.4. Recent Developments
- 11.2.5.5. Financials (Based on Availability)
- 11.2.6 Huber Engineered Woods LLC
- 11.2.6.1. Overview
- 11.2.6.2. Products
- 11.2.6.3. SWOT Analysis
- 11.2.6.4. Recent Developments
- 11.2.6.5. Financials (Based on Availability)
- 11.2.7 KLH Massivholz Wiesenau GmbH
- 11.2.7.1. Overview
- 11.2.7.2. Products
- 11.2.7.3. SWOT Analysis
- 11.2.7.4. Recent Developments
- 11.2.7.5. Financials (Based on Availability)
- 11.2.8 Kronoplus Limited
- 11.2.8.1. Overview
- 11.2.8.2. Products
- 11.2.8.3. SWOT Analysis
- 11.2.8.4. Recent Developments
- 11.2.8.5. Financials (Based on Availability)
- 11.2.9 Louisiana-Pacific Corporation
- 11.2.9.1. Overview
- 11.2.9.2. Products
- 11.2.9.3. SWOT Analysis
- 11.2.9.4. Recent Developments
- 11.2.9.5. Financials (Based on Availability)
- 11.2.10 Mayr-Melnhof Holz Holding AG
- 11.2.10.1. Overview
- 11.2.10.2. Products
- 11.2.10.3. SWOT Analysis
- 11.2.10.4. Recent Developments
- 11.2.10.5. Financials (Based on Availability)
- 11.2.11 Nordic Structures
- 11.2.11.1. Overview
- 11.2.11.2. Products
- 11.2.11.3. SWOT Analysis
- 11.2.11.4. Recent Developments
- 11.2.11.5. Financials (Based on Availability)
- 11.2.12 Pacific Woodtech Corporation
- 11.2.12.1. Overview
- 11.2.12.2. Products
- 11.2.12.3. SWOT Analysis
- 11.2.12.4. Recent Developments
- 11.2.12.5. Financials (Based on Availability)
- 11.2.13 Resolute Forest Products
- 11.2.13.1. Overview
- 11.2.13.2. Products
- 11.2.13.3. SWOT Analysis
- 11.2.13.4. Recent Developments
- 11.2.13.5. Financials (Based on Availability)
- 11.2.14 Roseburg
- 11.2.14.1. Overview
- 11.2.14.2. Products
- 11.2.14.3. SWOT Analysis
- 11.2.14.4. Recent Developments
- 11.2.14.5. Financials (Based on Availability)
- 11.2.15 Stora Enso
- 11.2.15.1. Overview
- 11.2.15.2. Products
- 11.2.15.3. SWOT Analysis
- 11.2.15.4. Recent Developments
- 11.2.15.5. Financials (Based on Availability)
- 11.2.16 West Fraser
- 11.2.16.1. Overview
- 11.2.16.2. Products
- 11.2.16.3. SWOT Analysis
- 11.2.16.4. Recent Developments
- 11.2.16.5. Financials (Based on Availability)
- 11.2.17 Weyerhaeuser Company*List Not Exhaustive
- 11.2.17.1. Overview
- 11.2.17.2. Products
- 11.2.17.3. SWOT Analysis
- 11.2.17.4. Recent Developments
- 11.2.17.5. Financials (Based on Availability)
- 11.2.1 Binderholz GmbH
List of Figures
- Figure 1: Global Engineered Wood Industry Revenue Breakdown (Million, %) by Region 2024 & 2032
- Figure 2: Asia Pacific Engineered Wood Industry Revenue (Million), by Type 2024 & 2032
- Figure 3: Asia Pacific Engineered Wood Industry Revenue Share (%), by Type 2024 & 2032
- Figure 4: Asia Pacific Engineered Wood Industry Revenue (Million), by Application 2024 & 2032
- Figure 5: Asia Pacific Engineered Wood Industry Revenue Share (%), by Application 2024 & 2032
- Figure 6: Asia Pacific Engineered Wood Industry Revenue (Million), by Country 2024 & 2032
- Figure 7: Asia Pacific Engineered Wood Industry Revenue Share (%), by Country 2024 & 2032
- Figure 8: North America Engineered Wood Industry Revenue (Million), by Type 2024 & 2032
- Figure 9: North America Engineered Wood Industry Revenue Share (%), by Type 2024 & 2032
- Figure 10: North America Engineered Wood Industry Revenue (Million), by Application 2024 & 2032
- Figure 11: North America Engineered Wood Industry Revenue Share (%), by Application 2024 & 2032
- Figure 12: North America Engineered Wood Industry Revenue (Million), by Country 2024 & 2032
- Figure 13: North America Engineered Wood Industry Revenue Share (%), by Country 2024 & 2032
- Figure 14: Europe Engineered Wood Industry Revenue (Million), by Type 2024 & 2032
- Figure 15: Europe Engineered Wood Industry Revenue Share (%), by Type 2024 & 2032
- Figure 16: Europe Engineered Wood Industry Revenue (Million), by Application 2024 & 2032
- Figure 17: Europe Engineered Wood Industry Revenue Share (%), by Application 2024 & 2032
- Figure 18: Europe Engineered Wood Industry Revenue (Million), by Country 2024 & 2032
- Figure 19: Europe Engineered Wood Industry Revenue Share (%), by Country 2024 & 2032
- Figure 20: South America Engineered Wood Industry Revenue (Million), by Type 2024 & 2032
- Figure 21: South America Engineered Wood Industry Revenue Share (%), by Type 2024 & 2032
- Figure 22: South America Engineered Wood Industry Revenue (Million), by Application 2024 & 2032
- Figure 23: South America Engineered Wood Industry Revenue Share (%), by Application 2024 & 2032
- Figure 24: South America Engineered Wood Industry Revenue (Million), by Country 2024 & 2032
- Figure 25: South America Engineered Wood Industry Revenue Share (%), by Country 2024 & 2032
- Figure 26: Middle East and Africa Engineered Wood Industry Revenue (Million), by Type 2024 & 2032
- Figure 27: Middle East and Africa Engineered Wood Industry Revenue Share (%), by Type 2024 & 2032
- Figure 28: Middle East and Africa Engineered Wood Industry Revenue (Million), by Application 2024 & 2032
- Figure 29: Middle East and Africa Engineered Wood Industry Revenue Share (%), by Application 2024 & 2032
- Figure 30: Middle East and Africa Engineered Wood Industry Revenue (Million), by Country 2024 & 2032
- Figure 31: Middle East and Africa Engineered Wood Industry Revenue Share (%), by Country 2024 & 2032
List of Tables
- Table 1: Global Engineered Wood Industry Revenue Million Forecast, by Region 2019 & 2032
- Table 2: Global Engineered Wood Industry Revenue Million Forecast, by Type 2019 & 2032
- Table 3: Global Engineered Wood Industry Revenue Million Forecast, by Application 2019 & 2032
- Table 4: Global Engineered Wood Industry Revenue Million Forecast, by Region 2019 & 2032
- Table 5: Global Engineered Wood Industry Revenue Million Forecast, by Type 2019 & 2032
- Table 6: Global Engineered Wood Industry Revenue Million Forecast, by Application 2019 & 2032
- Table 7: Global Engineered Wood Industry Revenue Million Forecast, by Country 2019 & 2032
- Table 8: China Engineered Wood Industry Revenue (Million) Forecast, by Application 2019 & 2032
- Table 9: India Engineered Wood Industry Revenue (Million) Forecast, by Application 2019 & 2032
- Table 10: Japan Engineered Wood Industry Revenue (Million) Forecast, by Application 2019 & 2032
- Table 11: South Korea Engineered Wood Industry Revenue (Million) Forecast, by Application 2019 & 2032
- Table 12: Malaysia Engineered Wood Industry Revenue (Million) Forecast, by Application 2019 & 2032
- Table 13: Thailand Engineered Wood Industry Revenue (Million) Forecast, by Application 2019 & 2032
- Table 14: Indonesia Engineered Wood Industry Revenue (Million) Forecast, by Application 2019 & 2032
- Table 15: Vietnam Engineered Wood Industry Revenue (Million) Forecast, by Application 2019 & 2032
- Table 16: Rest of Asia Pacific Engineered Wood Industry Revenue (Million) Forecast, by Application 2019 & 2032
- Table 17: Global Engineered Wood Industry Revenue Million Forecast, by Type 2019 & 2032
- Table 18: Global Engineered Wood Industry Revenue Million Forecast, by Application 2019 & 2032
- Table 19: Global Engineered Wood Industry Revenue Million Forecast, by Country 2019 & 2032
- Table 20: United States Engineered Wood Industry Revenue (Million) Forecast, by Application 2019 & 2032
- Table 21: Canada Engineered Wood Industry Revenue (Million) Forecast, by Application 2019 & 2032
- Table 22: Mexico Engineered Wood Industry Revenue (Million) Forecast, by Application 2019 & 2032
- Table 23: Global Engineered Wood Industry Revenue Million Forecast, by Type 2019 & 2032
- Table 24: Global Engineered Wood Industry Revenue Million Forecast, by Application 2019 & 2032
- Table 25: Global Engineered Wood Industry Revenue Million Forecast, by Country 2019 & 2032
- Table 26: Germany Engineered Wood Industry Revenue (Million) Forecast, by Application 2019 & 2032
- Table 27: United Kingdom Engineered Wood Industry Revenue (Million) Forecast, by Application 2019 & 2032
- Table 28: France Engineered Wood Industry Revenue (Million) Forecast, by Application 2019 & 2032
- Table 29: Italy Engineered Wood Industry Revenue (Million) Forecast, by Application 2019 & 2032
- Table 30: Spain Engineered Wood Industry Revenue (Million) Forecast, by Application 2019 & 2032
- Table 31: Turkey Engineered Wood Industry Revenue (Million) Forecast, by Application 2019 & 2032
- Table 32: Russia Engineered Wood Industry Revenue (Million) Forecast, by Application 2019 & 2032
- Table 33: NORDIC Countries Engineered Wood Industry Revenue (Million) Forecast, by Application 2019 & 2032
- Table 34: Rest of Europe Engineered Wood Industry Revenue (Million) Forecast, by Application 2019 & 2032
- Table 35: Global Engineered Wood Industry Revenue Million Forecast, by Type 2019 & 2032
- Table 36: Global Engineered Wood Industry Revenue Million Forecast, by Application 2019 & 2032
- Table 37: Global Engineered Wood Industry Revenue Million Forecast, by Country 2019 & 2032
- Table 38: Brazil Engineered Wood Industry Revenue (Million) Forecast, by Application 2019 & 2032
- Table 39: Argentina Engineered Wood Industry Revenue (Million) Forecast, by Application 2019 & 2032
- Table 40: Colombia Engineered Wood Industry Revenue (Million) Forecast, by Application 2019 & 2032
- Table 41: Rest of South America Engineered Wood Industry Revenue (Million) Forecast, by Application 2019 & 2032
- Table 42: Global Engineered Wood Industry Revenue Million Forecast, by Type 2019 & 2032
- Table 43: Global Engineered Wood Industry Revenue Million Forecast, by Application 2019 & 2032
- Table 44: Global Engineered Wood Industry Revenue Million Forecast, by Country 2019 & 2032
- Table 45: Saudi Arabia Engineered Wood Industry Revenue (Million) Forecast, by Application 2019 & 2032
- Table 46: Nigeria Engineered Wood Industry Revenue (Million) Forecast, by Application 2019 & 2032
- Table 47: Qatar Engineered Wood Industry Revenue (Million) Forecast, by Application 2019 & 2032
- Table 48: Egypt Engineered Wood Industry Revenue (Million) Forecast, by Application 2019 & 2032
- Table 49: United Arab Emirates Engineered Wood Industry Revenue (Million) Forecast, by Application 2019 & 2032
- Table 50: South Africa Engineered Wood Industry Revenue (Million) Forecast, by Application 2019 & 2032
- Table 51: Rest of Middle East and Africa Engineered Wood Industry Revenue (Million) Forecast, by Application 2019 & 2032
Frequently Asked Questions
1. What is the projected Compound Annual Growth Rate (CAGR) of the Engineered Wood Industry?
The projected CAGR is approximately > 5.00%.
2. Which companies are prominent players in the Engineered Wood Industry?
Key companies in the market include Binderholz GmbH, Boise Cascade, Georgia-Pacific (Georgia-Pacific Wood Products LLC), HASSLACHER Holding GmbH, Havwoods India Pvt Ltd, Huber Engineered Woods LLC, KLH Massivholz Wiesenau GmbH, Kronoplus Limited, Louisiana-Pacific Corporation, Mayr-Melnhof Holz Holding AG, Nordic Structures, Pacific Woodtech Corporation, Resolute Forest Products, Roseburg, Stora Enso, West Fraser, Weyerhaeuser Company*List Not Exhaustive.
3. What are the main segments of the Engineered Wood Industry?
The market segments include Type, Application.
4. Can you provide details about the market size?
The market size is estimated to be USD XX Million as of 2022.
5. What are some drivers contributing to market growth?
Growing Demand from the Non-residential Sector; Increasing Use of Cross-laminated Timber (CLT) as Construction Materials; Other Opportunities.
6. What are the notable trends driving market growth?
The Residential Segment to Dominate the Market.
7. Are there any restraints impacting market growth?
Growing Demand from the Non-residential Sector; Increasing Use of Cross-laminated Timber (CLT) as Construction Materials; Other Opportunities.
8. Can you provide examples of recent developments in the market?
December 2022: Boise Cascade expanded distribution centers in two new markets by acquiring 45 acres in Walterboro, SC, and purchasing a 34-acre land parcel in Hondo, Texas.October 2022: Boise Cascade announced the expansion of its distribution center through the acquisition of 4.67 acres of land adjacent to its Albuquerque, New Mexico branch.
9. What pricing options are available for accessing the report?
Pricing options include single-user, multi-user, and enterprise licenses priced at USD 4750, USD 5250, and USD 8750 respectively.
10. Is the market size provided in terms of value or volume?
The market size is provided in terms of value, measured in Million.
11. Are there any specific market keywords associated with the report?
Yes, the market keyword associated with the report is "Engineered Wood Industry," which aids in identifying and referencing the specific market segment covered.
12. How do I determine which pricing option suits my needs best?
The pricing options vary based on user requirements and access needs. Individual users may opt for single-user licenses, while businesses requiring broader access may choose multi-user or enterprise licenses for cost-effective access to the report.
13. Are there any additional resources or data provided in the Engineered Wood Industry report?
While the report offers comprehensive insights, it's advisable to review the specific contents or supplementary materials provided to ascertain if additional resources or data are available.
14. How can I stay updated on further developments or reports in the Engineered Wood Industry?
To stay informed about further developments, trends, and reports in the Engineered Wood Industry, consider subscribing to industry newsletters, following relevant companies and organizations, or regularly checking reputable industry news sources and publications.
Methodology
Step 1 - Identification of Relevant Samples Size from Population Database


Step 2 - Approaches for Defining Global Market Size (Value, Volume* & Price*)

Note*: In applicable scenarios
Step 3 - Data Sources
Primary Research
- Web Analytics
- Survey Reports
- Research Institute
- Latest Research Reports
- Opinion Leaders
Secondary Research
- Annual Reports
- White Paper
- Latest Press Release
- Industry Association
- Paid Database
- Investor Presentations

Step 4 - Data Triangulation
Involves using different sources of information in order to increase the validity of a study
These sources are likely to be stakeholders in a program - participants, other researchers, program staff, other community members, and so on.
Then we put all data in single framework & apply various statistical tools to find out the dynamic on the market.
During the analysis stage, feedback from the stakeholder groups would be compared to determine areas of agreement as well as areas of divergence
