

Key Insights
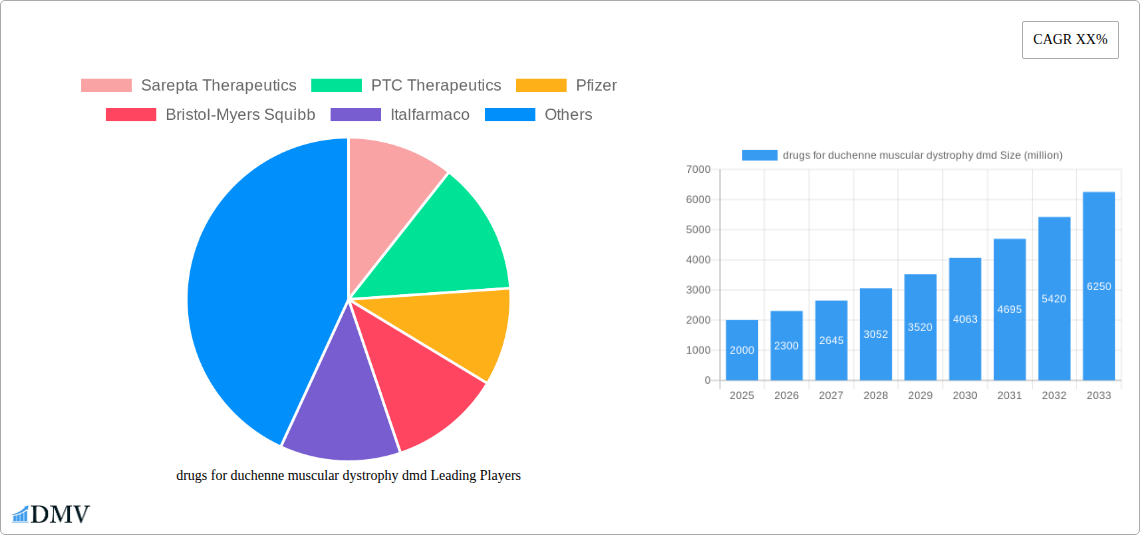
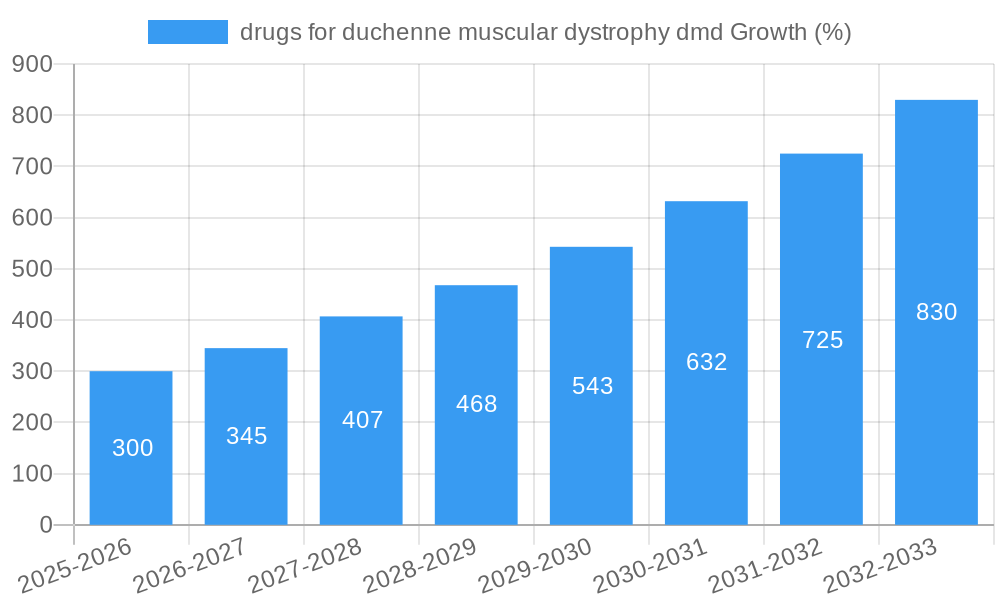
The Duchenne Muscular Dystrophy (DMD) drug market is experiencing robust growth, driven by increasing prevalence of the disease, advancements in therapeutic approaches, and a rising awareness among patients and healthcare providers. The market, estimated at $2 billion in 2025, is projected to witness a Compound Annual Growth Rate (CAGR) of 15% from 2025 to 2033, reaching approximately $7 billion by 2033. This significant expansion is fueled by the ongoing development and launch of novel therapies targeting different disease mechanisms, including gene therapy, exon skipping therapies, and disease-modifying drugs. Key players like Sarepta Therapeutics, PTC Therapeutics, Pfizer, and others are heavily invested in R&D, leading to a competitive landscape with a diverse pipeline of promising treatments. While challenges remain, including high treatment costs and the need for improved efficacy and safety profiles, the market outlook remains positive due to continued innovation and increased patient access to these life-altering therapies. Furthermore, the growing understanding of DMD pathophysiology and the development of biomarker-driven clinical trials are streamlining the drug development process and accelerating the introduction of new treatments to the market.
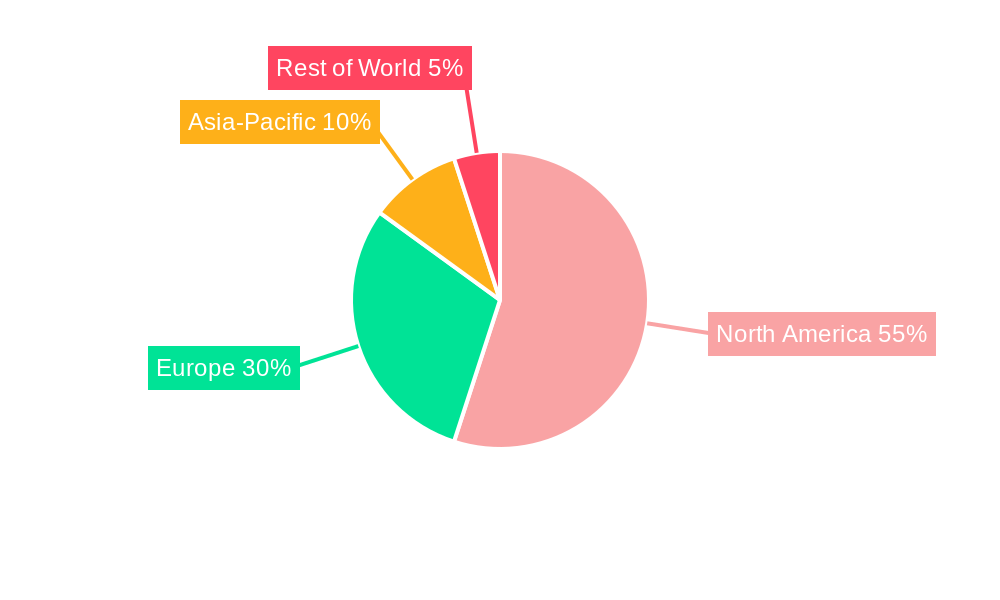
Despite the promising advancements, the market faces certain restraints. The high cost of DMD treatments presents a significant barrier to access for many patients globally. Furthermore, the complexity of the disease and the diverse range of symptoms necessitate personalized treatment approaches, increasing the overall cost of care. Regulatory hurdles and lengthy approval processes also contribute to the challenges faced by companies. However, ongoing research into more effective and cost-efficient treatments, coupled with increasing insurance coverage, is likely to mitigate these restraints and drive further market expansion. The segment analysis is expected to show a significant contribution from gene therapies, as their efficacy improves and their cost per treatment decreases, potentially shifting market share dynamics. Regional growth will be predominantly driven by North America and Europe, reflecting high healthcare expenditure and greater awareness of the disease in these regions.
Duchenne Muscular Dystrophy (DMD) Drugs Market Report: 2019-2033
This comprehensive report provides a detailed analysis of the Duchenne Muscular Dystrophy (DMD) drugs market, offering invaluable insights for stakeholders across the pharmaceutical industry. With a study period spanning 2019-2033, a base year of 2025, and a forecast period of 2025-2033, this report illuminates the market's trajectory, highlighting key trends, innovations, and future opportunities. The global DMD drugs market is projected to reach xx million by 2033, driven by increasing prevalence, advancements in treatment modalities, and substantial investments in R&D. This report provides crucial data on market size, segmentation, leading players, and future growth prospects.
Drugs for Duchenne Muscular Dystrophy (DMD) Market Composition & Trends
The DMD drugs market is characterized by a moderately concentrated landscape with several key players vying for market share. Sarepta Therapeutics, PTC Therapeutics, Pfizer, Bristol-Myers Squibb, Italfarmaco, Santhera Pharmaceuticals, and WaVe Life Sciences are among the leading companies driving innovation and shaping market dynamics. The market's competitive intensity is reflected in the xx million in M&A activity observed during the historical period (2019-2024), with deals predominantly focused on strengthening pipelines and expanding geographic reach. Innovation is fueled by ongoing research into gene therapy, exon skipping therapies, and disease-modifying agents. The regulatory landscape plays a significant role, with stringent approval processes influencing market entry and product lifecycle management. Substitute products are limited, but supportive care therapies constitute a significant part of the overall treatment landscape. The end-user profile comprises patients, healthcare providers, and payers, each with unique needs and considerations.
- Market Share Distribution (2025): Sarepta Therapeutics (xx%), PTC Therapeutics (xx%), Pfizer (xx%), Others (xx%).
- M&A Deal Value (2019-2024): xx million
- Key Innovation Catalysts: Gene therapy advancements, improved exon skipping therapies, novel drug delivery systems.
- Regulatory Landscape: Stringent approval pathways, focus on efficacy and safety data.
DMD Industry Evolution
The DMD drugs market has witnessed significant evolution over the past decade, marked by a shift towards disease-modifying therapies beyond supportive care. The historical period (2019-2024) saw a compound annual growth rate (CAGR) of xx%, driven by increased awareness of DMD, improved diagnostics, and the launch of novel therapies. This growth trajectory is projected to continue during the forecast period (2025-2033), with a predicted CAGR of xx%. Technological advancements, particularly in gene editing and CRISPR technology, hold immense potential for transformative treatments. However, challenges remain, such as high treatment costs, limited access in certain regions, and the need for personalized medicine approaches tailored to individual patient profiles. The increasing adoption of advanced therapies is steadily increasing, alongside a growing understanding of the disease's complexities and the need for early intervention. Patient advocacy groups are playing a critical role in raising awareness and influencing both research priorities and regulatory decision-making.
Leading Regions, Countries, or Segments in DMD
North America currently dominates the DMD market, driven by high healthcare expenditure, robust regulatory frameworks, and a significant patient population. This dominance is further reinforced by the concentration of leading pharmaceutical companies and extensive clinical trial activity within the region. Europe represents a significant secondary market, showing promising growth potential due to increasing awareness and expanding access to novel therapies.
- Key Drivers for North American Dominance:
- High healthcare expenditure and insurance coverage.
- Strong regulatory support and clinical trial infrastructure.
- Presence of major pharmaceutical companies and research institutions.
- Key Drivers for European Market Growth:
- Growing awareness and understanding of DMD.
- Expanding access to advanced therapies through government initiatives.
- Increasing focus on early intervention and personalized medicine.
DMD Product Innovations
Recent product innovations have focused on improving efficacy, safety, and convenience of DMD therapies. Exon skipping therapies have shown significant progress, while gene therapy approaches hold promise for more long-term disease modification. These advancements are characterized by improved delivery systems, optimized target specificity, and reduced adverse events. Unique selling propositions include extended durations of effect, better tolerance, and improved functional outcomes. Ongoing research aims to further enhance the efficacy of these treatments and broaden their accessibility.
Propelling Factors for DMD Growth
The DMD market's growth is propelled by several factors, including increasing prevalence of the disease, enhanced diagnostic capabilities, growing R&D investments by pharmaceutical companies, and supportive regulatory environments. The rising awareness campaigns and patient advocacy efforts are leading to early diagnosis and prompt treatment initiation, further bolstering market expansion. Government initiatives aimed at improving access to expensive therapies also play a crucial role in driving market growth.
Obstacles in the DMD Market
The DMD market faces challenges such as high treatment costs, stringent regulatory pathways for new drug approvals, and limited accessibility of advanced therapies in low- and middle-income countries. Supply chain constraints can also impact the availability of treatments, while the competitive landscape necessitates robust strategies for market penetration. The rarity of DMD also poses challenges in conducting large-scale clinical trials. Furthermore, the long-term efficacy and safety data for many novel therapies are still emerging, leading to some degree of uncertainty amongst patients and healthcare providers.
Future Opportunities in DMD
Future opportunities lie in personalized medicine approaches that tailor treatment based on individual patient characteristics, further development of gene editing technologies, and the exploration of novel therapeutic targets. Expansion into emerging markets presents significant growth potential, as does the development of more convenient and less invasive drug delivery methods. Collaboration between academic institutions, pharmaceutical companies, and patient advocacy groups will be crucial in driving innovation and ensuring patient access to the most advanced therapies.
Major Players in the DMD Ecosystem
- Sarepta Therapeutics
- PTC Therapeutics
- Pfizer
- Bristol-Myers Squibb
- Italfarmaco
- Santhera Pharmaceuticals
- WaVe Life Science
Key Developments in DMD Industry
- 2023: Launch of a novel gene therapy by Sarepta Therapeutics.
- 2022: Acquisition of a promising clinical-stage DMD company by Pfizer.
- 2021: FDA approval of a new exon-skipping therapy.
Strategic DMD Market Forecast
The DMD drugs market is poised for substantial growth during the forecast period (2025-2033), driven by the continued development of innovative therapies, increased awareness, and expanding access to treatment. The market's evolution will be shaped by advancements in gene editing, personalized medicine, and improved drug delivery systems. The anticipated growth will be influenced by the pricing strategies of major players, reimbursement policies, and ongoing research into effective disease-modifying agents. The potential market expansion into emerging economies will also play a significant role in determining the overall growth trajectory of the DMD drug market.
drugs for duchenne muscular dystrophy dmd Segmentation
- 1. Application
- 2. Types
drugs for duchenne muscular dystrophy dmd Segmentation By Geography
-
1. North America
- 1.1. United States
- 1.2. Canada
- 1.3. Mexico
-
2. South America
- 2.1. Brazil
- 2.2. Argentina
- 2.3. Rest of South America
-
3. Europe
- 3.1. United Kingdom
- 3.2. Germany
- 3.3. France
- 3.4. Italy
- 3.5. Spain
- 3.6. Russia
- 3.7. Benelux
- 3.8. Nordics
- 3.9. Rest of Europe
-
4. Middle East & Africa
- 4.1. Turkey
- 4.2. Israel
- 4.3. GCC
- 4.4. North Africa
- 4.5. South Africa
- 4.6. Rest of Middle East & Africa
-
5. Asia Pacific
- 5.1. China
- 5.2. India
- 5.3. Japan
- 5.4. South Korea
- 5.5. ASEAN
- 5.6. Oceania
- 5.7. Rest of Asia Pacific
drugs for duchenne muscular dystrophy dmd REPORT HIGHLIGHTS
| Aspects | Details |
|---|---|
| Study Period | 2019-2033 |
| Base Year | 2024 |
| Estimated Year | 2025 |
| Forecast Period | 2025-2033 |
| Historical Period | 2019-2024 |
| Growth Rate | CAGR of XX% from 2019-2033 |
| Segmentation |
|
Table of Contents
- 1. Introduction
- 1.1. Research Scope
- 1.2. Market Segmentation
- 1.3. Research Methodology
- 1.4. Definitions and Assumptions
- 2. Executive Summary
- 2.1. Introduction
- 3. Market Dynamics
- 3.1. Introduction
- 3.2. Market Drivers
- 3.3. Market Restrains
- 3.4. Market Trends
- 4. Market Factor Analysis
- 4.1. Porters Five Forces
- 4.2. Supply/Value Chain
- 4.3. PESTEL analysis
- 4.4. Market Entropy
- 4.5. Patent/Trademark Analysis
- 5. Global drugs for duchenne muscular dystrophy dmd Analysis, Insights and Forecast, 2019-2031
- 5.1. Market Analysis, Insights and Forecast - by Application
- 5.2. Market Analysis, Insights and Forecast - by Types
- 5.3. Market Analysis, Insights and Forecast - by Region
- 5.3.1. North America
- 5.3.2. South America
- 5.3.3. Europe
- 5.3.4. Middle East & Africa
- 5.3.5. Asia Pacific
- 5.1. Market Analysis, Insights and Forecast - by Application
- 6. North America drugs for duchenne muscular dystrophy dmd Analysis, Insights and Forecast, 2019-2031
- 6.1. Market Analysis, Insights and Forecast - by Application
- 6.2. Market Analysis, Insights and Forecast - by Types
- 6.1. Market Analysis, Insights and Forecast - by Application
- 7. South America drugs for duchenne muscular dystrophy dmd Analysis, Insights and Forecast, 2019-2031
- 7.1. Market Analysis, Insights and Forecast - by Application
- 7.2. Market Analysis, Insights and Forecast - by Types
- 7.1. Market Analysis, Insights and Forecast - by Application
- 8. Europe drugs for duchenne muscular dystrophy dmd Analysis, Insights and Forecast, 2019-2031
- 8.1. Market Analysis, Insights and Forecast - by Application
- 8.2. Market Analysis, Insights and Forecast - by Types
- 8.1. Market Analysis, Insights and Forecast - by Application
- 9. Middle East & Africa drugs for duchenne muscular dystrophy dmd Analysis, Insights and Forecast, 2019-2031
- 9.1. Market Analysis, Insights and Forecast - by Application
- 9.2. Market Analysis, Insights and Forecast - by Types
- 9.1. Market Analysis, Insights and Forecast - by Application
- 10. Asia Pacific drugs for duchenne muscular dystrophy dmd Analysis, Insights and Forecast, 2019-2031
- 10.1. Market Analysis, Insights and Forecast - by Application
- 10.2. Market Analysis, Insights and Forecast - by Types
- 10.1. Market Analysis, Insights and Forecast - by Application
- 11. Competitive Analysis
- 11.1. Global Market Share Analysis 2024
- 11.2. Company Profiles
- 11.2.1 Sarepta Therapeutics
- 11.2.1.1. Overview
- 11.2.1.2. Products
- 11.2.1.3. SWOT Analysis
- 11.2.1.4. Recent Developments
- 11.2.1.5. Financials (Based on Availability)
- 11.2.2 PTC Therapeutics
- 11.2.2.1. Overview
- 11.2.2.2. Products
- 11.2.2.3. SWOT Analysis
- 11.2.2.4. Recent Developments
- 11.2.2.5. Financials (Based on Availability)
- 11.2.3 Pfizer
- 11.2.3.1. Overview
- 11.2.3.2. Products
- 11.2.3.3. SWOT Analysis
- 11.2.3.4. Recent Developments
- 11.2.3.5. Financials (Based on Availability)
- 11.2.4 Bristol-Myers Squibb
- 11.2.4.1. Overview
- 11.2.4.2. Products
- 11.2.4.3. SWOT Analysis
- 11.2.4.4. Recent Developments
- 11.2.4.5. Financials (Based on Availability)
- 11.2.5 Italfarmaco
- 11.2.5.1. Overview
- 11.2.5.2. Products
- 11.2.5.3. SWOT Analysis
- 11.2.5.4. Recent Developments
- 11.2.5.5. Financials (Based on Availability)
- 11.2.6 Santhera Pharmaceuticals
- 11.2.6.1. Overview
- 11.2.6.2. Products
- 11.2.6.3. SWOT Analysis
- 11.2.6.4. Recent Developments
- 11.2.6.5. Financials (Based on Availability)
- 11.2.7 WaVe life Science
- 11.2.7.1. Overview
- 11.2.7.2. Products
- 11.2.7.3. SWOT Analysis
- 11.2.7.4. Recent Developments
- 11.2.7.5. Financials (Based on Availability)
- 11.2.1 Sarepta Therapeutics
List of Figures
- Figure 1: Global drugs for duchenne muscular dystrophy dmd Revenue Breakdown (million, %) by Region 2024 & 2032
- Figure 2: North America drugs for duchenne muscular dystrophy dmd Revenue (million), by Application 2024 & 2032
- Figure 3: North America drugs for duchenne muscular dystrophy dmd Revenue Share (%), by Application 2024 & 2032
- Figure 4: North America drugs for duchenne muscular dystrophy dmd Revenue (million), by Types 2024 & 2032
- Figure 5: North America drugs for duchenne muscular dystrophy dmd Revenue Share (%), by Types 2024 & 2032
- Figure 6: North America drugs for duchenne muscular dystrophy dmd Revenue (million), by Country 2024 & 2032
- Figure 7: North America drugs for duchenne muscular dystrophy dmd Revenue Share (%), by Country 2024 & 2032
- Figure 8: South America drugs for duchenne muscular dystrophy dmd Revenue (million), by Application 2024 & 2032
- Figure 9: South America drugs for duchenne muscular dystrophy dmd Revenue Share (%), by Application 2024 & 2032
- Figure 10: South America drugs for duchenne muscular dystrophy dmd Revenue (million), by Types 2024 & 2032
- Figure 11: South America drugs for duchenne muscular dystrophy dmd Revenue Share (%), by Types 2024 & 2032
- Figure 12: South America drugs for duchenne muscular dystrophy dmd Revenue (million), by Country 2024 & 2032
- Figure 13: South America drugs for duchenne muscular dystrophy dmd Revenue Share (%), by Country 2024 & 2032
- Figure 14: Europe drugs for duchenne muscular dystrophy dmd Revenue (million), by Application 2024 & 2032
- Figure 15: Europe drugs for duchenne muscular dystrophy dmd Revenue Share (%), by Application 2024 & 2032
- Figure 16: Europe drugs for duchenne muscular dystrophy dmd Revenue (million), by Types 2024 & 2032
- Figure 17: Europe drugs for duchenne muscular dystrophy dmd Revenue Share (%), by Types 2024 & 2032
- Figure 18: Europe drugs for duchenne muscular dystrophy dmd Revenue (million), by Country 2024 & 2032
- Figure 19: Europe drugs for duchenne muscular dystrophy dmd Revenue Share (%), by Country 2024 & 2032
- Figure 20: Middle East & Africa drugs for duchenne muscular dystrophy dmd Revenue (million), by Application 2024 & 2032
- Figure 21: Middle East & Africa drugs for duchenne muscular dystrophy dmd Revenue Share (%), by Application 2024 & 2032
- Figure 22: Middle East & Africa drugs for duchenne muscular dystrophy dmd Revenue (million), by Types 2024 & 2032
- Figure 23: Middle East & Africa drugs for duchenne muscular dystrophy dmd Revenue Share (%), by Types 2024 & 2032
- Figure 24: Middle East & Africa drugs for duchenne muscular dystrophy dmd Revenue (million), by Country 2024 & 2032
- Figure 25: Middle East & Africa drugs for duchenne muscular dystrophy dmd Revenue Share (%), by Country 2024 & 2032
- Figure 26: Asia Pacific drugs for duchenne muscular dystrophy dmd Revenue (million), by Application 2024 & 2032
- Figure 27: Asia Pacific drugs for duchenne muscular dystrophy dmd Revenue Share (%), by Application 2024 & 2032
- Figure 28: Asia Pacific drugs for duchenne muscular dystrophy dmd Revenue (million), by Types 2024 & 2032
- Figure 29: Asia Pacific drugs for duchenne muscular dystrophy dmd Revenue Share (%), by Types 2024 & 2032
- Figure 30: Asia Pacific drugs for duchenne muscular dystrophy dmd Revenue (million), by Country 2024 & 2032
- Figure 31: Asia Pacific drugs for duchenne muscular dystrophy dmd Revenue Share (%), by Country 2024 & 2032
List of Tables
- Table 1: Global drugs for duchenne muscular dystrophy dmd Revenue million Forecast, by Region 2019 & 2032
- Table 2: Global drugs for duchenne muscular dystrophy dmd Revenue million Forecast, by Application 2019 & 2032
- Table 3: Global drugs for duchenne muscular dystrophy dmd Revenue million Forecast, by Types 2019 & 2032
- Table 4: Global drugs for duchenne muscular dystrophy dmd Revenue million Forecast, by Region 2019 & 2032
- Table 5: Global drugs for duchenne muscular dystrophy dmd Revenue million Forecast, by Application 2019 & 2032
- Table 6: Global drugs for duchenne muscular dystrophy dmd Revenue million Forecast, by Types 2019 & 2032
- Table 7: Global drugs for duchenne muscular dystrophy dmd Revenue million Forecast, by Country 2019 & 2032
- Table 8: United States drugs for duchenne muscular dystrophy dmd Revenue (million) Forecast, by Application 2019 & 2032
- Table 9: Canada drugs for duchenne muscular dystrophy dmd Revenue (million) Forecast, by Application 2019 & 2032
- Table 10: Mexico drugs for duchenne muscular dystrophy dmd Revenue (million) Forecast, by Application 2019 & 2032
- Table 11: Global drugs for duchenne muscular dystrophy dmd Revenue million Forecast, by Application 2019 & 2032
- Table 12: Global drugs for duchenne muscular dystrophy dmd Revenue million Forecast, by Types 2019 & 2032
- Table 13: Global drugs for duchenne muscular dystrophy dmd Revenue million Forecast, by Country 2019 & 2032
- Table 14: Brazil drugs for duchenne muscular dystrophy dmd Revenue (million) Forecast, by Application 2019 & 2032
- Table 15: Argentina drugs for duchenne muscular dystrophy dmd Revenue (million) Forecast, by Application 2019 & 2032
- Table 16: Rest of South America drugs for duchenne muscular dystrophy dmd Revenue (million) Forecast, by Application 2019 & 2032
- Table 17: Global drugs for duchenne muscular dystrophy dmd Revenue million Forecast, by Application 2019 & 2032
- Table 18: Global drugs for duchenne muscular dystrophy dmd Revenue million Forecast, by Types 2019 & 2032
- Table 19: Global drugs for duchenne muscular dystrophy dmd Revenue million Forecast, by Country 2019 & 2032
- Table 20: United Kingdom drugs for duchenne muscular dystrophy dmd Revenue (million) Forecast, by Application 2019 & 2032
- Table 21: Germany drugs for duchenne muscular dystrophy dmd Revenue (million) Forecast, by Application 2019 & 2032
- Table 22: France drugs for duchenne muscular dystrophy dmd Revenue (million) Forecast, by Application 2019 & 2032
- Table 23: Italy drugs for duchenne muscular dystrophy dmd Revenue (million) Forecast, by Application 2019 & 2032
- Table 24: Spain drugs for duchenne muscular dystrophy dmd Revenue (million) Forecast, by Application 2019 & 2032
- Table 25: Russia drugs for duchenne muscular dystrophy dmd Revenue (million) Forecast, by Application 2019 & 2032
- Table 26: Benelux drugs for duchenne muscular dystrophy dmd Revenue (million) Forecast, by Application 2019 & 2032
- Table 27: Nordics drugs for duchenne muscular dystrophy dmd Revenue (million) Forecast, by Application 2019 & 2032
- Table 28: Rest of Europe drugs for duchenne muscular dystrophy dmd Revenue (million) Forecast, by Application 2019 & 2032
- Table 29: Global drugs for duchenne muscular dystrophy dmd Revenue million Forecast, by Application 2019 & 2032
- Table 30: Global drugs for duchenne muscular dystrophy dmd Revenue million Forecast, by Types 2019 & 2032
- Table 31: Global drugs for duchenne muscular dystrophy dmd Revenue million Forecast, by Country 2019 & 2032
- Table 32: Turkey drugs for duchenne muscular dystrophy dmd Revenue (million) Forecast, by Application 2019 & 2032
- Table 33: Israel drugs for duchenne muscular dystrophy dmd Revenue (million) Forecast, by Application 2019 & 2032
- Table 34: GCC drugs for duchenne muscular dystrophy dmd Revenue (million) Forecast, by Application 2019 & 2032
- Table 35: North Africa drugs for duchenne muscular dystrophy dmd Revenue (million) Forecast, by Application 2019 & 2032
- Table 36: South Africa drugs for duchenne muscular dystrophy dmd Revenue (million) Forecast, by Application 2019 & 2032
- Table 37: Rest of Middle East & Africa drugs for duchenne muscular dystrophy dmd Revenue (million) Forecast, by Application 2019 & 2032
- Table 38: Global drugs for duchenne muscular dystrophy dmd Revenue million Forecast, by Application 2019 & 2032
- Table 39: Global drugs for duchenne muscular dystrophy dmd Revenue million Forecast, by Types 2019 & 2032
- Table 40: Global drugs for duchenne muscular dystrophy dmd Revenue million Forecast, by Country 2019 & 2032
- Table 41: China drugs for duchenne muscular dystrophy dmd Revenue (million) Forecast, by Application 2019 & 2032
- Table 42: India drugs for duchenne muscular dystrophy dmd Revenue (million) Forecast, by Application 2019 & 2032
- Table 43: Japan drugs for duchenne muscular dystrophy dmd Revenue (million) Forecast, by Application 2019 & 2032
- Table 44: South Korea drugs for duchenne muscular dystrophy dmd Revenue (million) Forecast, by Application 2019 & 2032
- Table 45: ASEAN drugs for duchenne muscular dystrophy dmd Revenue (million) Forecast, by Application 2019 & 2032
- Table 46: Oceania drugs for duchenne muscular dystrophy dmd Revenue (million) Forecast, by Application 2019 & 2032
- Table 47: Rest of Asia Pacific drugs for duchenne muscular dystrophy dmd Revenue (million) Forecast, by Application 2019 & 2032
Frequently Asked Questions
1. What is the projected Compound Annual Growth Rate (CAGR) of the drugs for duchenne muscular dystrophy dmd?
The projected CAGR is approximately XX%.
2. Which companies are prominent players in the drugs for duchenne muscular dystrophy dmd?
Key companies in the market include Sarepta Therapeutics, PTC Therapeutics, Pfizer, Bristol-Myers Squibb, Italfarmaco, Santhera Pharmaceuticals, WaVe life Science.
3. What are the main segments of the drugs for duchenne muscular dystrophy dmd?
The market segments include Application, Types.
4. Can you provide details about the market size?
The market size is estimated to be USD XXX million as of 2022.
5. What are some drivers contributing to market growth?
N/A
6. What are the notable trends driving market growth?
N/A
7. Are there any restraints impacting market growth?
N/A
8. Can you provide examples of recent developments in the market?
N/A
9. What pricing options are available for accessing the report?
Pricing options include single-user, multi-user, and enterprise licenses priced at USD 4350.00, USD 6525.00, and USD 8700.00 respectively.
10. Is the market size provided in terms of value or volume?
The market size is provided in terms of value, measured in million.
11. Are there any specific market keywords associated with the report?
Yes, the market keyword associated with the report is "drugs for duchenne muscular dystrophy dmd," which aids in identifying and referencing the specific market segment covered.
12. How do I determine which pricing option suits my needs best?
The pricing options vary based on user requirements and access needs. Individual users may opt for single-user licenses, while businesses requiring broader access may choose multi-user or enterprise licenses for cost-effective access to the report.
13. Are there any additional resources or data provided in the drugs for duchenne muscular dystrophy dmd report?
While the report offers comprehensive insights, it's advisable to review the specific contents or supplementary materials provided to ascertain if additional resources or data are available.
14. How can I stay updated on further developments or reports in the drugs for duchenne muscular dystrophy dmd?
To stay informed about further developments, trends, and reports in the drugs for duchenne muscular dystrophy dmd, consider subscribing to industry newsletters, following relevant companies and organizations, or regularly checking reputable industry news sources and publications.
Methodology
Step 1 - Identification of Relevant Samples Size from Population Database


Step 2 - Approaches for Defining Global Market Size (Value, Volume* & Price*)

Note*: In applicable scenarios
Step 3 - Data Sources
Primary Research
- Web Analytics
- Survey Reports
- Research Institute
- Latest Research Reports
- Opinion Leaders
Secondary Research
- Annual Reports
- White Paper
- Latest Press Release
- Industry Association
- Paid Database
- Investor Presentations

Step 4 - Data Triangulation
Involves using different sources of information in order to increase the validity of a study
These sources are likely to be stakeholders in a program - participants, other researchers, program staff, other community members, and so on.
Then we put all data in single framework & apply various statistical tools to find out the dynamic on the market.
During the analysis stage, feedback from the stakeholder groups would be compared to determine areas of agreement as well as areas of divergence
