

Key Insights
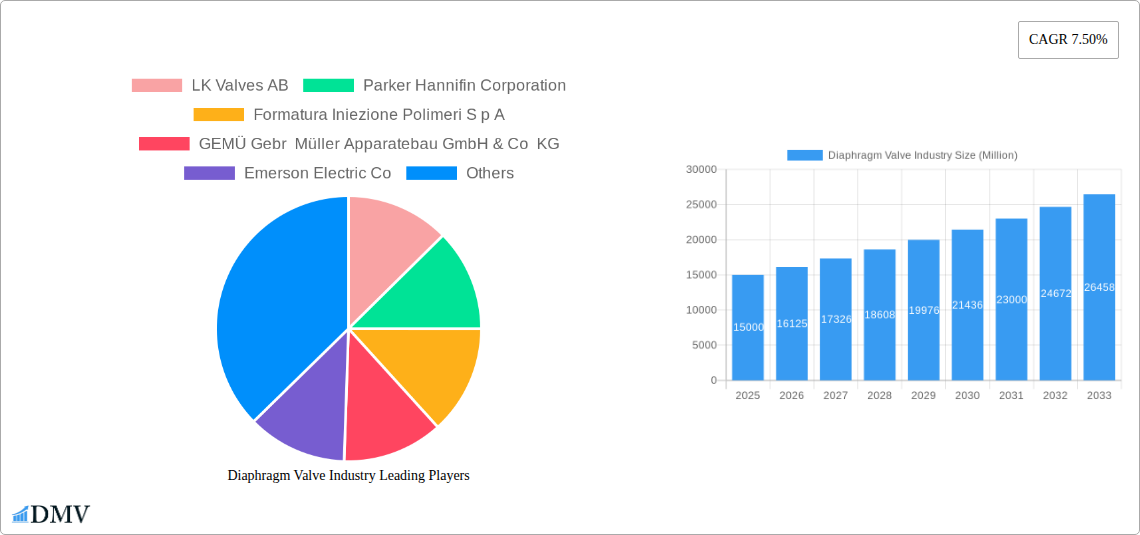
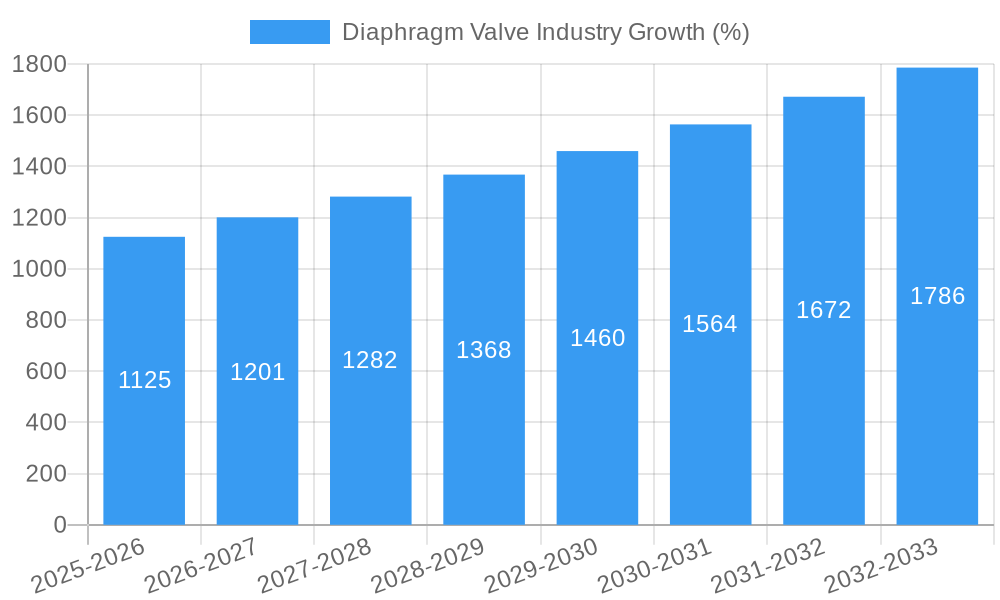
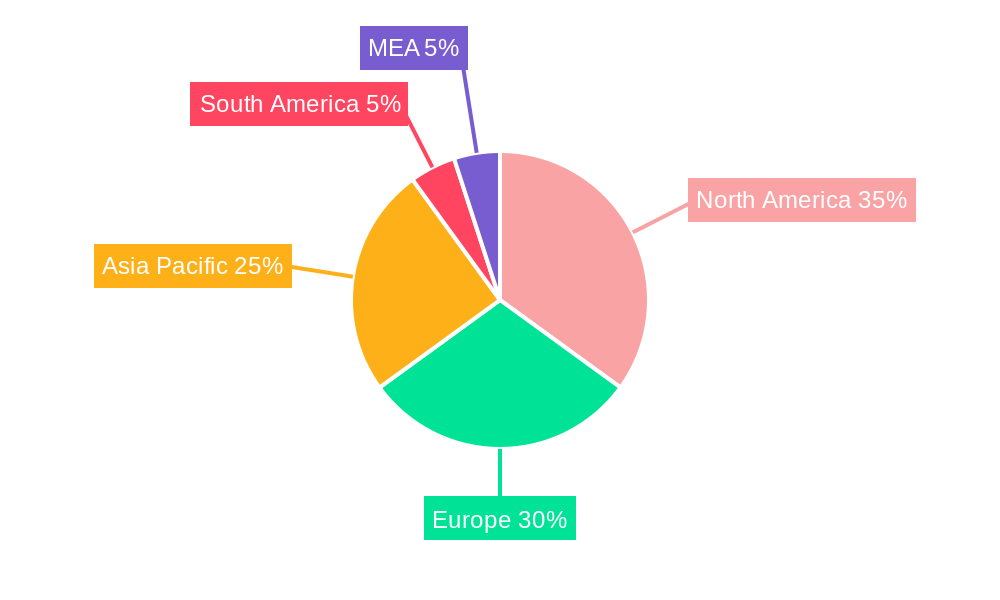
The global diaphragm valve market is experiencing robust growth, projected to maintain a 7.5% CAGR from 2025 to 2033. This expansion is driven by increasing demand across diverse end-user verticals, particularly in the chemical, food and beverage, and water treatment sectors. These industries rely heavily on diaphragm valves for their ability to handle corrosive, viscous, and abrasive fluids while ensuring precise control and minimal maintenance. Technological advancements, such as the development of improved materials for enhanced durability and chemical resistance, are further fueling market growth. The rising adoption of automation and smart manufacturing technologies in industrial processes is also contributing to increased demand. Regional variations exist, with North America and Europe currently holding significant market shares due to established industrial infrastructure and high adoption rates. However, the Asia-Pacific region is poised for substantial growth, driven by rapid industrialization and expanding manufacturing capabilities in countries like China and India. Competitive dynamics are shaped by a mix of established global players and regional manufacturers, leading to innovation and a diverse range of product offerings.
The market segmentation reveals that weir and straight-way diaphragm valves are the dominant product types, catering to specific application requirements. The chemical industry represents a significant end-user segment, demanding high-performance valves capable of handling aggressive chemicals. Growth in the water treatment sector is directly correlated with increasing global concerns regarding water purity and availability. While restraints such as high initial investment costs and potential maintenance complexities exist, the overall market outlook remains positive, driven by long-term benefits including improved process efficiency, reduced downtime, and enhanced safety. The forecast period suggests continued expansion, particularly in emerging markets, indicating considerable investment opportunities for market participants. Future growth will likely be influenced by evolving regulatory landscapes concerning environmental protection and the increasing emphasis on sustainable manufacturing practices.
Diaphragm Valve Industry Market Report: 2019-2033
This comprehensive report provides an in-depth analysis of the global Diaphragm Valve market, offering invaluable insights for stakeholders seeking to navigate this dynamic sector. With a focus on market trends, leading players, and future growth opportunities, this report is an essential resource for strategic decision-making. The study period covers 2019-2033, with a base year of 2025 and a forecast period of 2025-2033. The market size is estimated to be at XX Million in 2025.
Diaphragm Valve Industry Market Composition & Trends
The global diaphragm valve market, valued at XX Million in 2025, exhibits a moderately consolidated structure. Key players like Parker Hannifin Corporation, Emerson Electric Co, and CRANE ChemPharma & Energy hold significant market share, while numerous smaller players contribute to the overall market dynamics. Market share distribution is influenced by factors like technological innovation, geographic reach, and customer relationships.
Innovation is a crucial driver, with continuous advancements in materials science and automation leading to improved valve performance and efficiency. Regulatory landscapes, particularly concerning environmental compliance and safety standards, significantly impact market growth. Substitute products, such as ball valves and butterfly valves, pose competitive pressure. The report thoroughly analyzes the end-user profile, revealing the dominance of certain sectors like the chemical and pharmaceutical industries. Furthermore, M&A activities, with deal values estimated to total XX Million in the past five years, have shaped the competitive landscape and spurred industry consolidation.
- Market Concentration: Moderately consolidated, with a few major players dominating.
- Innovation Catalysts: Advancements in materials, automation, and digital technologies.
- Regulatory Landscape: Stringent environmental and safety standards influencing market trends.
- Substitute Products: Ball valves, butterfly valves, presenting competitive challenges.
- End-User Profiles: Chemical, pharmaceutical, and water treatment sectors are key drivers.
- M&A Activity: Significant M&A activity, with a total deal value of approximately XX Million over the last five years.
Diaphragm Valve Industry Industry Evolution
The diaphragm valve industry has witnessed substantial growth over the historical period (2019-2024), exhibiting a Compound Annual Growth Rate (CAGR) of XX%. This growth trajectory is projected to continue through the forecast period (2025-2033), with a projected CAGR of XX%, driven by several factors. Technological advancements, particularly in materials science leading to more durable and chemically resistant diaphragms, are significantly enhancing the performance and lifespan of these valves. Furthermore, the increasing automation and integration of diaphragm valves into advanced process control systems are driving adoption across various industries. Shifting consumer demands, driven by the need for improved operational efficiency, safety, and reduced maintenance costs, also fuel market growth. The adoption rate of advanced features like smart sensors and predictive maintenance capabilities is increasing steadily, with a projected XX% adoption rate by 2033. The growing demand from specific end-user verticals, particularly the chemical processing, pharmaceutical manufacturing and water treatment sectors, is further contributing to overall market expansion.
Leading Regions, Countries, or Segments in Diaphragm Valve Industry
The North American region currently holds the largest market share in the diaphragm valve industry, followed by Europe and Asia-Pacific. Within these regions, specific countries like the US, Germany, and China are key contributors to market growth.
By Product Type:
- Straight-way Valves: This segment commands the largest market share due to its versatility and suitability for a wide range of applications.
- Weir Valves: This segment is experiencing significant growth driven by its unique suitability for high-pressure applications and corrosive fluids.
By End-user Vertical:
- Chemical Industry: The chemical industry is a major driver due to the high demand for chemically resistant and durable valves. Stringent safety regulations and the increasing need for precise process control contribute to the segment’s dominance.
- Pharmaceutical Industry: The pharmaceutical sector's stringent hygiene and purity requirements drive the adoption of high-quality diaphragm valves, thus pushing market growth.
- Water Treatment: The expanding water treatment industry, driven by growing concerns about water scarcity and pollution, fuels significant demand.
Diaphragm Valve Industry Product Innovations
Recent innovations in diaphragm valve technology include the development of valves with enhanced chemical resistance, improved temperature tolerance, and advanced sealing mechanisms. These advancements offer significant advantages in terms of operational efficiency, extended lifespan, and reduced maintenance costs. The incorporation of smart sensors and digital connectivity allows for real-time monitoring and predictive maintenance, further optimizing performance and minimizing downtime. Unique selling propositions often center on enhanced durability, reduced leakage rates, and simplified maintenance procedures.
Propelling Factors for Diaphragm Valve Industry Growth
Several factors are driving the growth of the diaphragm valve industry. Technological advancements, such as the development of new materials and improved designs, enhance valve performance and efficiency. Strong economic growth in key industrial sectors, particularly in the chemical and pharmaceutical industries, fuels demand. Favorable government regulations promoting industrial safety and environmental protection create a positive regulatory environment.
Obstacles in the Diaphragm Valve Industry Market
Challenges facing the diaphragm valve industry include fluctuating raw material prices, potential supply chain disruptions, and intense competition among numerous manufacturers. Stringent regulatory compliance requirements increase production costs, and the increasing adoption of substitute products puts pressure on market share.
Future Opportunities in Diaphragm Valve Industry
Future opportunities lie in expanding into emerging markets with developing industrial sectors, developing more sustainable and environmentally friendly valve materials, and leveraging the potential of Industry 4.0 technologies, such as IoT integration and predictive maintenance. Focus on customized solutions tailored to specific customer needs will also drive growth.
Major Players in the Diaphragm Valve Industry Ecosystem
- LK Valves AB
- Parker Hannifin Corporation
- Formatura Iniezione Polimeri S p A
- GEMÜ Gebr Müller Apparatebau GmbH & Co KG
- Emerson Electric Co
- Asahi/America Inc
- CRANE ChemPharma & Energy
- ITT Inc
- Nippon Daiya Valve Co Ltd
- Hy-Lok USA
- Aira Euro Automation Pvt Ltd
- Erhard GmbH & Co KG
- The Weir Group plc
- Pentair PLC
Key Developments in Diaphragm Valve Industry Industry
- 2022-Q3: Parker Hannifin Corporation launches a new line of high-performance diaphragm valves with enhanced chemical resistance.
- 2023-Q1: Emerson Electric Co acquires a smaller diaphragm valve manufacturer, expanding its market reach.
- 2024-Q2: New environmental regulations in Europe impact the material choices for diaphragm valve manufacturing.
Strategic Diaphragm Valve Industry Market Forecast
The diaphragm valve market is poised for continued growth, driven by technological advancements, increasing industrialization, and the growing need for efficient and reliable fluid control solutions. Emerging markets and the adoption of advanced materials and technologies offer significant opportunities for market expansion. The projected CAGR suggests substantial market potential over the forecast period.
Diaphragm Valve Industry Segmentation
-
1. Product Type
- 1.1. Weir
- 1.2. Straight-way
-
2. End-user Vertical
- 2.1. Chemical
- 2.2. Food and Beverage
- 2.3. Water Treatment
- 2.4. Power
- 2.5. Pharmaceutical
- 2.6. Other End-user Verticals
Diaphragm Valve Industry Segmentation By Geography
- 1. North America
- 2. Europe
- 3. Asia Pacific
- 4. Rest of the World
Diaphragm Valve Industry REPORT HIGHLIGHTS
| Aspects | Details |
|---|---|
| Study Period | 2019-2033 |
| Base Year | 2024 |
| Estimated Year | 2025 |
| Forecast Period | 2025-2033 |
| Historical Period | 2019-2024 |
| Growth Rate | CAGR of 7.50% from 2019-2033 |
| Segmentation |
|
Table of Contents
- 1. Introduction
- 1.1. Research Scope
- 1.2. Market Segmentation
- 1.3. Research Methodology
- 1.4. Definitions and Assumptions
- 2. Executive Summary
- 2.1. Introduction
- 3. Market Dynamics
- 3.1. Introduction
- 3.2. Market Drivers
- 3.2.1. ; Rising Demand for Radioactive Waste Management; Increasing Demand for Safe and Reliable Production
- 3.3. Market Restrains
- 3.3.1. ; Limiting Pressure and Temperatures and Experience Erosion
- 3.4. Market Trends
- 3.4.1. Demand of Water Treatment to Drive the Market Demand
- 4. Market Factor Analysis
- 4.1. Porters Five Forces
- 4.2. Supply/Value Chain
- 4.3. PESTEL analysis
- 4.4. Market Entropy
- 4.5. Patent/Trademark Analysis
- 5. Global Diaphragm Valve Industry Analysis, Insights and Forecast, 2019-2031
- 5.1. Market Analysis, Insights and Forecast - by Product Type
- 5.1.1. Weir
- 5.1.2. Straight-way
- 5.2. Market Analysis, Insights and Forecast - by End-user Vertical
- 5.2.1. Chemical
- 5.2.2. Food and Beverage
- 5.2.3. Water Treatment
- 5.2.4. Power
- 5.2.5. Pharmaceutical
- 5.2.6. Other End-user Verticals
- 5.3. Market Analysis, Insights and Forecast - by Region
- 5.3.1. North America
- 5.3.2. Europe
- 5.3.3. Asia Pacific
- 5.3.4. Rest of the World
- 5.1. Market Analysis, Insights and Forecast - by Product Type
- 6. North America Diaphragm Valve Industry Analysis, Insights and Forecast, 2019-2031
- 6.1. Market Analysis, Insights and Forecast - by Product Type
- 6.1.1. Weir
- 6.1.2. Straight-way
- 6.2. Market Analysis, Insights and Forecast - by End-user Vertical
- 6.2.1. Chemical
- 6.2.2. Food and Beverage
- 6.2.3. Water Treatment
- 6.2.4. Power
- 6.2.5. Pharmaceutical
- 6.2.6. Other End-user Verticals
- 6.1. Market Analysis, Insights and Forecast - by Product Type
- 7. Europe Diaphragm Valve Industry Analysis, Insights and Forecast, 2019-2031
- 7.1. Market Analysis, Insights and Forecast - by Product Type
- 7.1.1. Weir
- 7.1.2. Straight-way
- 7.2. Market Analysis, Insights and Forecast - by End-user Vertical
- 7.2.1. Chemical
- 7.2.2. Food and Beverage
- 7.2.3. Water Treatment
- 7.2.4. Power
- 7.2.5. Pharmaceutical
- 7.2.6. Other End-user Verticals
- 7.1. Market Analysis, Insights and Forecast - by Product Type
- 8. Asia Pacific Diaphragm Valve Industry Analysis, Insights and Forecast, 2019-2031
- 8.1. Market Analysis, Insights and Forecast - by Product Type
- 8.1.1. Weir
- 8.1.2. Straight-way
- 8.2. Market Analysis, Insights and Forecast - by End-user Vertical
- 8.2.1. Chemical
- 8.2.2. Food and Beverage
- 8.2.3. Water Treatment
- 8.2.4. Power
- 8.2.5. Pharmaceutical
- 8.2.6. Other End-user Verticals
- 8.1. Market Analysis, Insights and Forecast - by Product Type
- 9. Rest of the World Diaphragm Valve Industry Analysis, Insights and Forecast, 2019-2031
- 9.1. Market Analysis, Insights and Forecast - by Product Type
- 9.1.1. Weir
- 9.1.2. Straight-way
- 9.2. Market Analysis, Insights and Forecast - by End-user Vertical
- 9.2.1. Chemical
- 9.2.2. Food and Beverage
- 9.2.3. Water Treatment
- 9.2.4. Power
- 9.2.5. Pharmaceutical
- 9.2.6. Other End-user Verticals
- 9.1. Market Analysis, Insights and Forecast - by Product Type
- 10. North America Diaphragm Valve Industry Analysis, Insights and Forecast, 2019-2031
- 10.1. Market Analysis, Insights and Forecast - By Country/Sub-region
- 10.1.1 United States
- 10.1.2 Canada
- 10.1.3 Mexico
- 11. Europe Diaphragm Valve Industry Analysis, Insights and Forecast, 2019-2031
- 11.1. Market Analysis, Insights and Forecast - By Country/Sub-region
- 11.1.1 Germany
- 11.1.2 United Kingdom
- 11.1.3 France
- 11.1.4 Spain
- 11.1.5 Italy
- 11.1.6 Spain
- 11.1.7 Belgium
- 11.1.8 Netherland
- 11.1.9 Nordics
- 11.1.10 Rest of Europe
- 12. Asia Pacific Diaphragm Valve Industry Analysis, Insights and Forecast, 2019-2031
- 12.1. Market Analysis, Insights and Forecast - By Country/Sub-region
- 12.1.1 China
- 12.1.2 Japan
- 12.1.3 India
- 12.1.4 South Korea
- 12.1.5 Southeast Asia
- 12.1.6 Australia
- 12.1.7 Indonesia
- 12.1.8 Phillipes
- 12.1.9 Singapore
- 12.1.10 Thailandc
- 12.1.11 Rest of Asia Pacific
- 13. South America Diaphragm Valve Industry Analysis, Insights and Forecast, 2019-2031
- 13.1. Market Analysis, Insights and Forecast - By Country/Sub-region
- 13.1.1 Brazil
- 13.1.2 Argentina
- 13.1.3 Peru
- 13.1.4 Chile
- 13.1.5 Colombia
- 13.1.6 Ecuador
- 13.1.7 Venezuela
- 13.1.8 Rest of South America
- 14. North America Diaphragm Valve Industry Analysis, Insights and Forecast, 2019-2031
- 14.1. Market Analysis, Insights and Forecast - By Country/Sub-region
- 14.1.1 United States
- 14.1.2 Canada
- 14.1.3 Mexico
- 15. MEA Diaphragm Valve Industry Analysis, Insights and Forecast, 2019-2031
- 15.1. Market Analysis, Insights and Forecast - By Country/Sub-region
- 15.1.1 United Arab Emirates
- 15.1.2 Saudi Arabia
- 15.1.3 South Africa
- 15.1.4 Rest of Middle East and Africa
- 16. Competitive Analysis
- 16.1. Global Market Share Analysis 2024
- 16.2. Company Profiles
- 16.2.1 LK Valves AB
- 16.2.1.1. Overview
- 16.2.1.2. Products
- 16.2.1.3. SWOT Analysis
- 16.2.1.4. Recent Developments
- 16.2.1.5. Financials (Based on Availability)
- 16.2.2 Parker Hannifin Corporation
- 16.2.2.1. Overview
- 16.2.2.2. Products
- 16.2.2.3. SWOT Analysis
- 16.2.2.4. Recent Developments
- 16.2.2.5. Financials (Based on Availability)
- 16.2.3 Formatura Iniezione Polimeri S p A
- 16.2.3.1. Overview
- 16.2.3.2. Products
- 16.2.3.3. SWOT Analysis
- 16.2.3.4. Recent Developments
- 16.2.3.5. Financials (Based on Availability)
- 16.2.4 GEMÜ Gebr Müller Apparatebau GmbH & Co KG
- 16.2.4.1. Overview
- 16.2.4.2. Products
- 16.2.4.3. SWOT Analysis
- 16.2.4.4. Recent Developments
- 16.2.4.5. Financials (Based on Availability)
- 16.2.5 Emerson Electric Co
- 16.2.5.1. Overview
- 16.2.5.2. Products
- 16.2.5.3. SWOT Analysis
- 16.2.5.4. Recent Developments
- 16.2.5.5. Financials (Based on Availability)
- 16.2.6 Asahi/America Inc
- 16.2.6.1. Overview
- 16.2.6.2. Products
- 16.2.6.3. SWOT Analysis
- 16.2.6.4. Recent Developments
- 16.2.6.5. Financials (Based on Availability)
- 16.2.7 CRANE ChemPharma & Energy
- 16.2.7.1. Overview
- 16.2.7.2. Products
- 16.2.7.3. SWOT Analysis
- 16.2.7.4. Recent Developments
- 16.2.7.5. Financials (Based on Availability)
- 16.2.8 ITT Inc
- 16.2.8.1. Overview
- 16.2.8.2. Products
- 16.2.8.3. SWOT Analysis
- 16.2.8.4. Recent Developments
- 16.2.8.5. Financials (Based on Availability)
- 16.2.9 Nippon Daiya Valve Co Ltd
- 16.2.9.1. Overview
- 16.2.9.2. Products
- 16.2.9.3. SWOT Analysis
- 16.2.9.4. Recent Developments
- 16.2.9.5. Financials (Based on Availability)
- 16.2.10 Hy-Lok USA
- 16.2.10.1. Overview
- 16.2.10.2. Products
- 16.2.10.3. SWOT Analysis
- 16.2.10.4. Recent Developments
- 16.2.10.5. Financials (Based on Availability)
- 16.2.11 Aira Euro Automation Pvt Ltd
- 16.2.11.1. Overview
- 16.2.11.2. Products
- 16.2.11.3. SWOT Analysis
- 16.2.11.4. Recent Developments
- 16.2.11.5. Financials (Based on Availability)
- 16.2.12 Erhard GmbH & Co KG
- 16.2.12.1. Overview
- 16.2.12.2. Products
- 16.2.12.3. SWOT Analysis
- 16.2.12.4. Recent Developments
- 16.2.12.5. Financials (Based on Availability)
- 16.2.13 The Weir Group plc
- 16.2.13.1. Overview
- 16.2.13.2. Products
- 16.2.13.3. SWOT Analysis
- 16.2.13.4. Recent Developments
- 16.2.13.5. Financials (Based on Availability)
- 16.2.14 Pentair PLC
- 16.2.14.1. Overview
- 16.2.14.2. Products
- 16.2.14.3. SWOT Analysis
- 16.2.14.4. Recent Developments
- 16.2.14.5. Financials (Based on Availability)
- 16.2.1 LK Valves AB
List of Figures
- Figure 1: Global Diaphragm Valve Industry Revenue Breakdown (Million, %) by Region 2024 & 2032
- Figure 2: North America Diaphragm Valve Industry Revenue (Million), by Country 2024 & 2032
- Figure 3: North America Diaphragm Valve Industry Revenue Share (%), by Country 2024 & 2032
- Figure 4: Europe Diaphragm Valve Industry Revenue (Million), by Country 2024 & 2032
- Figure 5: Europe Diaphragm Valve Industry Revenue Share (%), by Country 2024 & 2032
- Figure 6: Asia Pacific Diaphragm Valve Industry Revenue (Million), by Country 2024 & 2032
- Figure 7: Asia Pacific Diaphragm Valve Industry Revenue Share (%), by Country 2024 & 2032
- Figure 8: South America Diaphragm Valve Industry Revenue (Million), by Country 2024 & 2032
- Figure 9: South America Diaphragm Valve Industry Revenue Share (%), by Country 2024 & 2032
- Figure 10: North America Diaphragm Valve Industry Revenue (Million), by Country 2024 & 2032
- Figure 11: North America Diaphragm Valve Industry Revenue Share (%), by Country 2024 & 2032
- Figure 12: MEA Diaphragm Valve Industry Revenue (Million), by Country 2024 & 2032
- Figure 13: MEA Diaphragm Valve Industry Revenue Share (%), by Country 2024 & 2032
- Figure 14: North America Diaphragm Valve Industry Revenue (Million), by Product Type 2024 & 2032
- Figure 15: North America Diaphragm Valve Industry Revenue Share (%), by Product Type 2024 & 2032
- Figure 16: North America Diaphragm Valve Industry Revenue (Million), by End-user Vertical 2024 & 2032
- Figure 17: North America Diaphragm Valve Industry Revenue Share (%), by End-user Vertical 2024 & 2032
- Figure 18: North America Diaphragm Valve Industry Revenue (Million), by Country 2024 & 2032
- Figure 19: North America Diaphragm Valve Industry Revenue Share (%), by Country 2024 & 2032
- Figure 20: Europe Diaphragm Valve Industry Revenue (Million), by Product Type 2024 & 2032
- Figure 21: Europe Diaphragm Valve Industry Revenue Share (%), by Product Type 2024 & 2032
- Figure 22: Europe Diaphragm Valve Industry Revenue (Million), by End-user Vertical 2024 & 2032
- Figure 23: Europe Diaphragm Valve Industry Revenue Share (%), by End-user Vertical 2024 & 2032
- Figure 24: Europe Diaphragm Valve Industry Revenue (Million), by Country 2024 & 2032
- Figure 25: Europe Diaphragm Valve Industry Revenue Share (%), by Country 2024 & 2032
- Figure 26: Asia Pacific Diaphragm Valve Industry Revenue (Million), by Product Type 2024 & 2032
- Figure 27: Asia Pacific Diaphragm Valve Industry Revenue Share (%), by Product Type 2024 & 2032
- Figure 28: Asia Pacific Diaphragm Valve Industry Revenue (Million), by End-user Vertical 2024 & 2032
- Figure 29: Asia Pacific Diaphragm Valve Industry Revenue Share (%), by End-user Vertical 2024 & 2032
- Figure 30: Asia Pacific Diaphragm Valve Industry Revenue (Million), by Country 2024 & 2032
- Figure 31: Asia Pacific Diaphragm Valve Industry Revenue Share (%), by Country 2024 & 2032
- Figure 32: Rest of the World Diaphragm Valve Industry Revenue (Million), by Product Type 2024 & 2032
- Figure 33: Rest of the World Diaphragm Valve Industry Revenue Share (%), by Product Type 2024 & 2032
- Figure 34: Rest of the World Diaphragm Valve Industry Revenue (Million), by End-user Vertical 2024 & 2032
- Figure 35: Rest of the World Diaphragm Valve Industry Revenue Share (%), by End-user Vertical 2024 & 2032
- Figure 36: Rest of the World Diaphragm Valve Industry Revenue (Million), by Country 2024 & 2032
- Figure 37: Rest of the World Diaphragm Valve Industry Revenue Share (%), by Country 2024 & 2032
List of Tables
- Table 1: Global Diaphragm Valve Industry Revenue Million Forecast, by Region 2019 & 2032
- Table 2: Global Diaphragm Valve Industry Revenue Million Forecast, by Product Type 2019 & 2032
- Table 3: Global Diaphragm Valve Industry Revenue Million Forecast, by End-user Vertical 2019 & 2032
- Table 4: Global Diaphragm Valve Industry Revenue Million Forecast, by Region 2019 & 2032
- Table 5: Global Diaphragm Valve Industry Revenue Million Forecast, by Country 2019 & 2032
- Table 6: United States Diaphragm Valve Industry Revenue (Million) Forecast, by Application 2019 & 2032
- Table 7: Canada Diaphragm Valve Industry Revenue (Million) Forecast, by Application 2019 & 2032
- Table 8: Mexico Diaphragm Valve Industry Revenue (Million) Forecast, by Application 2019 & 2032
- Table 9: Global Diaphragm Valve Industry Revenue Million Forecast, by Country 2019 & 2032
- Table 10: Germany Diaphragm Valve Industry Revenue (Million) Forecast, by Application 2019 & 2032
- Table 11: United Kingdom Diaphragm Valve Industry Revenue (Million) Forecast, by Application 2019 & 2032
- Table 12: France Diaphragm Valve Industry Revenue (Million) Forecast, by Application 2019 & 2032
- Table 13: Spain Diaphragm Valve Industry Revenue (Million) Forecast, by Application 2019 & 2032
- Table 14: Italy Diaphragm Valve Industry Revenue (Million) Forecast, by Application 2019 & 2032
- Table 15: Spain Diaphragm Valve Industry Revenue (Million) Forecast, by Application 2019 & 2032
- Table 16: Belgium Diaphragm Valve Industry Revenue (Million) Forecast, by Application 2019 & 2032
- Table 17: Netherland Diaphragm Valve Industry Revenue (Million) Forecast, by Application 2019 & 2032
- Table 18: Nordics Diaphragm Valve Industry Revenue (Million) Forecast, by Application 2019 & 2032
- Table 19: Rest of Europe Diaphragm Valve Industry Revenue (Million) Forecast, by Application 2019 & 2032
- Table 20: Global Diaphragm Valve Industry Revenue Million Forecast, by Country 2019 & 2032
- Table 21: China Diaphragm Valve Industry Revenue (Million) Forecast, by Application 2019 & 2032
- Table 22: Japan Diaphragm Valve Industry Revenue (Million) Forecast, by Application 2019 & 2032
- Table 23: India Diaphragm Valve Industry Revenue (Million) Forecast, by Application 2019 & 2032
- Table 24: South Korea Diaphragm Valve Industry Revenue (Million) Forecast, by Application 2019 & 2032
- Table 25: Southeast Asia Diaphragm Valve Industry Revenue (Million) Forecast, by Application 2019 & 2032
- Table 26: Australia Diaphragm Valve Industry Revenue (Million) Forecast, by Application 2019 & 2032
- Table 27: Indonesia Diaphragm Valve Industry Revenue (Million) Forecast, by Application 2019 & 2032
- Table 28: Phillipes Diaphragm Valve Industry Revenue (Million) Forecast, by Application 2019 & 2032
- Table 29: Singapore Diaphragm Valve Industry Revenue (Million) Forecast, by Application 2019 & 2032
- Table 30: Thailandc Diaphragm Valve Industry Revenue (Million) Forecast, by Application 2019 & 2032
- Table 31: Rest of Asia Pacific Diaphragm Valve Industry Revenue (Million) Forecast, by Application 2019 & 2032
- Table 32: Global Diaphragm Valve Industry Revenue Million Forecast, by Country 2019 & 2032
- Table 33: Brazil Diaphragm Valve Industry Revenue (Million) Forecast, by Application 2019 & 2032
- Table 34: Argentina Diaphragm Valve Industry Revenue (Million) Forecast, by Application 2019 & 2032
- Table 35: Peru Diaphragm Valve Industry Revenue (Million) Forecast, by Application 2019 & 2032
- Table 36: Chile Diaphragm Valve Industry Revenue (Million) Forecast, by Application 2019 & 2032
- Table 37: Colombia Diaphragm Valve Industry Revenue (Million) Forecast, by Application 2019 & 2032
- Table 38: Ecuador Diaphragm Valve Industry Revenue (Million) Forecast, by Application 2019 & 2032
- Table 39: Venezuela Diaphragm Valve Industry Revenue (Million) Forecast, by Application 2019 & 2032
- Table 40: Rest of South America Diaphragm Valve Industry Revenue (Million) Forecast, by Application 2019 & 2032
- Table 41: Global Diaphragm Valve Industry Revenue Million Forecast, by Country 2019 & 2032
- Table 42: United States Diaphragm Valve Industry Revenue (Million) Forecast, by Application 2019 & 2032
- Table 43: Canada Diaphragm Valve Industry Revenue (Million) Forecast, by Application 2019 & 2032
- Table 44: Mexico Diaphragm Valve Industry Revenue (Million) Forecast, by Application 2019 & 2032
- Table 45: Global Diaphragm Valve Industry Revenue Million Forecast, by Country 2019 & 2032
- Table 46: United Arab Emirates Diaphragm Valve Industry Revenue (Million) Forecast, by Application 2019 & 2032
- Table 47: Saudi Arabia Diaphragm Valve Industry Revenue (Million) Forecast, by Application 2019 & 2032
- Table 48: South Africa Diaphragm Valve Industry Revenue (Million) Forecast, by Application 2019 & 2032
- Table 49: Rest of Middle East and Africa Diaphragm Valve Industry Revenue (Million) Forecast, by Application 2019 & 2032
- Table 50: Global Diaphragm Valve Industry Revenue Million Forecast, by Product Type 2019 & 2032
- Table 51: Global Diaphragm Valve Industry Revenue Million Forecast, by End-user Vertical 2019 & 2032
- Table 52: Global Diaphragm Valve Industry Revenue Million Forecast, by Country 2019 & 2032
- Table 53: Global Diaphragm Valve Industry Revenue Million Forecast, by Product Type 2019 & 2032
- Table 54: Global Diaphragm Valve Industry Revenue Million Forecast, by End-user Vertical 2019 & 2032
- Table 55: Global Diaphragm Valve Industry Revenue Million Forecast, by Country 2019 & 2032
- Table 56: Global Diaphragm Valve Industry Revenue Million Forecast, by Product Type 2019 & 2032
- Table 57: Global Diaphragm Valve Industry Revenue Million Forecast, by End-user Vertical 2019 & 2032
- Table 58: Global Diaphragm Valve Industry Revenue Million Forecast, by Country 2019 & 2032
- Table 59: Global Diaphragm Valve Industry Revenue Million Forecast, by Product Type 2019 & 2032
- Table 60: Global Diaphragm Valve Industry Revenue Million Forecast, by End-user Vertical 2019 & 2032
- Table 61: Global Diaphragm Valve Industry Revenue Million Forecast, by Country 2019 & 2032
Frequently Asked Questions
1. What is the projected Compound Annual Growth Rate (CAGR) of the Diaphragm Valve Industry?
The projected CAGR is approximately 7.50%.
2. Which companies are prominent players in the Diaphragm Valve Industry?
Key companies in the market include LK Valves AB, Parker Hannifin Corporation, Formatura Iniezione Polimeri S p A, GEMÜ Gebr Müller Apparatebau GmbH & Co KG, Emerson Electric Co, Asahi/America Inc, CRANE ChemPharma & Energy, ITT Inc, Nippon Daiya Valve Co Ltd, Hy-Lok USA, Aira Euro Automation Pvt Ltd, Erhard GmbH & Co KG, The Weir Group plc, Pentair PLC.
3. What are the main segments of the Diaphragm Valve Industry?
The market segments include Product Type, End-user Vertical.
4. Can you provide details about the market size?
The market size is estimated to be USD XX Million as of 2022.
5. What are some drivers contributing to market growth?
; Rising Demand for Radioactive Waste Management; Increasing Demand for Safe and Reliable Production.
6. What are the notable trends driving market growth?
Demand of Water Treatment to Drive the Market Demand.
7. Are there any restraints impacting market growth?
; Limiting Pressure and Temperatures and Experience Erosion.
8. Can you provide examples of recent developments in the market?
N/A
9. What pricing options are available for accessing the report?
Pricing options include single-user, multi-user, and enterprise licenses priced at USD 4750, USD 5250, and USD 8750 respectively.
10. Is the market size provided in terms of value or volume?
The market size is provided in terms of value, measured in Million.
11. Are there any specific market keywords associated with the report?
Yes, the market keyword associated with the report is "Diaphragm Valve Industry," which aids in identifying and referencing the specific market segment covered.
12. How do I determine which pricing option suits my needs best?
The pricing options vary based on user requirements and access needs. Individual users may opt for single-user licenses, while businesses requiring broader access may choose multi-user or enterprise licenses for cost-effective access to the report.
13. Are there any additional resources or data provided in the Diaphragm Valve Industry report?
While the report offers comprehensive insights, it's advisable to review the specific contents or supplementary materials provided to ascertain if additional resources or data are available.
14. How can I stay updated on further developments or reports in the Diaphragm Valve Industry?
To stay informed about further developments, trends, and reports in the Diaphragm Valve Industry, consider subscribing to industry newsletters, following relevant companies and organizations, or regularly checking reputable industry news sources and publications.
Methodology
Step 1 - Identification of Relevant Samples Size from Population Database


Step 2 - Approaches for Defining Global Market Size (Value, Volume* & Price*)

Note*: In applicable scenarios
Step 3 - Data Sources
Primary Research
- Web Analytics
- Survey Reports
- Research Institute
- Latest Research Reports
- Opinion Leaders
Secondary Research
- Annual Reports
- White Paper
- Latest Press Release
- Industry Association
- Paid Database
- Investor Presentations

Step 4 - Data Triangulation
Involves using different sources of information in order to increase the validity of a study
These sources are likely to be stakeholders in a program - participants, other researchers, program staff, other community members, and so on.
Then we put all data in single framework & apply various statistical tools to find out the dynamic on the market.
During the analysis stage, feedback from the stakeholder groups would be compared to determine areas of agreement as well as areas of divergence
