

Key Insights
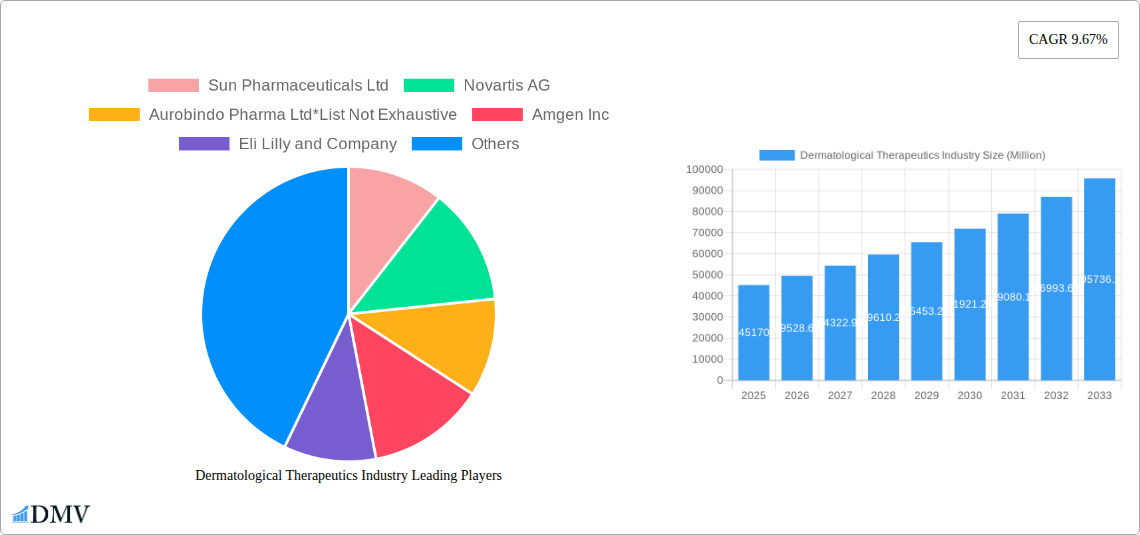
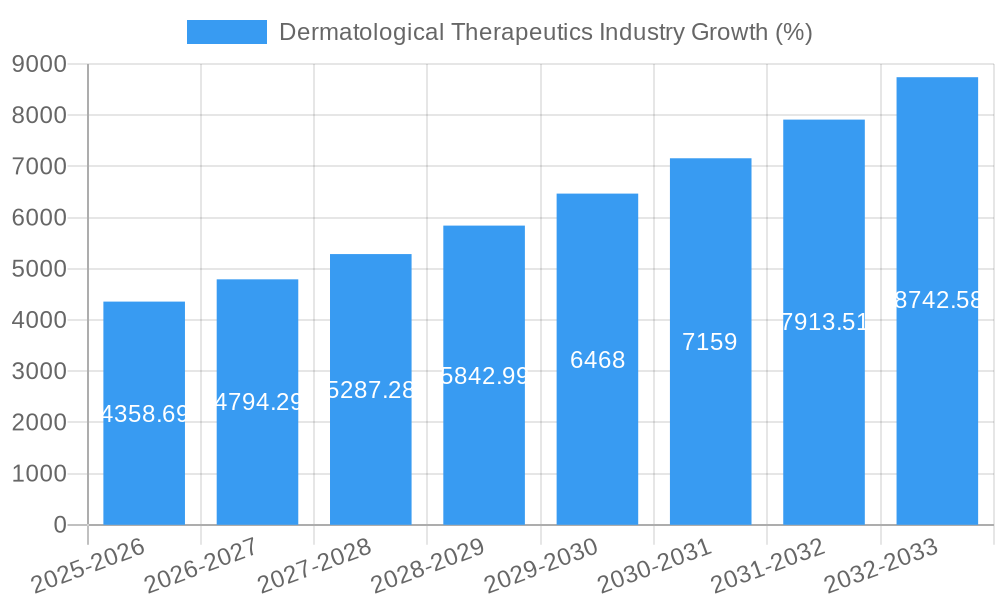
The dermatological therapeutics market, valued at $45.17 billion in 2025, is projected to experience robust growth, exhibiting a compound annual growth rate (CAGR) of 9.67% from 2025 to 2033. This expansion is driven by several key factors. Rising prevalence of skin diseases like atopic dermatitis, psoriasis, and acne, coupled with an increasing geriatric population susceptible to skin ailments, fuels market demand. Furthermore, the growing awareness of skin health and the rising disposable incomes in emerging economies are significantly contributing to market growth. Technological advancements in drug delivery systems, such as topical creams and ointments with improved efficacy and reduced side effects, are also playing a crucial role. The market is segmented by application (alopecia, herpes, psoriasis, rosacea, atopic dermatitis, and others) and drug class (anti-infectives, corticosteroids, anti-acne agents, calcineurin inhibitors, retinoids, and others), reflecting the diverse range of therapeutic approaches available. Major players like Johnson & Johnson, AbbVie, and Galderma, among others, are investing heavily in research and development, leading to the introduction of innovative therapies and contributing to market competitiveness.
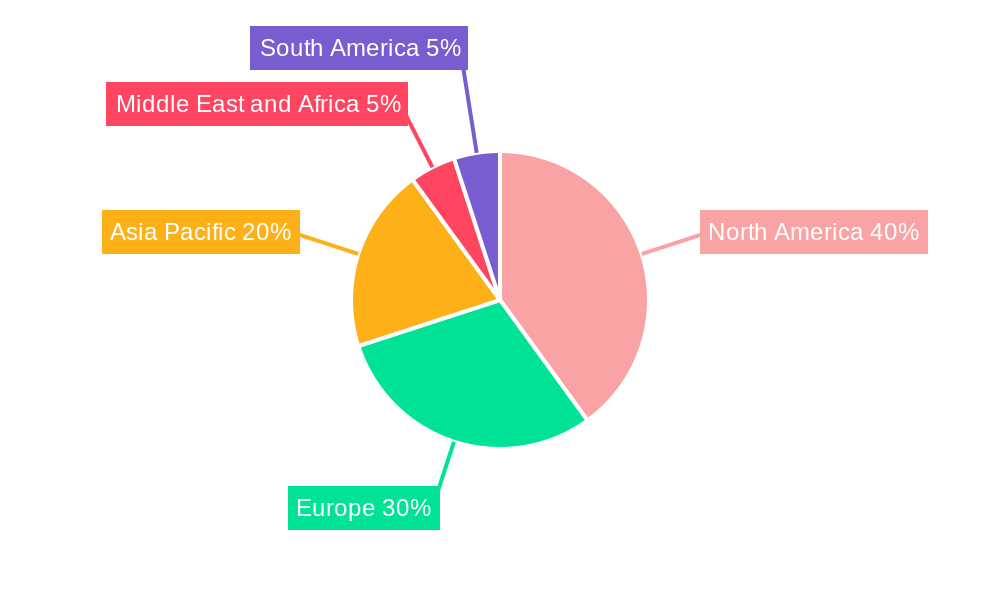
The market's geographical distribution reveals significant regional variations. North America, currently holding a substantial market share due to high healthcare expenditure and advanced medical infrastructure, is expected to maintain its leading position. However, the Asia-Pacific region, characterized by a burgeoning population and rising healthcare awareness, is poised for substantial growth in the coming years. Europe and other regions will also contribute significantly, driven by increasing prevalence of dermatological conditions and expanding healthcare access. While the market faces challenges such as stringent regulatory approvals and the potential for generic competition, the overall outlook remains positive, indicating substantial growth opportunities for pharmaceutical companies involved in dermatological therapeutics throughout the forecast period. The continued innovation in treatment options and the escalating demand for effective skin health solutions will remain key growth drivers in this dynamic market sector.
Dermatological Therapeutics Industry: A Comprehensive Market Report (2019-2033)
This insightful report provides a detailed analysis of the global dermatological therapeutics market, encompassing historical data (2019-2024), current estimations (2025), and future projections (2025-2033). Valued at xx Million in 2025, the market is poised for significant growth, driven by factors detailed within. This report is essential for stakeholders seeking a comprehensive understanding of market dynamics, competitive landscapes, and future opportunities within this rapidly evolving sector.
Dermatological Therapeutics Industry Market Composition & Trends
The dermatological therapeutics market is a dynamic landscape characterized by moderate concentration, with key players such as Sun Pharmaceuticals Ltd, Novartis AG, and Aurobindo Pharma Ltd holding significant market share, although the market also includes many smaller players. Market share distribution varies significantly across different drug classes and applications. The market exhibits continuous innovation, fueled by the unmet needs of patients with various dermatological conditions. Stringent regulatory landscapes, particularly in developed markets, influence product approvals and market entry. Substitute products, including traditional remedies and over-the-counter treatments, exert competitive pressure. End-users primarily comprise dermatologists, hospitals, and clinics, along with patients. M&A activity has been significant, with deal values reaching xx Million in recent years, reflecting industry consolidation and expansion strategies.
- Market Concentration: Moderate, with a few dominant players.
- Innovation Catalysts: Unmet clinical needs, technological advancements in drug delivery.
- Regulatory Landscape: Stringent, particularly in the US and EU.
- Substitute Products: Over-the-counter medications, traditional treatments.
- End-User Profile: Dermatologists, hospitals, clinics, and patients.
- M&A Activity: Significant, with deal values totaling xx Million (2019-2024).
Dermatological Therapeutics Industry Industry Evolution
The dermatological therapeutics market has experienced robust growth over the past few years, driven by rising prevalence of skin diseases, increased healthcare expenditure, and the introduction of innovative therapies. The market shows a compound annual growth rate (CAGR) of xx% during the historical period (2019-2024) and is projected to maintain a CAGR of xx% during the forecast period (2025-2033). This growth is fueled by technological advancements in drug delivery systems (e.g., topical formulations, targeted therapies), leading to improved efficacy and patient compliance. Furthermore, a growing awareness of dermatological conditions and improved access to healthcare services have significantly impacted market expansion. The adoption of biologics and novel therapies continues to increase, though cost remains a challenge for widespread access in some markets.
Leading Regions, Countries, or Segments in Dermatological Therapeutics Industry
North America and Europe currently dominate the global dermatological therapeutics market, largely due to high healthcare expenditure, advanced healthcare infrastructure, and a high prevalence of skin diseases like psoriasis and atopic dermatitis. Within applications, psoriasis and atopic dermatitis represent significant segments, showing high growth rates. The anti-infective and corticosteroid drug classes hold considerable market share, while newer drug classes like calcineurin inhibitors and biologics are experiencing rapid growth.
- Key Drivers (North America & Europe): High healthcare expenditure, advanced healthcare infrastructure, high disease prevalence, robust regulatory support for innovative therapies, significant investment in R&D.
- Psoriasis & Atopic Dermatitis: High prevalence, unmet needs drive market growth in these segments.
- Anti-infectives & Corticosteroids: Established drug classes with significant market share.
- Calcineurin Inhibitors & Biologics: Emerging segments with high growth potential.
Dermatological Therapeutics Industry Product Innovations
Recent years have witnessed the launch of several innovative dermatological therapeutics, including novel biologics, targeted therapies, and improved topical formulations. These advancements offer enhanced efficacy, improved safety profiles, and reduced side effects compared to older generations of treatments. Unique selling propositions often revolve around targeted mechanisms of action, improved tolerability, and convenient administration routes. The integration of digital technologies in patient care and treatment monitoring is also contributing to product innovation within the market.
Propelling Factors for Dermatological Therapeutics Industry Growth
The growth of the dermatological therapeutics market is driven by several key factors: The rising prevalence of skin disorders globally, increased awareness and diagnosis rates, the development of novel and more effective treatments, such as targeted therapies and biologics. Government initiatives and supportive regulatory frameworks encouraging research and development also contribute. Growing healthcare expenditure and improved access to healthcare are further drivers.
Obstacles in the Dermatological Therapeutics Industry Market
Challenges facing the dermatological therapeutics market include stringent regulatory approvals, which can delay the market entry of new products. High research and development costs can hinder the development of new therapies. Patent expirations and generic competition may create price pressures. Supply chain disruptions can also impact the availability and affordability of treatments.
Future Opportunities in Dermatological Therapeutics Industry
Future opportunities exist in the development of personalized medicine approaches for dermatological conditions, exploration of new drug targets and therapeutic modalities, expansion into emerging markets with high unmet needs, development of novel drug delivery systems, and the integration of digital health technologies for improved patient care and treatment monitoring.
Major Players in the Dermatological Therapeutics Industry Ecosystem
- Sun Pharmaceuticals Ltd
- Novartis AG
- Aurobindo Pharma Ltd
- Amgen Inc
- Eli Lilly and Company
- Galderma SA
- Abbvie Inc (Allergan PLC)
- Almirall SA
- Johnson & Johnson
- Bausch Health Companies Inc
- LEO Pharma AS
- Aclaris Therapeutics Inc
- Bristol-Myers Squibb Company
- GlaxoSmithKline PLC
- Pfizer Inc
Key Developments in Dermatological Therapeutics Industry Industry
- September 2022: US FDA approval of Sotyktu (deucravacitinib) for moderate-to-severe plaque psoriasis. This significantly expands treatment options for this prevalent condition.
- July 2022: FDA approval of roflumilast cream (ZORYVE) for plaque psoriasis in patients aged 12 and above. This provides a new topical treatment option.
- January 2022: FDA approval of Abbvie's Rinvoq for refractory, moderate-to-severe atopic dermatitis in patients aged 12 and older. This addresses a significant unmet need in atopic dermatitis management.
Strategic Dermatological Therapeutics Industry Market Forecast
The dermatological therapeutics market is projected to experience robust growth over the forecast period, driven by several factors including the increasing prevalence of skin diseases, the development and launch of innovative therapies, and the continued expansion of the global healthcare sector. Significant opportunities lie in the development of targeted therapies, personalized medicine approaches, and improved drug delivery systems. The market's future is bright, with strong potential for continued growth and innovation.
Dermatological Therapeutics Industry Segmentation
-
1. Application
- 1.1. Alopecia
- 1.2. Herpes
- 1.3. Psoriasis
- 1.4. Rosacea
- 1.5. Atopic Dermatitis
- 1.6. Other Applications
-
2. Drug Class
- 2.1. Anti-infectives
- 2.2. Corticosteroids
- 2.3. Anti-acne
- 2.4. Calcineurin Inhibitors
- 2.5. Retinoids
- 2.6. Other Drug Classes
Dermatological Therapeutics Industry Segmentation By Geography
-
1. North America
- 1.1. United States
- 1.2. Canada
- 1.3. Mexico
-
2. Europe
- 2.1. Germany
- 2.2. United Kingdom
- 2.3. France
- 2.4. Italy
- 2.5. Spain
- 2.6. Rest of Europe
-
3. Asia Pacific
- 3.1. China
- 3.2. Japan
- 3.3. India
- 3.4. Australia
- 3.5. South Korea
- 3.6. Rest of Asia Pacific
-
4. Middle East and Africa
- 4.1. GCC
- 4.2. South Africa
- 4.3. Rest of Middle East and Africa
-
5. South America
- 5.1. Brazil
- 5.2. Argentina
- 5.3. Rest of South America
Dermatological Therapeutics Industry REPORT HIGHLIGHTS
| Aspects | Details |
|---|---|
| Study Period | 2019-2033 |
| Base Year | 2024 |
| Estimated Year | 2025 |
| Forecast Period | 2025-2033 |
| Historical Period | 2019-2024 |
| Growth Rate | CAGR of 9.67% from 2019-2033 |
| Segmentation |
|
Table of Contents
- 1. Introduction
- 1.1. Research Scope
- 1.2. Market Segmentation
- 1.3. Research Methodology
- 1.4. Definitions and Assumptions
- 2. Executive Summary
- 2.1. Introduction
- 3. Market Dynamics
- 3.1. Introduction
- 3.2. Market Drivers
- 3.2.1. Growing Burden of Dermatology Diseases; Increasing Awareness Levels of Disease Progression and Etiology; Increasing Elderly Population
- 3.3. Market Restrains
- 3.3.1. Serious Side Effects for Certain Classes of Therapeutic Drugs
- 3.4. Market Trends
- 3.4.1. Psoriasis Segment is Expected to Hold a Significant Market Share Over the Forecast Period
- 4. Market Factor Analysis
- 4.1. Porters Five Forces
- 4.2. Supply/Value Chain
- 4.3. PESTEL analysis
- 4.4. Market Entropy
- 4.5. Patent/Trademark Analysis
- 5. Global Dermatological Therapeutics Industry Analysis, Insights and Forecast, 2019-2031
- 5.1. Market Analysis, Insights and Forecast - by Application
- 5.1.1. Alopecia
- 5.1.2. Herpes
- 5.1.3. Psoriasis
- 5.1.4. Rosacea
- 5.1.5. Atopic Dermatitis
- 5.1.6. Other Applications
- 5.2. Market Analysis, Insights and Forecast - by Drug Class
- 5.2.1. Anti-infectives
- 5.2.2. Corticosteroids
- 5.2.3. Anti-acne
- 5.2.4. Calcineurin Inhibitors
- 5.2.5. Retinoids
- 5.2.6. Other Drug Classes
- 5.3. Market Analysis, Insights and Forecast - by Region
- 5.3.1. North America
- 5.3.2. Europe
- 5.3.3. Asia Pacific
- 5.3.4. Middle East and Africa
- 5.3.5. South America
- 5.1. Market Analysis, Insights and Forecast - by Application
- 6. North America Dermatological Therapeutics Industry Analysis, Insights and Forecast, 2019-2031
- 6.1. Market Analysis, Insights and Forecast - by Application
- 6.1.1. Alopecia
- 6.1.2. Herpes
- 6.1.3. Psoriasis
- 6.1.4. Rosacea
- 6.1.5. Atopic Dermatitis
- 6.1.6. Other Applications
- 6.2. Market Analysis, Insights and Forecast - by Drug Class
- 6.2.1. Anti-infectives
- 6.2.2. Corticosteroids
- 6.2.3. Anti-acne
- 6.2.4. Calcineurin Inhibitors
- 6.2.5. Retinoids
- 6.2.6. Other Drug Classes
- 6.1. Market Analysis, Insights and Forecast - by Application
- 7. Europe Dermatological Therapeutics Industry Analysis, Insights and Forecast, 2019-2031
- 7.1. Market Analysis, Insights and Forecast - by Application
- 7.1.1. Alopecia
- 7.1.2. Herpes
- 7.1.3. Psoriasis
- 7.1.4. Rosacea
- 7.1.5. Atopic Dermatitis
- 7.1.6. Other Applications
- 7.2. Market Analysis, Insights and Forecast - by Drug Class
- 7.2.1. Anti-infectives
- 7.2.2. Corticosteroids
- 7.2.3. Anti-acne
- 7.2.4. Calcineurin Inhibitors
- 7.2.5. Retinoids
- 7.2.6. Other Drug Classes
- 7.1. Market Analysis, Insights and Forecast - by Application
- 8. Asia Pacific Dermatological Therapeutics Industry Analysis, Insights and Forecast, 2019-2031
- 8.1. Market Analysis, Insights and Forecast - by Application
- 8.1.1. Alopecia
- 8.1.2. Herpes
- 8.1.3. Psoriasis
- 8.1.4. Rosacea
- 8.1.5. Atopic Dermatitis
- 8.1.6. Other Applications
- 8.2. Market Analysis, Insights and Forecast - by Drug Class
- 8.2.1. Anti-infectives
- 8.2.2. Corticosteroids
- 8.2.3. Anti-acne
- 8.2.4. Calcineurin Inhibitors
- 8.2.5. Retinoids
- 8.2.6. Other Drug Classes
- 8.1. Market Analysis, Insights and Forecast - by Application
- 9. Middle East and Africa Dermatological Therapeutics Industry Analysis, Insights and Forecast, 2019-2031
- 9.1. Market Analysis, Insights and Forecast - by Application
- 9.1.1. Alopecia
- 9.1.2. Herpes
- 9.1.3. Psoriasis
- 9.1.4. Rosacea
- 9.1.5. Atopic Dermatitis
- 9.1.6. Other Applications
- 9.2. Market Analysis, Insights and Forecast - by Drug Class
- 9.2.1. Anti-infectives
- 9.2.2. Corticosteroids
- 9.2.3. Anti-acne
- 9.2.4. Calcineurin Inhibitors
- 9.2.5. Retinoids
- 9.2.6. Other Drug Classes
- 9.1. Market Analysis, Insights and Forecast - by Application
- 10. South America Dermatological Therapeutics Industry Analysis, Insights and Forecast, 2019-2031
- 10.1. Market Analysis, Insights and Forecast - by Application
- 10.1.1. Alopecia
- 10.1.2. Herpes
- 10.1.3. Psoriasis
- 10.1.4. Rosacea
- 10.1.5. Atopic Dermatitis
- 10.1.6. Other Applications
- 10.2. Market Analysis, Insights and Forecast - by Drug Class
- 10.2.1. Anti-infectives
- 10.2.2. Corticosteroids
- 10.2.3. Anti-acne
- 10.2.4. Calcineurin Inhibitors
- 10.2.5. Retinoids
- 10.2.6. Other Drug Classes
- 10.1. Market Analysis, Insights and Forecast - by Application
- 11. North America Dermatological Therapeutics Industry Analysis, Insights and Forecast, 2019-2031
- 11.1. Market Analysis, Insights and Forecast - By Country/Sub-region
- 11.1.1 United States
- 11.1.2 Canada
- 11.1.3 Mexico
- 12. Europe Dermatological Therapeutics Industry Analysis, Insights and Forecast, 2019-2031
- 12.1. Market Analysis, Insights and Forecast - By Country/Sub-region
- 12.1.1 Germany
- 12.1.2 United Kingdom
- 12.1.3 France
- 12.1.4 Italy
- 12.1.5 Spain
- 12.1.6 Rest of Europe
- 13. Asia Pacific Dermatological Therapeutics Industry Analysis, Insights and Forecast, 2019-2031
- 13.1. Market Analysis, Insights and Forecast - By Country/Sub-region
- 13.1.1 China
- 13.1.2 Japan
- 13.1.3 India
- 13.1.4 Australia
- 13.1.5 South Korea
- 13.1.6 Rest of Asia Pacific
- 14. Middle East and Africa Dermatological Therapeutics Industry Analysis, Insights and Forecast, 2019-2031
- 14.1. Market Analysis, Insights and Forecast - By Country/Sub-region
- 14.1.1 GCC
- 14.1.2 South Africa
- 14.1.3 Rest of Middle East and Africa
- 15. South America Dermatological Therapeutics Industry Analysis, Insights and Forecast, 2019-2031
- 15.1. Market Analysis, Insights and Forecast - By Country/Sub-region
- 15.1.1 Brazil
- 15.1.2 Argentina
- 15.1.3 Rest of South America
- 16. Competitive Analysis
- 16.1. Global Market Share Analysis 2024
- 16.2. Company Profiles
- 16.2.1 Sun Pharmaceuticals Ltd
- 16.2.1.1. Overview
- 16.2.1.2. Products
- 16.2.1.3. SWOT Analysis
- 16.2.1.4. Recent Developments
- 16.2.1.5. Financials (Based on Availability)
- 16.2.2 Novartis AG
- 16.2.2.1. Overview
- 16.2.2.2. Products
- 16.2.2.3. SWOT Analysis
- 16.2.2.4. Recent Developments
- 16.2.2.5. Financials (Based on Availability)
- 16.2.3 Aurobindo Pharma Ltd*List Not Exhaustive
- 16.2.3.1. Overview
- 16.2.3.2. Products
- 16.2.3.3. SWOT Analysis
- 16.2.3.4. Recent Developments
- 16.2.3.5. Financials (Based on Availability)
- 16.2.4 Amgen Inc
- 16.2.4.1. Overview
- 16.2.4.2. Products
- 16.2.4.3. SWOT Analysis
- 16.2.4.4. Recent Developments
- 16.2.4.5. Financials (Based on Availability)
- 16.2.5 Eli Lilly and Company
- 16.2.5.1. Overview
- 16.2.5.2. Products
- 16.2.5.3. SWOT Analysis
- 16.2.5.4. Recent Developments
- 16.2.5.5. Financials (Based on Availability)
- 16.2.6 Galderma SA
- 16.2.6.1. Overview
- 16.2.6.2. Products
- 16.2.6.3. SWOT Analysis
- 16.2.6.4. Recent Developments
- 16.2.6.5. Financials (Based on Availability)
- 16.2.7 Abbvie Inc (Allergan PLC)
- 16.2.7.1. Overview
- 16.2.7.2. Products
- 16.2.7.3. SWOT Analysis
- 16.2.7.4. Recent Developments
- 16.2.7.5. Financials (Based on Availability)
- 16.2.8 Almirall SA
- 16.2.8.1. Overview
- 16.2.8.2. Products
- 16.2.8.3. SWOT Analysis
- 16.2.8.4. Recent Developments
- 16.2.8.5. Financials (Based on Availability)
- 16.2.9 Johnson & Johnson
- 16.2.9.1. Overview
- 16.2.9.2. Products
- 16.2.9.3. SWOT Analysis
- 16.2.9.4. Recent Developments
- 16.2.9.5. Financials (Based on Availability)
- 16.2.10 Bausch Health Companies Inc
- 16.2.10.1. Overview
- 16.2.10.2. Products
- 16.2.10.3. SWOT Analysis
- 16.2.10.4. Recent Developments
- 16.2.10.5. Financials (Based on Availability)
- 16.2.11 LEO Pharma AS
- 16.2.11.1. Overview
- 16.2.11.2. Products
- 16.2.11.3. SWOT Analysis
- 16.2.11.4. Recent Developments
- 16.2.11.5. Financials (Based on Availability)
- 16.2.12 Aclaris Therapeutics Inc
- 16.2.12.1. Overview
- 16.2.12.2. Products
- 16.2.12.3. SWOT Analysis
- 16.2.12.4. Recent Developments
- 16.2.12.5. Financials (Based on Availability)
- 16.2.13 Bristol-Myers Squibb Company
- 16.2.13.1. Overview
- 16.2.13.2. Products
- 16.2.13.3. SWOT Analysis
- 16.2.13.4. Recent Developments
- 16.2.13.5. Financials (Based on Availability)
- 16.2.14 GlaxoSmithKline PLC
- 16.2.14.1. Overview
- 16.2.14.2. Products
- 16.2.14.3. SWOT Analysis
- 16.2.14.4. Recent Developments
- 16.2.14.5. Financials (Based on Availability)
- 16.2.15 Pfizer Inc
- 16.2.15.1. Overview
- 16.2.15.2. Products
- 16.2.15.3. SWOT Analysis
- 16.2.15.4. Recent Developments
- 16.2.15.5. Financials (Based on Availability)
- 16.2.1 Sun Pharmaceuticals Ltd
List of Figures
- Figure 1: Global Dermatological Therapeutics Industry Revenue Breakdown (Million, %) by Region 2024 & 2032
- Figure 2: North America Dermatological Therapeutics Industry Revenue (Million), by Country 2024 & 2032
- Figure 3: North America Dermatological Therapeutics Industry Revenue Share (%), by Country 2024 & 2032
- Figure 4: Europe Dermatological Therapeutics Industry Revenue (Million), by Country 2024 & 2032
- Figure 5: Europe Dermatological Therapeutics Industry Revenue Share (%), by Country 2024 & 2032
- Figure 6: Asia Pacific Dermatological Therapeutics Industry Revenue (Million), by Country 2024 & 2032
- Figure 7: Asia Pacific Dermatological Therapeutics Industry Revenue Share (%), by Country 2024 & 2032
- Figure 8: Middle East and Africa Dermatological Therapeutics Industry Revenue (Million), by Country 2024 & 2032
- Figure 9: Middle East and Africa Dermatological Therapeutics Industry Revenue Share (%), by Country 2024 & 2032
- Figure 10: South America Dermatological Therapeutics Industry Revenue (Million), by Country 2024 & 2032
- Figure 11: South America Dermatological Therapeutics Industry Revenue Share (%), by Country 2024 & 2032
- Figure 12: North America Dermatological Therapeutics Industry Revenue (Million), by Application 2024 & 2032
- Figure 13: North America Dermatological Therapeutics Industry Revenue Share (%), by Application 2024 & 2032
- Figure 14: North America Dermatological Therapeutics Industry Revenue (Million), by Drug Class 2024 & 2032
- Figure 15: North America Dermatological Therapeutics Industry Revenue Share (%), by Drug Class 2024 & 2032
- Figure 16: North America Dermatological Therapeutics Industry Revenue (Million), by Country 2024 & 2032
- Figure 17: North America Dermatological Therapeutics Industry Revenue Share (%), by Country 2024 & 2032
- Figure 18: Europe Dermatological Therapeutics Industry Revenue (Million), by Application 2024 & 2032
- Figure 19: Europe Dermatological Therapeutics Industry Revenue Share (%), by Application 2024 & 2032
- Figure 20: Europe Dermatological Therapeutics Industry Revenue (Million), by Drug Class 2024 & 2032
- Figure 21: Europe Dermatological Therapeutics Industry Revenue Share (%), by Drug Class 2024 & 2032
- Figure 22: Europe Dermatological Therapeutics Industry Revenue (Million), by Country 2024 & 2032
- Figure 23: Europe Dermatological Therapeutics Industry Revenue Share (%), by Country 2024 & 2032
- Figure 24: Asia Pacific Dermatological Therapeutics Industry Revenue (Million), by Application 2024 & 2032
- Figure 25: Asia Pacific Dermatological Therapeutics Industry Revenue Share (%), by Application 2024 & 2032
- Figure 26: Asia Pacific Dermatological Therapeutics Industry Revenue (Million), by Drug Class 2024 & 2032
- Figure 27: Asia Pacific Dermatological Therapeutics Industry Revenue Share (%), by Drug Class 2024 & 2032
- Figure 28: Asia Pacific Dermatological Therapeutics Industry Revenue (Million), by Country 2024 & 2032
- Figure 29: Asia Pacific Dermatological Therapeutics Industry Revenue Share (%), by Country 2024 & 2032
- Figure 30: Middle East and Africa Dermatological Therapeutics Industry Revenue (Million), by Application 2024 & 2032
- Figure 31: Middle East and Africa Dermatological Therapeutics Industry Revenue Share (%), by Application 2024 & 2032
- Figure 32: Middle East and Africa Dermatological Therapeutics Industry Revenue (Million), by Drug Class 2024 & 2032
- Figure 33: Middle East and Africa Dermatological Therapeutics Industry Revenue Share (%), by Drug Class 2024 & 2032
- Figure 34: Middle East and Africa Dermatological Therapeutics Industry Revenue (Million), by Country 2024 & 2032
- Figure 35: Middle East and Africa Dermatological Therapeutics Industry Revenue Share (%), by Country 2024 & 2032
- Figure 36: South America Dermatological Therapeutics Industry Revenue (Million), by Application 2024 & 2032
- Figure 37: South America Dermatological Therapeutics Industry Revenue Share (%), by Application 2024 & 2032
- Figure 38: South America Dermatological Therapeutics Industry Revenue (Million), by Drug Class 2024 & 2032
- Figure 39: South America Dermatological Therapeutics Industry Revenue Share (%), by Drug Class 2024 & 2032
- Figure 40: South America Dermatological Therapeutics Industry Revenue (Million), by Country 2024 & 2032
- Figure 41: South America Dermatological Therapeutics Industry Revenue Share (%), by Country 2024 & 2032
List of Tables
- Table 1: Global Dermatological Therapeutics Industry Revenue Million Forecast, by Region 2019 & 2032
- Table 2: Global Dermatological Therapeutics Industry Revenue Million Forecast, by Application 2019 & 2032
- Table 3: Global Dermatological Therapeutics Industry Revenue Million Forecast, by Drug Class 2019 & 2032
- Table 4: Global Dermatological Therapeutics Industry Revenue Million Forecast, by Region 2019 & 2032
- Table 5: Global Dermatological Therapeutics Industry Revenue Million Forecast, by Country 2019 & 2032
- Table 6: United States Dermatological Therapeutics Industry Revenue (Million) Forecast, by Application 2019 & 2032
- Table 7: Canada Dermatological Therapeutics Industry Revenue (Million) Forecast, by Application 2019 & 2032
- Table 8: Mexico Dermatological Therapeutics Industry Revenue (Million) Forecast, by Application 2019 & 2032
- Table 9: Global Dermatological Therapeutics Industry Revenue Million Forecast, by Country 2019 & 2032
- Table 10: Germany Dermatological Therapeutics Industry Revenue (Million) Forecast, by Application 2019 & 2032
- Table 11: United Kingdom Dermatological Therapeutics Industry Revenue (Million) Forecast, by Application 2019 & 2032
- Table 12: France Dermatological Therapeutics Industry Revenue (Million) Forecast, by Application 2019 & 2032
- Table 13: Italy Dermatological Therapeutics Industry Revenue (Million) Forecast, by Application 2019 & 2032
- Table 14: Spain Dermatological Therapeutics Industry Revenue (Million) Forecast, by Application 2019 & 2032
- Table 15: Rest of Europe Dermatological Therapeutics Industry Revenue (Million) Forecast, by Application 2019 & 2032
- Table 16: Global Dermatological Therapeutics Industry Revenue Million Forecast, by Country 2019 & 2032
- Table 17: China Dermatological Therapeutics Industry Revenue (Million) Forecast, by Application 2019 & 2032
- Table 18: Japan Dermatological Therapeutics Industry Revenue (Million) Forecast, by Application 2019 & 2032
- Table 19: India Dermatological Therapeutics Industry Revenue (Million) Forecast, by Application 2019 & 2032
- Table 20: Australia Dermatological Therapeutics Industry Revenue (Million) Forecast, by Application 2019 & 2032
- Table 21: South Korea Dermatological Therapeutics Industry Revenue (Million) Forecast, by Application 2019 & 2032
- Table 22: Rest of Asia Pacific Dermatological Therapeutics Industry Revenue (Million) Forecast, by Application 2019 & 2032
- Table 23: Global Dermatological Therapeutics Industry Revenue Million Forecast, by Country 2019 & 2032
- Table 24: GCC Dermatological Therapeutics Industry Revenue (Million) Forecast, by Application 2019 & 2032
- Table 25: South Africa Dermatological Therapeutics Industry Revenue (Million) Forecast, by Application 2019 & 2032
- Table 26: Rest of Middle East and Africa Dermatological Therapeutics Industry Revenue (Million) Forecast, by Application 2019 & 2032
- Table 27: Global Dermatological Therapeutics Industry Revenue Million Forecast, by Country 2019 & 2032
- Table 28: Brazil Dermatological Therapeutics Industry Revenue (Million) Forecast, by Application 2019 & 2032
- Table 29: Argentina Dermatological Therapeutics Industry Revenue (Million) Forecast, by Application 2019 & 2032
- Table 30: Rest of South America Dermatological Therapeutics Industry Revenue (Million) Forecast, by Application 2019 & 2032
- Table 31: Global Dermatological Therapeutics Industry Revenue Million Forecast, by Application 2019 & 2032
- Table 32: Global Dermatological Therapeutics Industry Revenue Million Forecast, by Drug Class 2019 & 2032
- Table 33: Global Dermatological Therapeutics Industry Revenue Million Forecast, by Country 2019 & 2032
- Table 34: United States Dermatological Therapeutics Industry Revenue (Million) Forecast, by Application 2019 & 2032
- Table 35: Canada Dermatological Therapeutics Industry Revenue (Million) Forecast, by Application 2019 & 2032
- Table 36: Mexico Dermatological Therapeutics Industry Revenue (Million) Forecast, by Application 2019 & 2032
- Table 37: Global Dermatological Therapeutics Industry Revenue Million Forecast, by Application 2019 & 2032
- Table 38: Global Dermatological Therapeutics Industry Revenue Million Forecast, by Drug Class 2019 & 2032
- Table 39: Global Dermatological Therapeutics Industry Revenue Million Forecast, by Country 2019 & 2032
- Table 40: Germany Dermatological Therapeutics Industry Revenue (Million) Forecast, by Application 2019 & 2032
- Table 41: United Kingdom Dermatological Therapeutics Industry Revenue (Million) Forecast, by Application 2019 & 2032
- Table 42: France Dermatological Therapeutics Industry Revenue (Million) Forecast, by Application 2019 & 2032
- Table 43: Italy Dermatological Therapeutics Industry Revenue (Million) Forecast, by Application 2019 & 2032
- Table 44: Spain Dermatological Therapeutics Industry Revenue (Million) Forecast, by Application 2019 & 2032
- Table 45: Rest of Europe Dermatological Therapeutics Industry Revenue (Million) Forecast, by Application 2019 & 2032
- Table 46: Global Dermatological Therapeutics Industry Revenue Million Forecast, by Application 2019 & 2032
- Table 47: Global Dermatological Therapeutics Industry Revenue Million Forecast, by Drug Class 2019 & 2032
- Table 48: Global Dermatological Therapeutics Industry Revenue Million Forecast, by Country 2019 & 2032
- Table 49: China Dermatological Therapeutics Industry Revenue (Million) Forecast, by Application 2019 & 2032
- Table 50: Japan Dermatological Therapeutics Industry Revenue (Million) Forecast, by Application 2019 & 2032
- Table 51: India Dermatological Therapeutics Industry Revenue (Million) Forecast, by Application 2019 & 2032
- Table 52: Australia Dermatological Therapeutics Industry Revenue (Million) Forecast, by Application 2019 & 2032
- Table 53: South Korea Dermatological Therapeutics Industry Revenue (Million) Forecast, by Application 2019 & 2032
- Table 54: Rest of Asia Pacific Dermatological Therapeutics Industry Revenue (Million) Forecast, by Application 2019 & 2032
- Table 55: Global Dermatological Therapeutics Industry Revenue Million Forecast, by Application 2019 & 2032
- Table 56: Global Dermatological Therapeutics Industry Revenue Million Forecast, by Drug Class 2019 & 2032
- Table 57: Global Dermatological Therapeutics Industry Revenue Million Forecast, by Country 2019 & 2032
- Table 58: GCC Dermatological Therapeutics Industry Revenue (Million) Forecast, by Application 2019 & 2032
- Table 59: South Africa Dermatological Therapeutics Industry Revenue (Million) Forecast, by Application 2019 & 2032
- Table 60: Rest of Middle East and Africa Dermatological Therapeutics Industry Revenue (Million) Forecast, by Application 2019 & 2032
- Table 61: Global Dermatological Therapeutics Industry Revenue Million Forecast, by Application 2019 & 2032
- Table 62: Global Dermatological Therapeutics Industry Revenue Million Forecast, by Drug Class 2019 & 2032
- Table 63: Global Dermatological Therapeutics Industry Revenue Million Forecast, by Country 2019 & 2032
- Table 64: Brazil Dermatological Therapeutics Industry Revenue (Million) Forecast, by Application 2019 & 2032
- Table 65: Argentina Dermatological Therapeutics Industry Revenue (Million) Forecast, by Application 2019 & 2032
- Table 66: Rest of South America Dermatological Therapeutics Industry Revenue (Million) Forecast, by Application 2019 & 2032
Frequently Asked Questions
1. What is the projected Compound Annual Growth Rate (CAGR) of the Dermatological Therapeutics Industry?
The projected CAGR is approximately 9.67%.
2. Which companies are prominent players in the Dermatological Therapeutics Industry?
Key companies in the market include Sun Pharmaceuticals Ltd, Novartis AG, Aurobindo Pharma Ltd*List Not Exhaustive, Amgen Inc, Eli Lilly and Company, Galderma SA, Abbvie Inc (Allergan PLC), Almirall SA, Johnson & Johnson, Bausch Health Companies Inc, LEO Pharma AS, Aclaris Therapeutics Inc, Bristol-Myers Squibb Company, GlaxoSmithKline PLC, Pfizer Inc.
3. What are the main segments of the Dermatological Therapeutics Industry?
The market segments include Application, Drug Class.
4. Can you provide details about the market size?
The market size is estimated to be USD 45.17 Million as of 2022.
5. What are some drivers contributing to market growth?
Growing Burden of Dermatology Diseases; Increasing Awareness Levels of Disease Progression and Etiology; Increasing Elderly Population.
6. What are the notable trends driving market growth?
Psoriasis Segment is Expected to Hold a Significant Market Share Over the Forecast Period.
7. Are there any restraints impacting market growth?
Serious Side Effects for Certain Classes of Therapeutic Drugs.
8. Can you provide examples of recent developments in the market?
In September 2022, the US FDA approved Sotyktu (deucravacitinib), an oral treatment for adults with moderate-to-severe plaque psoriasis who are candidates for systemic therapy or phototherapy.
9. What pricing options are available for accessing the report?
Pricing options include single-user, multi-user, and enterprise licenses priced at USD 4750, USD 5250, and USD 8750 respectively.
10. Is the market size provided in terms of value or volume?
The market size is provided in terms of value, measured in Million.
11. Are there any specific market keywords associated with the report?
Yes, the market keyword associated with the report is "Dermatological Therapeutics Industry," which aids in identifying and referencing the specific market segment covered.
12. How do I determine which pricing option suits my needs best?
The pricing options vary based on user requirements and access needs. Individual users may opt for single-user licenses, while businesses requiring broader access may choose multi-user or enterprise licenses for cost-effective access to the report.
13. Are there any additional resources or data provided in the Dermatological Therapeutics Industry report?
While the report offers comprehensive insights, it's advisable to review the specific contents or supplementary materials provided to ascertain if additional resources or data are available.
14. How can I stay updated on further developments or reports in the Dermatological Therapeutics Industry?
To stay informed about further developments, trends, and reports in the Dermatological Therapeutics Industry, consider subscribing to industry newsletters, following relevant companies and organizations, or regularly checking reputable industry news sources and publications.
Methodology
Step 1 - Identification of Relevant Samples Size from Population Database


Step 2 - Approaches for Defining Global Market Size (Value, Volume* & Price*)

Note*: In applicable scenarios
Step 3 - Data Sources
Primary Research
- Web Analytics
- Survey Reports
- Research Institute
- Latest Research Reports
- Opinion Leaders
Secondary Research
- Annual Reports
- White Paper
- Latest Press Release
- Industry Association
- Paid Database
- Investor Presentations

Step 4 - Data Triangulation
Involves using different sources of information in order to increase the validity of a study
These sources are likely to be stakeholders in a program - participants, other researchers, program staff, other community members, and so on.
Then we put all data in single framework & apply various statistical tools to find out the dynamic on the market.
During the analysis stage, feedback from the stakeholder groups would be compared to determine areas of agreement as well as areas of divergence
