

Key Insights
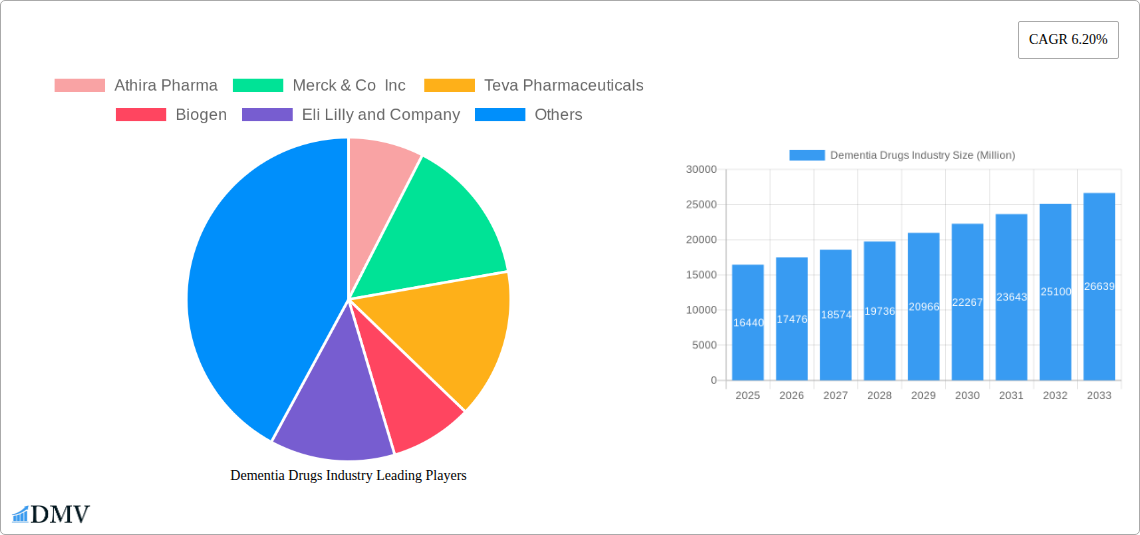
The Dementia Drugs market, valued at $16.44 billion in 2025, is poised for substantial growth, exhibiting a Compound Annual Growth Rate (CAGR) of 6.20% from 2025 to 2033. This expansion is driven by several key factors. The aging global population is a primary driver, leading to a significant increase in the prevalence of dementia, including Alzheimer's disease, Parkinson's disease dementia, and Lewy body dementia. Furthermore, ongoing research and development efforts are yielding novel therapeutic approaches, expanding treatment options and improving patient outcomes. Increased awareness and improved diagnostic capabilities also contribute to market growth, leading to earlier diagnosis and treatment initiation. However, high drug costs and the complex nature of dementia, often requiring multi-faceted care strategies, present significant challenges to market expansion. The market is segmented by indication (Alzheimer's Disease, Parkinson's Disease Dementia, Lewy Body Dementia, Vascular Dementia, and Other Indications) and drug class (Cholinesterase Inhibitors, MAO Inhibitors, and Glutamate Inhibitors), reflecting the diverse therapeutic approaches targeting this multifaceted condition. Competition is intense, with major pharmaceutical companies like Biogen, Eli Lilly, and AstraZeneca vying for market share alongside emerging biotech firms developing innovative treatments.
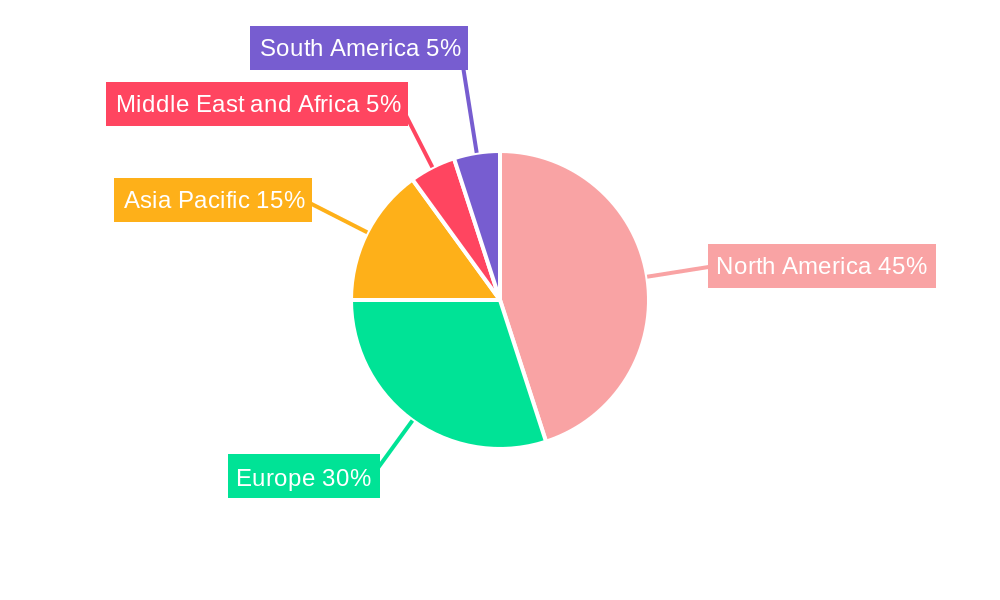
The geographical distribution of the Dementia Drugs market is diverse, with North America currently holding a significant market share due to high healthcare expenditure and a relatively large aging population. However, rapid growth is anticipated in the Asia-Pacific region driven by the increasing prevalence of dementia in countries like China and India, coupled with rising healthcare spending. Europe is another key market exhibiting steady growth, fueled by a similar demographic trend and advanced healthcare infrastructure. The competitive landscape is characterized by both established pharmaceutical giants and emerging biotechnology companies focusing on the development of innovative therapies. Strategic alliances, mergers, and acquisitions are expected to shape the market dynamics in the coming years. Future growth hinges on the successful development and launch of disease-modifying therapies offering more effective treatment options for dementia patients. Success in this area would significantly impact market size and further stimulate investment in research and development.
Dementia Drugs Industry: A Comprehensive Market Report (2019-2033)
This insightful report provides a comprehensive analysis of the Dementia Drugs industry, offering a detailed examination of market trends, leading players, and future growth projections from 2019 to 2033. The study period covers the historical period (2019-2024), the base year (2025), and the forecast period (2025-2033), with an estimated market value of xx Million in 2025. This report is essential for stakeholders including pharmaceutical companies, investors, researchers, and healthcare professionals seeking to understand this rapidly evolving market.
Dementia Drugs Industry Market Composition & Trends
The global Dementia Drugs market, valued at xx Million in 2024, is characterized by a moderately concentrated landscape with several key players holding significant market share. Market concentration is influenced by factors such as R&D investments, regulatory approvals, and successful product launches. Innovation is a key catalyst, driving the development of novel therapies targeting various dementia types. The regulatory landscape, varying across geographies, significantly impacts market access and drug approvals. Substitute products, while limited, include non-pharmacological interventions like cognitive stimulation therapies. End-users primarily consist of hospitals, clinics, and long-term care facilities. The industry witnesses frequent M&A activities, reflecting the high-stakes competition and pursuit of innovative drug pipelines.
- Market Share Distribution (2024): Top 5 players hold approximately xx% of the market share.
- M&A Deal Values (2019-2024): Total deal value estimated at xx Million. Examples include [mention specific notable M&A deals, if any data is available].
- Innovation Catalysts: Focus on novel drug mechanisms, improved bioavailability, and combination therapies.
- Regulatory Landscape: Stringent approval processes influence market entry timelines and overall growth.
Dementia Drugs Industry Industry Evolution
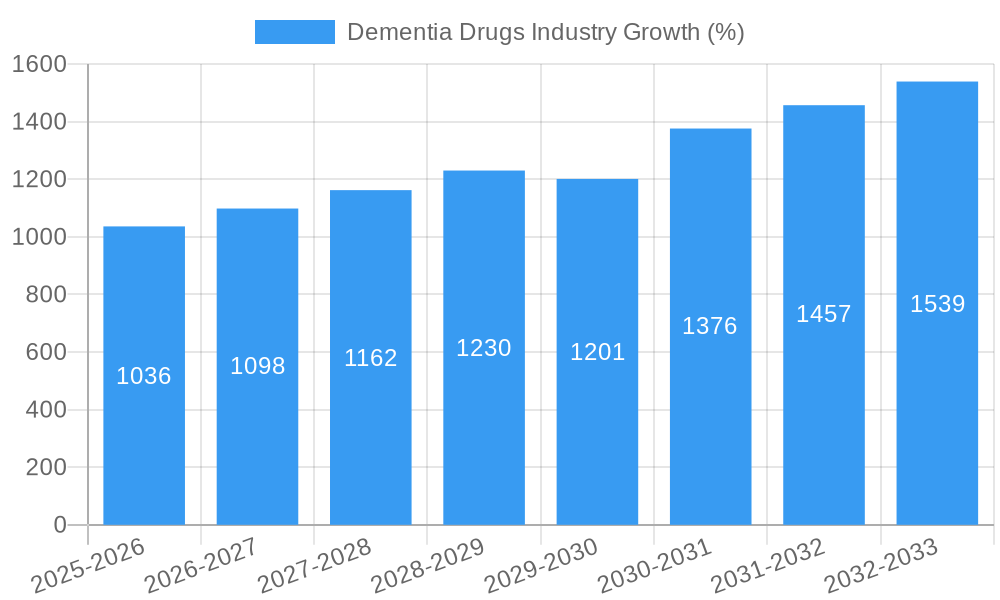
The Dementia Drugs market has experienced substantial growth from 2019 to 2024, driven by increasing prevalence of dementia, aging populations, and rising healthcare expenditure. The market is projected to grow at a CAGR of xx% during the forecast period (2025-2033), reaching xx Million by 2033. This growth is fueled by technological advancements in drug discovery and development, including the emergence of novel drug classes and targeted therapies. Furthermore, changing consumer demands are evident, with a greater focus on improved treatment outcomes, personalized medicine, and patient convenience. The adoption of new drugs is influenced by clinical trial results, regulatory approvals, and reimbursement policies.
Leading Regions, Countries, or Segments in Dementia Drugs Industry
The Alzheimer's Disease segment dominates the Dementia Drugs market by indication, followed by Vascular Dementia and Parkinson's Disease Dementia. By drug class, Cholinesterase Inhibitors hold the largest market share. North America represents the leading region due to high prevalence rates, advanced healthcare infrastructure, and substantial research investment. Europe and Asia Pacific follow as significant markets.
- Key Drivers (North America):
- High prevalence of Alzheimer's disease.
- Robust healthcare infrastructure.
- Significant R&D investments.
- Favorable regulatory environment.
- Key Drivers (Europe):
- Growing aging population.
- Increasing healthcare spending.
- Focus on early diagnosis and treatment.
- Key Drivers (Asia Pacific):
- Rising prevalence of dementia in emerging economies.
- Increasing healthcare awareness.
- Growing government initiatives to combat dementia.
Dementia Drugs Industry Product Innovations
Recent advancements in dementia drug development have focused on enhancing efficacy, improving drug delivery systems, and reducing side effects. Examples include transdermal patches for improved patient compliance and novel drug combinations to address multiple disease pathways. These innovations aim to improve patient outcomes and quality of life while addressing the limitations of existing therapies. Unique selling propositions often center on improved tolerability, efficacy in specific dementia subtypes, and convenience of administration.
Propelling Factors for Dementia Drugs Industry Growth
Several factors contribute to the growth of the Dementia Drugs industry. Technological advancements, especially in biomarker identification and targeted therapies, are crucial. The aging global population, increasing awareness, and expanding healthcare infrastructure contribute significantly. Favorable regulatory environments and increased healthcare spending in many regions further fuel market expansion. For example, the FDA approval of new treatments often leads to rapid market adoption.
Obstacles in the Dementia Drugs Industry Market
The Dementia Drugs market faces challenges such as the high cost of drug development, lengthy clinical trials, and stringent regulatory requirements. Supply chain disruptions can impact drug availability. Moreover, fierce competition among established players and emerging biotech companies poses a significant challenge. The high failure rate of clinical trials also represents a considerable obstacle for pharmaceutical companies investing in dementia drug research.
Future Opportunities in Dementia Drugs Industry
Future opportunities lie in developing effective disease-modifying therapies, targeting early stages of dementia, and personalized medicine approaches. The focus on combination therapies and advanced drug delivery systems offers substantial potential. Expansion into new markets, particularly in emerging economies with rapidly aging populations, provides significant growth opportunities. Finally, collaboration between academia, industry, and government is essential to accelerate progress in dementia research.
Major Players in the Dementia Drugs Industry Ecosystem
- Athira Pharma
- Merck & Co Inc
- Teva Pharmaceuticals
- Biogen
- Eli Lilly and Company
- AstraZeneca
- Johnson and Johnson
- SK Capital (Apotex Pharmaceutical Holdings Inc)
- Aurobindo Pharma
- Eisai Co Ltd
- Annovis Bio
- Zydus Cadila
- GlaxoSmithKline PLC
- Pfizer Inc
Key Developments in Dementia Drugs Industry Industry
- March 2022: Corium, Inc. received United States FDA approval for ADLARITY (donepezil transdermal system) for Alzheimer's disease.
- April 2022: NovaMedica developed and registered MIOREOL, a Donepezil and Memantine combination therapy, in Russia and the Eurasian Economic Union.
Strategic Dementia Drugs Industry Market Forecast
The Dementia Drugs market is poised for continued growth driven by the increasing prevalence of dementia globally, coupled with ongoing research and development efforts yielding innovative therapies. The market's future is bright, with significant opportunities in novel drug classes, improved delivery systems, and personalized medicine. Continued investment in research and development, alongside regulatory support, will be critical to unlocking the full potential of this important sector.
Dementia Drugs Industry Segmentation
-
1. Indications
- 1.1. Lewy Body Dementia
- 1.2. Parkinson's Disease Dementia
- 1.3. Alzheimer's Disease
- 1.4. Vascular Dementia
- 1.5. Other Indications
-
2. Drug Class
- 2.1. MAO Inhibitors
- 2.2. Glutamate Inhibitors
- 2.3. Cholinesterase Inhibitors
Dementia Drugs Industry Segmentation By Geography
-
1. North America
- 1.1. United States
- 1.2. Canada
- 1.3. Mexico
-
2. Europe
- 2.1. Germany
- 2.2. United Kingdom
- 2.3. France
- 2.4. Italy
- 2.5. Spain
- 2.6. Rest of Europe
-
3. Asia Pacific
- 3.1. China
- 3.2. Japan
- 3.3. India
- 3.4. Australia
- 3.5. South Korea
- 3.6. Rest of Asia Pacific
-
4. Middle East and Africa
- 4.1. GCC
- 4.2. South Africa
- 4.3. Rest of Middle East and Africa
-
5. South America
- 5.1. Brazil
- 5.2. Argentina
- 5.3. Rest of South America
Dementia Drugs Industry REPORT HIGHLIGHTS
| Aspects | Details |
|---|---|
| Study Period | 2019-2033 |
| Base Year | 2024 |
| Estimated Year | 2025 |
| Forecast Period | 2025-2033 |
| Historical Period | 2019-2024 |
| Growth Rate | CAGR of 6.20% from 2019-2033 |
| Segmentation |
|
Table of Contents
- 1. Introduction
- 1.1. Research Scope
- 1.2. Market Segmentation
- 1.3. Research Methodology
- 1.4. Definitions and Assumptions
- 2. Executive Summary
- 2.1. Introduction
- 3. Market Dynamics
- 3.1. Introduction
- 3.2. Market Drivers
- 3.2.1. Increasing Prevalence of Target Diseases; Introduction of New and Innovative Technologies and Drugs; Increased Government Funding and Awareness Programs
- 3.3. Market Restrains
- 3.3.1. High Failure Rates of Drugs at Approval Stages
- 3.4. Market Trends
- 3.4.1. The Alzheimer’s Disease Segment Hold a Significant Market Share and is Expected to Continue the Same Over the Forecast Period
- 4. Market Factor Analysis
- 4.1. Porters Five Forces
- 4.2. Supply/Value Chain
- 4.3. PESTEL analysis
- 4.4. Market Entropy
- 4.5. Patent/Trademark Analysis
- 5. Global Dementia Drugs Industry Analysis, Insights and Forecast, 2019-2031
- 5.1. Market Analysis, Insights and Forecast - by Indications
- 5.1.1. Lewy Body Dementia
- 5.1.2. Parkinson's Disease Dementia
- 5.1.3. Alzheimer's Disease
- 5.1.4. Vascular Dementia
- 5.1.5. Other Indications
- 5.2. Market Analysis, Insights and Forecast - by Drug Class
- 5.2.1. MAO Inhibitors
- 5.2.2. Glutamate Inhibitors
- 5.2.3. Cholinesterase Inhibitors
- 5.3. Market Analysis, Insights and Forecast - by Region
- 5.3.1. North America
- 5.3.2. Europe
- 5.3.3. Asia Pacific
- 5.3.4. Middle East and Africa
- 5.3.5. South America
- 5.1. Market Analysis, Insights and Forecast - by Indications
- 6. North America Dementia Drugs Industry Analysis, Insights and Forecast, 2019-2031
- 6.1. Market Analysis, Insights and Forecast - by Indications
- 6.1.1. Lewy Body Dementia
- 6.1.2. Parkinson's Disease Dementia
- 6.1.3. Alzheimer's Disease
- 6.1.4. Vascular Dementia
- 6.1.5. Other Indications
- 6.2. Market Analysis, Insights and Forecast - by Drug Class
- 6.2.1. MAO Inhibitors
- 6.2.2. Glutamate Inhibitors
- 6.2.3. Cholinesterase Inhibitors
- 6.1. Market Analysis, Insights and Forecast - by Indications
- 7. Europe Dementia Drugs Industry Analysis, Insights and Forecast, 2019-2031
- 7.1. Market Analysis, Insights and Forecast - by Indications
- 7.1.1. Lewy Body Dementia
- 7.1.2. Parkinson's Disease Dementia
- 7.1.3. Alzheimer's Disease
- 7.1.4. Vascular Dementia
- 7.1.5. Other Indications
- 7.2. Market Analysis, Insights and Forecast - by Drug Class
- 7.2.1. MAO Inhibitors
- 7.2.2. Glutamate Inhibitors
- 7.2.3. Cholinesterase Inhibitors
- 7.1. Market Analysis, Insights and Forecast - by Indications
- 8. Asia Pacific Dementia Drugs Industry Analysis, Insights and Forecast, 2019-2031
- 8.1. Market Analysis, Insights and Forecast - by Indications
- 8.1.1. Lewy Body Dementia
- 8.1.2. Parkinson's Disease Dementia
- 8.1.3. Alzheimer's Disease
- 8.1.4. Vascular Dementia
- 8.1.5. Other Indications
- 8.2. Market Analysis, Insights and Forecast - by Drug Class
- 8.2.1. MAO Inhibitors
- 8.2.2. Glutamate Inhibitors
- 8.2.3. Cholinesterase Inhibitors
- 8.1. Market Analysis, Insights and Forecast - by Indications
- 9. Middle East and Africa Dementia Drugs Industry Analysis, Insights and Forecast, 2019-2031
- 9.1. Market Analysis, Insights and Forecast - by Indications
- 9.1.1. Lewy Body Dementia
- 9.1.2. Parkinson's Disease Dementia
- 9.1.3. Alzheimer's Disease
- 9.1.4. Vascular Dementia
- 9.1.5. Other Indications
- 9.2. Market Analysis, Insights and Forecast - by Drug Class
- 9.2.1. MAO Inhibitors
- 9.2.2. Glutamate Inhibitors
- 9.2.3. Cholinesterase Inhibitors
- 9.1. Market Analysis, Insights and Forecast - by Indications
- 10. South America Dementia Drugs Industry Analysis, Insights and Forecast, 2019-2031
- 10.1. Market Analysis, Insights and Forecast - by Indications
- 10.1.1. Lewy Body Dementia
- 10.1.2. Parkinson's Disease Dementia
- 10.1.3. Alzheimer's Disease
- 10.1.4. Vascular Dementia
- 10.1.5. Other Indications
- 10.2. Market Analysis, Insights and Forecast - by Drug Class
- 10.2.1. MAO Inhibitors
- 10.2.2. Glutamate Inhibitors
- 10.2.3. Cholinesterase Inhibitors
- 10.1. Market Analysis, Insights and Forecast - by Indications
- 11. North America Dementia Drugs Industry Analysis, Insights and Forecast, 2019-2031
- 11.1. Market Analysis, Insights and Forecast - By Country/Sub-region
- 11.1.1 United States
- 11.1.2 Canada
- 11.1.3 Mexico
- 12. Europe Dementia Drugs Industry Analysis, Insights and Forecast, 2019-2031
- 12.1. Market Analysis, Insights and Forecast - By Country/Sub-region
- 12.1.1 Germany
- 12.1.2 United Kingdom
- 12.1.3 France
- 12.1.4 Italy
- 12.1.5 Spain
- 12.1.6 Rest of Europe
- 13. Asia Pacific Dementia Drugs Industry Analysis, Insights and Forecast, 2019-2031
- 13.1. Market Analysis, Insights and Forecast - By Country/Sub-region
- 13.1.1 China
- 13.1.2 Japan
- 13.1.3 India
- 13.1.4 Australia
- 13.1.5 South Korea
- 13.1.6 Rest of Asia Pacific
- 14. Middle East and Africa Dementia Drugs Industry Analysis, Insights and Forecast, 2019-2031
- 14.1. Market Analysis, Insights and Forecast - By Country/Sub-region
- 14.1.1 GCC
- 14.1.2 South Africa
- 14.1.3 Rest of Middle East and Africa
- 15. South America Dementia Drugs Industry Analysis, Insights and Forecast, 2019-2031
- 15.1. Market Analysis, Insights and Forecast - By Country/Sub-region
- 15.1.1 Brazil
- 15.1.2 Argentina
- 15.1.3 Rest of South America
- 16. Competitive Analysis
- 16.1. Global Market Share Analysis 2024
- 16.2. Company Profiles
- 16.2.1 Athira Pharma
- 16.2.1.1. Overview
- 16.2.1.2. Products
- 16.2.1.3. SWOT Analysis
- 16.2.1.4. Recent Developments
- 16.2.1.5. Financials (Based on Availability)
- 16.2.2 Merck & Co Inc
- 16.2.2.1. Overview
- 16.2.2.2. Products
- 16.2.2.3. SWOT Analysis
- 16.2.2.4. Recent Developments
- 16.2.2.5. Financials (Based on Availability)
- 16.2.3 Teva Pharmaceuticals
- 16.2.3.1. Overview
- 16.2.3.2. Products
- 16.2.3.3. SWOT Analysis
- 16.2.3.4. Recent Developments
- 16.2.3.5. Financials (Based on Availability)
- 16.2.4 Biogen
- 16.2.4.1. Overview
- 16.2.4.2. Products
- 16.2.4.3. SWOT Analysis
- 16.2.4.4. Recent Developments
- 16.2.4.5. Financials (Based on Availability)
- 16.2.5 Eli Lilly and Company
- 16.2.5.1. Overview
- 16.2.5.2. Products
- 16.2.5.3. SWOT Analysis
- 16.2.5.4. Recent Developments
- 16.2.5.5. Financials (Based on Availability)
- 16.2.6 AstraZeneca
- 16.2.6.1. Overview
- 16.2.6.2. Products
- 16.2.6.3. SWOT Analysis
- 16.2.6.4. Recent Developments
- 16.2.6.5. Financials (Based on Availability)
- 16.2.7 Johnson and Johnson
- 16.2.7.1. Overview
- 16.2.7.2. Products
- 16.2.7.3. SWOT Analysis
- 16.2.7.4. Recent Developments
- 16.2.7.5. Financials (Based on Availability)
- 16.2.8 SK Capital (Apotex Pharmaceutical Holdings Inc )
- 16.2.8.1. Overview
- 16.2.8.2. Products
- 16.2.8.3. SWOT Analysis
- 16.2.8.4. Recent Developments
- 16.2.8.5. Financials (Based on Availability)
- 16.2.9 Aurobindo Pharma
- 16.2.9.1. Overview
- 16.2.9.2. Products
- 16.2.9.3. SWOT Analysis
- 16.2.9.4. Recent Developments
- 16.2.9.5. Financials (Based on Availability)
- 16.2.10 Eisai Co Ltd
- 16.2.10.1. Overview
- 16.2.10.2. Products
- 16.2.10.3. SWOT Analysis
- 16.2.10.4. Recent Developments
- 16.2.10.5. Financials (Based on Availability)
- 16.2.11 Annovis Bio
- 16.2.11.1. Overview
- 16.2.11.2. Products
- 16.2.11.3. SWOT Analysis
- 16.2.11.4. Recent Developments
- 16.2.11.5. Financials (Based on Availability)
- 16.2.12 Zydus Cadila
- 16.2.12.1. Overview
- 16.2.12.2. Products
- 16.2.12.3. SWOT Analysis
- 16.2.12.4. Recent Developments
- 16.2.12.5. Financials (Based on Availability)
- 16.2.13 GlaxoSmithKline PLC
- 16.2.13.1. Overview
- 16.2.13.2. Products
- 16.2.13.3. SWOT Analysis
- 16.2.13.4. Recent Developments
- 16.2.13.5. Financials (Based on Availability)
- 16.2.14 Pfizer Inc
- 16.2.14.1. Overview
- 16.2.14.2. Products
- 16.2.14.3. SWOT Analysis
- 16.2.14.4. Recent Developments
- 16.2.14.5. Financials (Based on Availability)
- 16.2.1 Athira Pharma
List of Figures
- Figure 1: Global Dementia Drugs Industry Revenue Breakdown (Million, %) by Region 2024 & 2032
- Figure 2: Global Dementia Drugs Industry Volume Breakdown (K Unit, %) by Region 2024 & 2032
- Figure 3: North America Dementia Drugs Industry Revenue (Million), by Country 2024 & 2032
- Figure 4: North America Dementia Drugs Industry Volume (K Unit), by Country 2024 & 2032
- Figure 5: North America Dementia Drugs Industry Revenue Share (%), by Country 2024 & 2032
- Figure 6: North America Dementia Drugs Industry Volume Share (%), by Country 2024 & 2032
- Figure 7: Europe Dementia Drugs Industry Revenue (Million), by Country 2024 & 2032
- Figure 8: Europe Dementia Drugs Industry Volume (K Unit), by Country 2024 & 2032
- Figure 9: Europe Dementia Drugs Industry Revenue Share (%), by Country 2024 & 2032
- Figure 10: Europe Dementia Drugs Industry Volume Share (%), by Country 2024 & 2032
- Figure 11: Asia Pacific Dementia Drugs Industry Revenue (Million), by Country 2024 & 2032
- Figure 12: Asia Pacific Dementia Drugs Industry Volume (K Unit), by Country 2024 & 2032
- Figure 13: Asia Pacific Dementia Drugs Industry Revenue Share (%), by Country 2024 & 2032
- Figure 14: Asia Pacific Dementia Drugs Industry Volume Share (%), by Country 2024 & 2032
- Figure 15: Middle East and Africa Dementia Drugs Industry Revenue (Million), by Country 2024 & 2032
- Figure 16: Middle East and Africa Dementia Drugs Industry Volume (K Unit), by Country 2024 & 2032
- Figure 17: Middle East and Africa Dementia Drugs Industry Revenue Share (%), by Country 2024 & 2032
- Figure 18: Middle East and Africa Dementia Drugs Industry Volume Share (%), by Country 2024 & 2032
- Figure 19: South America Dementia Drugs Industry Revenue (Million), by Country 2024 & 2032
- Figure 20: South America Dementia Drugs Industry Volume (K Unit), by Country 2024 & 2032
- Figure 21: South America Dementia Drugs Industry Revenue Share (%), by Country 2024 & 2032
- Figure 22: South America Dementia Drugs Industry Volume Share (%), by Country 2024 & 2032
- Figure 23: North America Dementia Drugs Industry Revenue (Million), by Indications 2024 & 2032
- Figure 24: North America Dementia Drugs Industry Volume (K Unit), by Indications 2024 & 2032
- Figure 25: North America Dementia Drugs Industry Revenue Share (%), by Indications 2024 & 2032
- Figure 26: North America Dementia Drugs Industry Volume Share (%), by Indications 2024 & 2032
- Figure 27: North America Dementia Drugs Industry Revenue (Million), by Drug Class 2024 & 2032
- Figure 28: North America Dementia Drugs Industry Volume (K Unit), by Drug Class 2024 & 2032
- Figure 29: North America Dementia Drugs Industry Revenue Share (%), by Drug Class 2024 & 2032
- Figure 30: North America Dementia Drugs Industry Volume Share (%), by Drug Class 2024 & 2032
- Figure 31: North America Dementia Drugs Industry Revenue (Million), by Country 2024 & 2032
- Figure 32: North America Dementia Drugs Industry Volume (K Unit), by Country 2024 & 2032
- Figure 33: North America Dementia Drugs Industry Revenue Share (%), by Country 2024 & 2032
- Figure 34: North America Dementia Drugs Industry Volume Share (%), by Country 2024 & 2032
- Figure 35: Europe Dementia Drugs Industry Revenue (Million), by Indications 2024 & 2032
- Figure 36: Europe Dementia Drugs Industry Volume (K Unit), by Indications 2024 & 2032
- Figure 37: Europe Dementia Drugs Industry Revenue Share (%), by Indications 2024 & 2032
- Figure 38: Europe Dementia Drugs Industry Volume Share (%), by Indications 2024 & 2032
- Figure 39: Europe Dementia Drugs Industry Revenue (Million), by Drug Class 2024 & 2032
- Figure 40: Europe Dementia Drugs Industry Volume (K Unit), by Drug Class 2024 & 2032
- Figure 41: Europe Dementia Drugs Industry Revenue Share (%), by Drug Class 2024 & 2032
- Figure 42: Europe Dementia Drugs Industry Volume Share (%), by Drug Class 2024 & 2032
- Figure 43: Europe Dementia Drugs Industry Revenue (Million), by Country 2024 & 2032
- Figure 44: Europe Dementia Drugs Industry Volume (K Unit), by Country 2024 & 2032
- Figure 45: Europe Dementia Drugs Industry Revenue Share (%), by Country 2024 & 2032
- Figure 46: Europe Dementia Drugs Industry Volume Share (%), by Country 2024 & 2032
- Figure 47: Asia Pacific Dementia Drugs Industry Revenue (Million), by Indications 2024 & 2032
- Figure 48: Asia Pacific Dementia Drugs Industry Volume (K Unit), by Indications 2024 & 2032
- Figure 49: Asia Pacific Dementia Drugs Industry Revenue Share (%), by Indications 2024 & 2032
- Figure 50: Asia Pacific Dementia Drugs Industry Volume Share (%), by Indications 2024 & 2032
- Figure 51: Asia Pacific Dementia Drugs Industry Revenue (Million), by Drug Class 2024 & 2032
- Figure 52: Asia Pacific Dementia Drugs Industry Volume (K Unit), by Drug Class 2024 & 2032
- Figure 53: Asia Pacific Dementia Drugs Industry Revenue Share (%), by Drug Class 2024 & 2032
- Figure 54: Asia Pacific Dementia Drugs Industry Volume Share (%), by Drug Class 2024 & 2032
- Figure 55: Asia Pacific Dementia Drugs Industry Revenue (Million), by Country 2024 & 2032
- Figure 56: Asia Pacific Dementia Drugs Industry Volume (K Unit), by Country 2024 & 2032
- Figure 57: Asia Pacific Dementia Drugs Industry Revenue Share (%), by Country 2024 & 2032
- Figure 58: Asia Pacific Dementia Drugs Industry Volume Share (%), by Country 2024 & 2032
- Figure 59: Middle East and Africa Dementia Drugs Industry Revenue (Million), by Indications 2024 & 2032
- Figure 60: Middle East and Africa Dementia Drugs Industry Volume (K Unit), by Indications 2024 & 2032
- Figure 61: Middle East and Africa Dementia Drugs Industry Revenue Share (%), by Indications 2024 & 2032
- Figure 62: Middle East and Africa Dementia Drugs Industry Volume Share (%), by Indications 2024 & 2032
- Figure 63: Middle East and Africa Dementia Drugs Industry Revenue (Million), by Drug Class 2024 & 2032
- Figure 64: Middle East and Africa Dementia Drugs Industry Volume (K Unit), by Drug Class 2024 & 2032
- Figure 65: Middle East and Africa Dementia Drugs Industry Revenue Share (%), by Drug Class 2024 & 2032
- Figure 66: Middle East and Africa Dementia Drugs Industry Volume Share (%), by Drug Class 2024 & 2032
- Figure 67: Middle East and Africa Dementia Drugs Industry Revenue (Million), by Country 2024 & 2032
- Figure 68: Middle East and Africa Dementia Drugs Industry Volume (K Unit), by Country 2024 & 2032
- Figure 69: Middle East and Africa Dementia Drugs Industry Revenue Share (%), by Country 2024 & 2032
- Figure 70: Middle East and Africa Dementia Drugs Industry Volume Share (%), by Country 2024 & 2032
- Figure 71: South America Dementia Drugs Industry Revenue (Million), by Indications 2024 & 2032
- Figure 72: South America Dementia Drugs Industry Volume (K Unit), by Indications 2024 & 2032
- Figure 73: South America Dementia Drugs Industry Revenue Share (%), by Indications 2024 & 2032
- Figure 74: South America Dementia Drugs Industry Volume Share (%), by Indications 2024 & 2032
- Figure 75: South America Dementia Drugs Industry Revenue (Million), by Drug Class 2024 & 2032
- Figure 76: South America Dementia Drugs Industry Volume (K Unit), by Drug Class 2024 & 2032
- Figure 77: South America Dementia Drugs Industry Revenue Share (%), by Drug Class 2024 & 2032
- Figure 78: South America Dementia Drugs Industry Volume Share (%), by Drug Class 2024 & 2032
- Figure 79: South America Dementia Drugs Industry Revenue (Million), by Country 2024 & 2032
- Figure 80: South America Dementia Drugs Industry Volume (K Unit), by Country 2024 & 2032
- Figure 81: South America Dementia Drugs Industry Revenue Share (%), by Country 2024 & 2032
- Figure 82: South America Dementia Drugs Industry Volume Share (%), by Country 2024 & 2032
List of Tables
- Table 1: Global Dementia Drugs Industry Revenue Million Forecast, by Region 2019 & 2032
- Table 2: Global Dementia Drugs Industry Volume K Unit Forecast, by Region 2019 & 2032
- Table 3: Global Dementia Drugs Industry Revenue Million Forecast, by Indications 2019 & 2032
- Table 4: Global Dementia Drugs Industry Volume K Unit Forecast, by Indications 2019 & 2032
- Table 5: Global Dementia Drugs Industry Revenue Million Forecast, by Drug Class 2019 & 2032
- Table 6: Global Dementia Drugs Industry Volume K Unit Forecast, by Drug Class 2019 & 2032
- Table 7: Global Dementia Drugs Industry Revenue Million Forecast, by Region 2019 & 2032
- Table 8: Global Dementia Drugs Industry Volume K Unit Forecast, by Region 2019 & 2032
- Table 9: Global Dementia Drugs Industry Revenue Million Forecast, by Country 2019 & 2032
- Table 10: Global Dementia Drugs Industry Volume K Unit Forecast, by Country 2019 & 2032
- Table 11: United States Dementia Drugs Industry Revenue (Million) Forecast, by Application 2019 & 2032
- Table 12: United States Dementia Drugs Industry Volume (K Unit) Forecast, by Application 2019 & 2032
- Table 13: Canada Dementia Drugs Industry Revenue (Million) Forecast, by Application 2019 & 2032
- Table 14: Canada Dementia Drugs Industry Volume (K Unit) Forecast, by Application 2019 & 2032
- Table 15: Mexico Dementia Drugs Industry Revenue (Million) Forecast, by Application 2019 & 2032
- Table 16: Mexico Dementia Drugs Industry Volume (K Unit) Forecast, by Application 2019 & 2032
- Table 17: Global Dementia Drugs Industry Revenue Million Forecast, by Country 2019 & 2032
- Table 18: Global Dementia Drugs Industry Volume K Unit Forecast, by Country 2019 & 2032
- Table 19: Germany Dementia Drugs Industry Revenue (Million) Forecast, by Application 2019 & 2032
- Table 20: Germany Dementia Drugs Industry Volume (K Unit) Forecast, by Application 2019 & 2032
- Table 21: United Kingdom Dementia Drugs Industry Revenue (Million) Forecast, by Application 2019 & 2032
- Table 22: United Kingdom Dementia Drugs Industry Volume (K Unit) Forecast, by Application 2019 & 2032
- Table 23: France Dementia Drugs Industry Revenue (Million) Forecast, by Application 2019 & 2032
- Table 24: France Dementia Drugs Industry Volume (K Unit) Forecast, by Application 2019 & 2032
- Table 25: Italy Dementia Drugs Industry Revenue (Million) Forecast, by Application 2019 & 2032
- Table 26: Italy Dementia Drugs Industry Volume (K Unit) Forecast, by Application 2019 & 2032
- Table 27: Spain Dementia Drugs Industry Revenue (Million) Forecast, by Application 2019 & 2032
- Table 28: Spain Dementia Drugs Industry Volume (K Unit) Forecast, by Application 2019 & 2032
- Table 29: Rest of Europe Dementia Drugs Industry Revenue (Million) Forecast, by Application 2019 & 2032
- Table 30: Rest of Europe Dementia Drugs Industry Volume (K Unit) Forecast, by Application 2019 & 2032
- Table 31: Global Dementia Drugs Industry Revenue Million Forecast, by Country 2019 & 2032
- Table 32: Global Dementia Drugs Industry Volume K Unit Forecast, by Country 2019 & 2032
- Table 33: China Dementia Drugs Industry Revenue (Million) Forecast, by Application 2019 & 2032
- Table 34: China Dementia Drugs Industry Volume (K Unit) Forecast, by Application 2019 & 2032
- Table 35: Japan Dementia Drugs Industry Revenue (Million) Forecast, by Application 2019 & 2032
- Table 36: Japan Dementia Drugs Industry Volume (K Unit) Forecast, by Application 2019 & 2032
- Table 37: India Dementia Drugs Industry Revenue (Million) Forecast, by Application 2019 & 2032
- Table 38: India Dementia Drugs Industry Volume (K Unit) Forecast, by Application 2019 & 2032
- Table 39: Australia Dementia Drugs Industry Revenue (Million) Forecast, by Application 2019 & 2032
- Table 40: Australia Dementia Drugs Industry Volume (K Unit) Forecast, by Application 2019 & 2032
- Table 41: South Korea Dementia Drugs Industry Revenue (Million) Forecast, by Application 2019 & 2032
- Table 42: South Korea Dementia Drugs Industry Volume (K Unit) Forecast, by Application 2019 & 2032
- Table 43: Rest of Asia Pacific Dementia Drugs Industry Revenue (Million) Forecast, by Application 2019 & 2032
- Table 44: Rest of Asia Pacific Dementia Drugs Industry Volume (K Unit) Forecast, by Application 2019 & 2032
- Table 45: Global Dementia Drugs Industry Revenue Million Forecast, by Country 2019 & 2032
- Table 46: Global Dementia Drugs Industry Volume K Unit Forecast, by Country 2019 & 2032
- Table 47: GCC Dementia Drugs Industry Revenue (Million) Forecast, by Application 2019 & 2032
- Table 48: GCC Dementia Drugs Industry Volume (K Unit) Forecast, by Application 2019 & 2032
- Table 49: South Africa Dementia Drugs Industry Revenue (Million) Forecast, by Application 2019 & 2032
- Table 50: South Africa Dementia Drugs Industry Volume (K Unit) Forecast, by Application 2019 & 2032
- Table 51: Rest of Middle East and Africa Dementia Drugs Industry Revenue (Million) Forecast, by Application 2019 & 2032
- Table 52: Rest of Middle East and Africa Dementia Drugs Industry Volume (K Unit) Forecast, by Application 2019 & 2032
- Table 53: Global Dementia Drugs Industry Revenue Million Forecast, by Country 2019 & 2032
- Table 54: Global Dementia Drugs Industry Volume K Unit Forecast, by Country 2019 & 2032
- Table 55: Brazil Dementia Drugs Industry Revenue (Million) Forecast, by Application 2019 & 2032
- Table 56: Brazil Dementia Drugs Industry Volume (K Unit) Forecast, by Application 2019 & 2032
- Table 57: Argentina Dementia Drugs Industry Revenue (Million) Forecast, by Application 2019 & 2032
- Table 58: Argentina Dementia Drugs Industry Volume (K Unit) Forecast, by Application 2019 & 2032
- Table 59: Rest of South America Dementia Drugs Industry Revenue (Million) Forecast, by Application 2019 & 2032
- Table 60: Rest of South America Dementia Drugs Industry Volume (K Unit) Forecast, by Application 2019 & 2032
- Table 61: Global Dementia Drugs Industry Revenue Million Forecast, by Indications 2019 & 2032
- Table 62: Global Dementia Drugs Industry Volume K Unit Forecast, by Indications 2019 & 2032
- Table 63: Global Dementia Drugs Industry Revenue Million Forecast, by Drug Class 2019 & 2032
- Table 64: Global Dementia Drugs Industry Volume K Unit Forecast, by Drug Class 2019 & 2032
- Table 65: Global Dementia Drugs Industry Revenue Million Forecast, by Country 2019 & 2032
- Table 66: Global Dementia Drugs Industry Volume K Unit Forecast, by Country 2019 & 2032
- Table 67: United States Dementia Drugs Industry Revenue (Million) Forecast, by Application 2019 & 2032
- Table 68: United States Dementia Drugs Industry Volume (K Unit) Forecast, by Application 2019 & 2032
- Table 69: Canada Dementia Drugs Industry Revenue (Million) Forecast, by Application 2019 & 2032
- Table 70: Canada Dementia Drugs Industry Volume (K Unit) Forecast, by Application 2019 & 2032
- Table 71: Mexico Dementia Drugs Industry Revenue (Million) Forecast, by Application 2019 & 2032
- Table 72: Mexico Dementia Drugs Industry Volume (K Unit) Forecast, by Application 2019 & 2032
- Table 73: Global Dementia Drugs Industry Revenue Million Forecast, by Indications 2019 & 2032
- Table 74: Global Dementia Drugs Industry Volume K Unit Forecast, by Indications 2019 & 2032
- Table 75: Global Dementia Drugs Industry Revenue Million Forecast, by Drug Class 2019 & 2032
- Table 76: Global Dementia Drugs Industry Volume K Unit Forecast, by Drug Class 2019 & 2032
- Table 77: Global Dementia Drugs Industry Revenue Million Forecast, by Country 2019 & 2032
- Table 78: Global Dementia Drugs Industry Volume K Unit Forecast, by Country 2019 & 2032
- Table 79: Germany Dementia Drugs Industry Revenue (Million) Forecast, by Application 2019 & 2032
- Table 80: Germany Dementia Drugs Industry Volume (K Unit) Forecast, by Application 2019 & 2032
- Table 81: United Kingdom Dementia Drugs Industry Revenue (Million) Forecast, by Application 2019 & 2032
- Table 82: United Kingdom Dementia Drugs Industry Volume (K Unit) Forecast, by Application 2019 & 2032
- Table 83: France Dementia Drugs Industry Revenue (Million) Forecast, by Application 2019 & 2032
- Table 84: France Dementia Drugs Industry Volume (K Unit) Forecast, by Application 2019 & 2032
- Table 85: Italy Dementia Drugs Industry Revenue (Million) Forecast, by Application 2019 & 2032
- Table 86: Italy Dementia Drugs Industry Volume (K Unit) Forecast, by Application 2019 & 2032
- Table 87: Spain Dementia Drugs Industry Revenue (Million) Forecast, by Application 2019 & 2032
- Table 88: Spain Dementia Drugs Industry Volume (K Unit) Forecast, by Application 2019 & 2032
- Table 89: Rest of Europe Dementia Drugs Industry Revenue (Million) Forecast, by Application 2019 & 2032
- Table 90: Rest of Europe Dementia Drugs Industry Volume (K Unit) Forecast, by Application 2019 & 2032
- Table 91: Global Dementia Drugs Industry Revenue Million Forecast, by Indications 2019 & 2032
- Table 92: Global Dementia Drugs Industry Volume K Unit Forecast, by Indications 2019 & 2032
- Table 93: Global Dementia Drugs Industry Revenue Million Forecast, by Drug Class 2019 & 2032
- Table 94: Global Dementia Drugs Industry Volume K Unit Forecast, by Drug Class 2019 & 2032
- Table 95: Global Dementia Drugs Industry Revenue Million Forecast, by Country 2019 & 2032
- Table 96: Global Dementia Drugs Industry Volume K Unit Forecast, by Country 2019 & 2032
- Table 97: China Dementia Drugs Industry Revenue (Million) Forecast, by Application 2019 & 2032
- Table 98: China Dementia Drugs Industry Volume (K Unit) Forecast, by Application 2019 & 2032
- Table 99: Japan Dementia Drugs Industry Revenue (Million) Forecast, by Application 2019 & 2032
- Table 100: Japan Dementia Drugs Industry Volume (K Unit) Forecast, by Application 2019 & 2032
- Table 101: India Dementia Drugs Industry Revenue (Million) Forecast, by Application 2019 & 2032
- Table 102: India Dementia Drugs Industry Volume (K Unit) Forecast, by Application 2019 & 2032
- Table 103: Australia Dementia Drugs Industry Revenue (Million) Forecast, by Application 2019 & 2032
- Table 104: Australia Dementia Drugs Industry Volume (K Unit) Forecast, by Application 2019 & 2032
- Table 105: South Korea Dementia Drugs Industry Revenue (Million) Forecast, by Application 2019 & 2032
- Table 106: South Korea Dementia Drugs Industry Volume (K Unit) Forecast, by Application 2019 & 2032
- Table 107: Rest of Asia Pacific Dementia Drugs Industry Revenue (Million) Forecast, by Application 2019 & 2032
- Table 108: Rest of Asia Pacific Dementia Drugs Industry Volume (K Unit) Forecast, by Application 2019 & 2032
- Table 109: Global Dementia Drugs Industry Revenue Million Forecast, by Indications 2019 & 2032
- Table 110: Global Dementia Drugs Industry Volume K Unit Forecast, by Indications 2019 & 2032
- Table 111: Global Dementia Drugs Industry Revenue Million Forecast, by Drug Class 2019 & 2032
- Table 112: Global Dementia Drugs Industry Volume K Unit Forecast, by Drug Class 2019 & 2032
- Table 113: Global Dementia Drugs Industry Revenue Million Forecast, by Country 2019 & 2032
- Table 114: Global Dementia Drugs Industry Volume K Unit Forecast, by Country 2019 & 2032
- Table 115: GCC Dementia Drugs Industry Revenue (Million) Forecast, by Application 2019 & 2032
- Table 116: GCC Dementia Drugs Industry Volume (K Unit) Forecast, by Application 2019 & 2032
- Table 117: South Africa Dementia Drugs Industry Revenue (Million) Forecast, by Application 2019 & 2032
- Table 118: South Africa Dementia Drugs Industry Volume (K Unit) Forecast, by Application 2019 & 2032
- Table 119: Rest of Middle East and Africa Dementia Drugs Industry Revenue (Million) Forecast, by Application 2019 & 2032
- Table 120: Rest of Middle East and Africa Dementia Drugs Industry Volume (K Unit) Forecast, by Application 2019 & 2032
- Table 121: Global Dementia Drugs Industry Revenue Million Forecast, by Indications 2019 & 2032
- Table 122: Global Dementia Drugs Industry Volume K Unit Forecast, by Indications 2019 & 2032
- Table 123: Global Dementia Drugs Industry Revenue Million Forecast, by Drug Class 2019 & 2032
- Table 124: Global Dementia Drugs Industry Volume K Unit Forecast, by Drug Class 2019 & 2032
- Table 125: Global Dementia Drugs Industry Revenue Million Forecast, by Country 2019 & 2032
- Table 126: Global Dementia Drugs Industry Volume K Unit Forecast, by Country 2019 & 2032
- Table 127: Brazil Dementia Drugs Industry Revenue (Million) Forecast, by Application 2019 & 2032
- Table 128: Brazil Dementia Drugs Industry Volume (K Unit) Forecast, by Application 2019 & 2032
- Table 129: Argentina Dementia Drugs Industry Revenue (Million) Forecast, by Application 2019 & 2032
- Table 130: Argentina Dementia Drugs Industry Volume (K Unit) Forecast, by Application 2019 & 2032
- Table 131: Rest of South America Dementia Drugs Industry Revenue (Million) Forecast, by Application 2019 & 2032
- Table 132: Rest of South America Dementia Drugs Industry Volume (K Unit) Forecast, by Application 2019 & 2032
Frequently Asked Questions
1. What is the projected Compound Annual Growth Rate (CAGR) of the Dementia Drugs Industry?
The projected CAGR is approximately 6.20%.
2. Which companies are prominent players in the Dementia Drugs Industry?
Key companies in the market include Athira Pharma, Merck & Co Inc , Teva Pharmaceuticals, Biogen, Eli Lilly and Company, AstraZeneca, Johnson and Johnson, SK Capital (Apotex Pharmaceutical Holdings Inc ), Aurobindo Pharma, Eisai Co Ltd, Annovis Bio, Zydus Cadila, GlaxoSmithKline PLC, Pfizer Inc.
3. What are the main segments of the Dementia Drugs Industry?
The market segments include Indications, Drug Class.
4. Can you provide details about the market size?
The market size is estimated to be USD 16.44 Million as of 2022.
5. What are some drivers contributing to market growth?
Increasing Prevalence of Target Diseases; Introduction of New and Innovative Technologies and Drugs; Increased Government Funding and Awareness Programs.
6. What are the notable trends driving market growth?
The Alzheimer’s Disease Segment Hold a Significant Market Share and is Expected to Continue the Same Over the Forecast Period.
7. Are there any restraints impacting market growth?
High Failure Rates of Drugs at Approval Stages.
8. Can you provide examples of recent developments in the market?
April 2022- NovaMedica developed and registered an innovative combination of Donepezil and Memantine molecules, the primary therapies for dementia associated with Alzheimer's disease. The drug is registered under the name MIOREOL. This is one of the combinations in the Russian market and the markets of the Eurasian Economic Union members and Europe.
9. What pricing options are available for accessing the report?
Pricing options include single-user, multi-user, and enterprise licenses priced at USD 4750, USD 5250, and USD 8750 respectively.
10. Is the market size provided in terms of value or volume?
The market size is provided in terms of value, measured in Million and volume, measured in K Unit.
11. Are there any specific market keywords associated with the report?
Yes, the market keyword associated with the report is "Dementia Drugs Industry," which aids in identifying and referencing the specific market segment covered.
12. How do I determine which pricing option suits my needs best?
The pricing options vary based on user requirements and access needs. Individual users may opt for single-user licenses, while businesses requiring broader access may choose multi-user or enterprise licenses for cost-effective access to the report.
13. Are there any additional resources or data provided in the Dementia Drugs Industry report?
While the report offers comprehensive insights, it's advisable to review the specific contents or supplementary materials provided to ascertain if additional resources or data are available.
14. How can I stay updated on further developments or reports in the Dementia Drugs Industry?
To stay informed about further developments, trends, and reports in the Dementia Drugs Industry, consider subscribing to industry newsletters, following relevant companies and organizations, or regularly checking reputable industry news sources and publications.
Methodology
Step 1 - Identification of Relevant Samples Size from Population Database


Step 2 - Approaches for Defining Global Market Size (Value, Volume* & Price*)

Note*: In applicable scenarios
Step 3 - Data Sources
Primary Research
- Web Analytics
- Survey Reports
- Research Institute
- Latest Research Reports
- Opinion Leaders
Secondary Research
- Annual Reports
- White Paper
- Latest Press Release
- Industry Association
- Paid Database
- Investor Presentations

Step 4 - Data Triangulation
Involves using different sources of information in order to increase the validity of a study
These sources are likely to be stakeholders in a program - participants, other researchers, program staff, other community members, and so on.
Then we put all data in single framework & apply various statistical tools to find out the dynamic on the market.
During the analysis stage, feedback from the stakeholder groups would be compared to determine areas of agreement as well as areas of divergence
